. 2022 Aug 1;221(8):e202110057.
doi: 10.1083/jcb.202110057. Epub 2022 Jul 13.

JIP3 interacts with dynein and kinesin-1 to regulate bidirectional organelle transport

Affiliations

JIP3 interacts with dynein and kinesin-1 to regulate bidirectional organelle transport

Ricardo Celestino et al. J Cell Biol. .

Abstract

The MAP kinase and motor scaffold JIP3 prevents excess lysosome accumulation in axons of vertebrates and invertebrates. How JIP3's interaction with dynein and kinesin-1 contributes to organelle clearance is unclear. We show that human dynein light intermediate chain (DLIC) binds the N-terminal RH1 domain of JIP3, its paralog JIP4, and the lysosomal adaptor RILP. A point mutation in RH1 abrogates DLIC binding without perturbing the interaction between JIP3's RH1 domain and kinesin heavy chain. Characterization of this separation-of-function mutation in Caenorhabditis elegans shows that JIP3-bound dynein is required for organelle clearance in the anterior process of touch receptor neurons. Unlike JIP3 null mutants, JIP3 that cannot bind DLIC causes prominent accumulation of endo-lysosomal organelles at the neurite tip, which is rescued by a disease-associated point mutation in JIP3's leucine zipper that abrogates kinesin light chain binding. These results highlight that RH1 domains are interaction hubs for cytoskeletal motors and suggest that JIP3-bound dynein and kinesin-1 participate in bidirectional organelle transport.


Figures

Figure 1.
Figure 1.
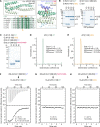
Dynein adaptors of the RILP/JIP3 superfamily use their N-terminal RH1 domain to bind the C-terminal helix 1 of dynein light intermediate chain. (A) Domain organization of human dynein light intermediate chain 1 (DLIC1) and the five human cargo adaptors for cytoskeletal motors characterized by the presence of RILP homology (RH) 1 and RH2 domains. JIP3 and JIP4 also have a second coiled-coil region, here called the leucine zipper (LZ) domain. Regions implicated in direct protein-protein interactions are delineated by dashed lines. Residue numbers correspond to UniProt entries Q96NA2-1 (RILP), Q5EBL4-1 (RILPL1), Q969X0 (RILPL2), Q9UPT6-1 (JIP3), O60271-1 (JIP4), and Q9Y6G9 (DLIC1). (B and C) Left: Coomassie Blue-stained SDS-PAGE gel of purified recombinant protein mixtures prior to the addition of glutathione agarose resin (Input). Right: Coomassie Blue-stained SDS-PAGE gel of proteins eluted from glutathione agarose resin after GST pull-down. Proteins correspond to the human homologs described in A except for RILPL1, which is the mouse homolog (Q9JJC6). Molecular weight is indicated in kilodaltons (kD). (D–F) Elution profiles (top) and Coomassie Blue-stained SDS-PAGE gels (bottom) of purified recombinant human proteins after size exclusion chromatography on a Superdex 200 Increase 10/300 GL column. The elution profile and gel for RILP[1-106] are the same in D–F. Molecular weight is indicated in kilodaltons (kD). Source data are available for this figure: SourceData F1.
Figure 2.
Figure 2.
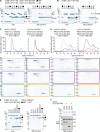
The C-terminal amphipathic helix 1 of dynein light intermediate chain binds the RH1 domain’s hydrophobic pocket. (A) Top left: Model of the dimeric RH1 domain of human JIP3 (UniProt entry Q9UPT6-1) generated using ColabFold (Mirdita et al., 2022). Bottom left: Sequence alignment of the α3N helix for the RILP/JIP3 superfamily. Open circles denote residues participating in dimer formation in mouse RILPL2 (Wei et al., 2013). Closed circles denote residues participating in the interaction between RILPL2 and myosin Va. Arrowhead points to the valine residue that forms part of the RH1 domain’s hydrophobic pocket and whose mutation to glutamine in RILPL2 abrogates the interaction with myosin Va. Right: Model of the JIP3 RH1 domain’s 4-helix bundle with the C-terminal helix 1 of DLIC1 (residues 440–455) docked at the hydrophobic pocket, as predicted by ColabFold. A phenylalanine and a valine side chain in DLIC1 and JIP3, respectively, which we mutate in this study, are also rendered. The models have a per-residue confidence (pLDDT) of >90% throughout and a consistently low alignment error (PAE) (Fig. S2 A; Tunyasuvunakool et al., 2021). (B) Left: Coomassie Blue-stained SDS-PAGE gel of purified recombinant protein mixtures prior to the addition of glutathione agarose resin (Input). Right: Coomassie Blue-stained SDS-PAGE gel of proteins eluted from glutathione agarose resin after GST pull-down. Proteins correspond to the human homologs. WT denotes wild-type. Molecular weight is indicated in kilodaltons (kD). (C) Coomassie Blue-stained SDS-PAGE gel of purified recombinant human proteins used in AUC and ITC experiments. Molecular weight is indicated in kilodaltons (kD). (D and E) Sedimentation velocity AUC profiles with theoretical (MWcalculated) and experimentally measured molecular mass (MWobserved). The MWobserved values indicate that both proteins are dimeric in solution. (F–H) Thermograms and binding isotherms of representative ITC titrations. JIP3[1-108] concentration is the concentration of the dimer. The dissociation constant (KD) and the binding stoichiometry (N) are given as mean ± SD (n = 3) and were derived from fitting to the binding isotherm (black line) with a One Set of Sites model using ORIGIN software. Source data are available for this figure: SourceData F2.
Figure 3.
Figure 3.
Kinesin heavy chain also binds to the RH1 domain of JIP3 but does not compete for binding with dynein light intermediate chain. (A and B) Left: Coomassie Blue-stained SDS-PAGE gel of purified recombinant protein mixtures prior to the addition of glutathione agarose resin (Input). Right: Coomassie Blue-stained SDS-PAGE gel of proteins eluted from glutathione agarose resin after GST pull-down. Proteins correspond to the human homologs and to mouse kinesin heavy chain KIF5C (UniProt entry P28738). Molecular weight is indicated in kilodaltons (kD). (C and D) Elution profiles (top) and Coomassie Blue-stained SDS-PAGE gels (bottom) of purified recombinant human proteins after size exclusion chromatography on a Superdex 200 Increase 10/300 GL column. The elution profile and gel for GST::DLIC1[388-523] are shown twice in C, and the elution profile and gel for GST::KIF5C[807-956] are shown twice in D. Molecular weight is indicated in kilodaltons (kD). WT denotes wild type. (E) Left: Coomassie Blue-stained SDS-PAGE gel of purified recombinant protein mixtures prior to the addition of amylose resin (Input). Right: Coomassie Blue-stained SDS-PAGE gel of proteins eluted from amylose resin after MBP pull-down. The actual amount of DLIC1[388-523] in the pull-down reaction was fivefold higher than what is shown for the input. The KIF5C fragment was used at two concentrations that differ threefold, as indicated above the 5th and 6th lanes from the left. (F) Coomassie Blue-stained SDS-PAGE gel (top) and corresponding immunoblot (bottom) of proteins eluted from amylose resin after MBP pull-down as in E. All proteins contain a 6xHis tag (see Materials and methods) that is detected on the immunoblot. Proteins are the same as in E, but amounts in the pull-down mixture were decreased relative to those in E such that DLIC1-C helix 1 peptide could be added in 150-fold molar excess over the KIF5C fragment. Source data are available for this figure: SourceData F3.
Figure S1.
Figure S1.
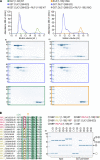
The V59Q and P56F mutations in RILP reduce the affinity for dynein light intermediate chain. (A) Elution profiles (top) and Coomassie Blue-stained SDS-PAGE gels (bottom) of purified recombinant proteins after size exclusion chromatography on a Superdex 200 Increase 10/300 GL column. Proteins correspond to the human homologs. The elution profile and gel for GST::DLIC1[388-523] are shown twice, and the elution profile and gel for RILP[1-106] WT are the same as in Fig. 1 D. WT denotes wild type. Molecular weight is indicated in kilodaltons (kD). (B) Left: Sequence alignment of the α3N helix for RILP family proteins in selected vertebrates and invertebrates. Boxed residues denote the phenylalanine in RILPL2 that is critical for myosin Va binding and the proline that typically replaces the phenylalanine in RILP and RILPL1. Arrowhead points to the valine residue that forms part of the RH1 domain’s hydrophobic pocket and is mutated in A. Right: Coomassie Blue-stained SDS-PAGE gel of purified recombinant protein mixtures prior to the addition of glutathione agarose resin (Input) and after elution from the resin (GST pull-down). Proteins correspond to the human homologs. Molecular weight is indicated in kilodaltons (kD). Source data are available for this figure: SourceData FS1.
Figure S2.
Figure S2.
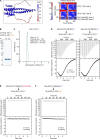
The V55Q mutation in JIP4 abrogates the binding to dynein light intermediate chain. (A) Per-residue confidence score (pLDDT; blue: high confidence, red: low confidence) of the human JIP3[1-100] dimer bound to two copies of human DLIC1[440-455] (left) and corresponding Predicted Alignment Error (PAE) plot (right). (B) Coomassie Blue-stained SDS-PAGE gel of purified recombinant human proteins used in AUC and ITC experiments. WT denotes wild type. Molecular weight is indicated in kilodaltons (kD). (C) Sedimentation velocity AUC profile with theoretical (MWcalculated) and experimentally measured molecular mass (MWobserved). The MWobserved value indicates that JIP4 is dimeric in solution. (D–F) Thermograms and binding isotherms of representative ITC titrations. JIP4[1-103] concentration is the concentration of the dimer. The data in D were best described by a model corresponding to two sites with a single macroscopic dissociation constant (KD) using the SEDPHAT software package. The KD value was determined by global fitting of the two independent experiments shown in D with a 68% confidence interval of 2.8–7.4 µM. Source data are available for this figure: SourceData FS2.
Figure S3.
Figure S3.
Human JIP3 V60Q is equivalent to C. elegans UNC-16 V72Q. (A and B) Left: Coomassie Blue-stained SDS-PAGE gel of purified recombinant protein mixtures prior to the addition of glutathione agarose resin (Input). Right: Coomassie Blue-stained SDS-PAGE gel of proteins eluted from glutathione agarose resin after GST pull-down. Proteins correspond to the C. elegans homologs of JIP3 (UNC-16; UniProt entry P34609-1), kinesin heavy chain KIF5C (UNC-116; P34540), and dynein light intermediate chain (DLI-1; G5ED34). WT denotes wild-type. Molecular weight is indicated in kilodaltons (kD). MBP::UNC-16[1-120] proteins (WT and V72Q) also contain a C-terminal Strep-tag II, which is detected on the immunoblot in A along with GST::DLI-1[369-442]. Source data are available for this figure: SourceData FS3.
Figure 4.
Figure 4.
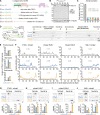
Displacing dynein light intermediate chain from C. elegans UNC-16/JIP3 through the UNC-16 V72Q mutation results in accumulation of endo-lysosomal organelles at the neurite tip of touch receptor neurons. (A) Top: Domain organization of the C. elegans UNC-16/JIP3 N-terminal region. Residue numbers correspond to isoform e (UniProt entry P34609-1). Bottom: Description of unc-16 mutants affecting the UNC-16 N-terminal region that are characterized in this study. (B) Immunoblot of adult C. elegans lysates using an affinity-purified rabbit polyclonal antibody raised against UNC-16 residues 1–506. The membrane was reprobed with an anti-α-tubulin antibody as a loading control. Molecular weight is in kilodaltons (kD). (C) Locomotion of animals at the young adult stage, assessed by determining body bending frequency (mean ± SEM) in liquid medium. n denotes the number of animals examined. Statistical significance (wild-type N2 control versus unc-16 mutants) was determined by ANOVA on ranks (Kruskal-Wallis nonparametric test) followed by Dunn’s multiple comparison test. ****P < 0.0001. (D) Left: Location of the C. elegans anterior touch receptor neurons. ALM and AVM are the anterior lateral and anterior ventral mechanosensory neurons, respectively, which extend processes into the nose and the nerve ring. There are two ALM neurons, which are equivalent for the purpose of this study. Note that the neurite tip does not contain synapses, which are instead located in the nerve ring and were not imaged in this study. Right: Fluorescence images (maximum intensity z-stack projection, inverted grayscale) of the ALM neuron in L4 animals expressing a transgene-encoded marker for lysosomes (CTNS-1::mKate2) or early endosomes (mKate2::RAB-5) in touch receptor neurons. Scale bar, 20 µm. (E) Number of CTNS-1::mKate2 puncta (mean ± SEM) in the first quarter of ALM neurite length after the cell body (proximal neurite), the middle two quarters (mid-neurite), and the last quarter (distal neurite). n denotes the number of neurites examined (1 per animal). Statistical significance (control versus unc-16 mutants) was determined as described for C. ****P < 0.0001. (F) Fluorescence intensity profiles (mean ± SEM) along the ALM neurite in L4 animals expressing mKate2-tagged markers for endo-lysosomal organelles or synaptic vesicle precursors. n denotes the number of neurites examined (1 per animal). (G–J) Top: Fluorescence images (maximum intensity z-stack projection, inverted grayscale) of the ALM cell body and neurite tip. Scale bars, 2 µm. Bottom: Integrated fluorescence intensity (mean ± SEM, normalized to control) in the ALM cell body and the last 20 µm of the distal neurite (neurite tip). n denotes the number of neurites examined (1 per animal). Statistical significance was determined as described for C. ****P < 0.0001; ***P < 0.001; **P < 0.01; *P < 0.05; ns = not significant, P > 0.05. Source data are available for this figure: SourceData F4.
Figure S4.
Figure S4.
Mutant UNC-16 levels are comparable to WT; late endosomes but not synaptic vesicle precursors are distributed differently in unc-16(ce483) versus unc-16(V72Q); unc-16(ce483) is a null mutant. (A) Fluorescent immunoblot of adult C. elegans lysates with an antibody against UNC-16 (left) and corresponding quantification of the UNC-16 signal in unc-16 mutants (right). Individual measurements and the average (horizontal bar) of three immunoblots are shown. α-tubulin was used as the loading control. Molecular weight is in kilodaltons (kD). (B) Fluorescence images (maximum intensity z-stack projection, inverted grayscale) of the ALM neuron in L4 animals expressing a transgene-encoded marker for late endosomes (mKate2::RAB-7) or synaptic vesicle precursors (SNB-1::mKate2) in touch receptor neurons. Scale bar, 20 µm. (C) Left: Fluorescence intensity profiles (mean ± SEM) along the ALM neurite in L4 animals expressing a transgene-encoded marker for early endosomes (mKate2::RAB-5). Right: Integrated fluorescence intensity (mean ± SEM, normalized to control) in the ALM cell body and the last 20 µm of the distal neurite (neurite tip). n denotes the number of neurites examined. Statistical significance was determined by ANOVA on ranks (Kruskal-Wallis nonparametric test) followed by Dunn’s multiple comparison test. ****P < 0.0001; ns = not significant, P > 0.05. Source data are available for this figure: SourceData FS4.
Figure S5.
Figure S5.
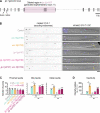
Recycling endosomes accumulate at the ALM neurite tip in the unc-16(V72Q) mutant and do so independently of JIP-1. (A) Genomic locus of jip-1 and deletion in the jip-1(prt187) mutant introduced by genome editing. (B) Fluorescence images (maximum intensity z-stack projection, inverted grayscale) of the ALM neuron in L4 animals expressing a transgene-encoded marker for recycling endosomes (mKate2::SYX-7) in touch receptor neurons. Merged image on the right shows the location of the fluorescence signal relative to the differential interference contrast (DIC) image of the animal. Arrow points to the signal at the neurite tip. Note that diffuse signal in the neurite and the cell body is not readily discernable with this marker, which precludes determination of the fluorescence intensity profile along the neurite and intensity measurements in the cell body. Scale bar, 20 µm. (C) Number of mKate2::SYX-7 puncta (mean ± SEM) in the first quarter of ALM neurite length after the cell body (proximal neurite), the middle two quarters (mid-neurite), and the last quarter (distal neurite). n denotes the number of neurites examined (1 per animal). Statistical significance (control versus mutants; other comparisons indicated by brackets) was determined by ANOVA on ranks (Kruskal-Wallis nonparametric test) followed by Dunn’s multiple comparison test. ****P < 0.0001; ***P < 0.001; **P < 0.01; *P < 0.05; ns = not significant, P > 0.05. (D) Integrated fluorescence intensity (mean ± SEM, normalized to control) in the distal tip of the ALM neurite. The number of neurites examined (1 per animal) corresponds to the number n in C. Statistical significance was determined as described for C. ****P < 0.0001; **P < 0.01; ns = not significant, P > 0.05.
Figure 5.
Figure 5.
Mutations in the C-terminal helix 1 of dynein light intermediate chain and the UNC-16/JIP3 V72Q mutation result in similar transport defects in touch receptor neurons. (A and (B) Fluorescence intensity profiles (mean ± SEM) along the ALM neurite in L4 animals expressing a transgene-encoded marker for early endosomes (mKate2::RAB-5) or lysosomes (CTNS-1::mKate2). n denotes the number of neurites examined (1 per animal). Graph in A corresponds to the data in Fig. 4 F, re-plotted with a split y-axis to highlight the difference between unc-16(ce483) and the control. (C) Integrated fluorescence intensity (mean ± SEM, normalized to control) in the ALM cell body and the last 20 µm of the distal neurite (neurite tip). n denotes the number of neurites examined (1 per animal). Statistical significance [control versus mutants and unc-16(V72Q) versus dli-1(F392A/F393A)] was determined by ANOVA on ranks (Kruskal-Wallis nonparametric test) followed by Dunn’s multiple comparison test. ****P < 0.0001; ***P < 0.001; ns = not significant, P > 0.05. (D) Fluorescence images (maximum intensity z-stack projection, inverted grayscale) of the ALM cell body and neurite tip in L4 animals expressing transgene-encoded UNC-16::GFP [background: endogenous wild-type unc-16 with or without dli-1(F392A/F393A)] or UNC-16(V72Q)::GFP [background: endogenous unc-16(V72Q)] in touch receptor neurons. Scale bar, 2 µm. (E) Integrated fluorescence intensity in the ALM cell body and neurite tip for the GFP-tagged UNC-16 versions described in D, plotted and statistically analyzed as in C. ****P < 0.0001; ns = not significant, P > 0.05. (F) Fluorescence intensity profiles (mean ± SEM) at the ALM neurite tip for the GFP-tagged UNC-16 versions described in D. n denotes the number of neurites examined (1 per animal). (G) Fluorescence kymographs (inverted grayscale) of mKate2::RAB-5 particle motility in the ALM neurite, generated from time-lapse sequences (single z-section) recorded at the larval L2 stage. The imaged region is ∼50 µm away from the cell body, which is located to the left. Scale bar, 5 µm. (H–J) Motility parameters (mean ± SEM) of mKate2::RAB-5 particles, derived from kymograph analysis. For H, n denotes the number of neurites examined (1 per animal). For I and J, n denotes the number of track segments, framed by a pause or a reversal, from at least 15 neurites (1 per animal). Statistical significance was determined as described for C. ****P < 0.0001; ***P < 0.001; **P < 0.01; *P < 0.05; ns = not significant, P > 0.05.
Figure 6.
Figure 6.
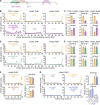
Neurite tip accumulation of endo-lysosomal organelles in the unc-16(V72Q) mutant requires kinesin-1 activity but not MAP kinase signalling, and N-terminal UNC-16 deletions mimic the unc-16(V72Q) mutant. (A) Domain organization of the N-terminal UNC-16 region with the putative binding sites for UNC-116/KHC and JNK-1 delineated by dashed lines. (B and D) Fluorescence intensity profiles (mean ± SEM) along the ALM neurite in L4 animals expressing a transgene-encoded marker for lysosomes (CTNS-1::mKate2), late endosomes (mKate2::RAB-7), or early endosomes (mKate2::RAB-5) in touch receptor neurons. n denotes the number of neurites examined (1 per animal). (C and E) Integrated fluorescence intensity [mean ± SEM, normalized to unc-16(V72Q)] in the ALM cell body and the last 20 µm of the distal neurite (neurite tip). The number of neurites examined in C and E corresponds to the number n in B and D, respectively. Statistical significance was determined by the Mann-Whitney test. ****P < 0.0001; **P < 0.01; *P < 0.05; ns = not significant, P > 0.05. (F and G) Left: Fluorescence intensity profiles (mean ± SEM) in the ALM neurite, as described for B and D. Right: Integrated fluorescence intensity (mean ± SEM, normalized to unc-16(V72Q) for F and to the control for G) in the cell body and at the neurite tip. The number of neurites examined corresponds to the number n in the fluorescence intensity profiles on the left. Statistical significance (control versus mutants and unc-16(V72Q) versus unc-16(V72Q); jnk-1(gk7)) was determined by the Mann-Whitney test for F and by ANOVA on ranks (Kruskal-Wallis nonparametric test) followed by Dunn’s multiple comparison test for G. ****P < 0.0001; *P < 0.05; ns = not significant, P > 0.05.
Figure 7.
Figure 7.
Neurite tip accumulation of endo-lysosomal organelles in the unc-16(V72Q) mutant requires the interaction between UNC-16/JIP3 and kinesin light chain. (A) Domain organization of human JIP3 with sequence alignment of the kinesin light chain binding site in the JIP3 leucine zipper (LZ) domain. Arrowhead points to the leucine residue in JIP3 (L444 in human; L439 in mouse; L393 in C. elegans) whose mutation to proline causes neurological disease and was predicted to interfere with kinesin light chain binding (Platzer et al., 2019). (B) Left: Coomassie Blue-stained SDS-PAGE gel of purified recombinant protein mixtures prior to the addition of glutathione agarose resin (Input). Right: Coomassie Blue-stained SDS-PAGE gel of proteins eluted from glutathione agarose resin after GST pull-down. Proteins correspond to human kinesin light chain 1 (UniProt entry Q07866-1) and mouse JIP3 (Q9ESN9-5). Molecular weight is indicated in kilodaltons (kD). (C) Immunoblot of C. elegans adult lysates using antibodies against UNC-16 and α-tubulin (loading control). Molecular weight is indicated in kilodaltons (kD). (D) Locomotion of animals at the young adult stage, assessed by determining body bending frequency (mean ± SEM) in liquid medium. n denotes the number of animals examined. Statistical significance [wild-type N2 control versus unc-16 mutants and unc-16(prt183) versus unc-16(L393P)] was determined by ANOVA on ranks (Kruskal-Wallis nonparametric test) followed by Dunn’s multiple comparison test. ****P < 0.0001; ***P < 0.001. (E) Fluorescence images (maximum intensity z-stack projection, inverted grayscale) of the ALM neuron in L4 animals expressing a transgene-encoded marker for lysosomes (CTNS-1::mKate2) or early endosomes (mKate2::RAB-5) in touch receptor neurons. Scale bar, 20 µm. (F) Fluorescence intensity profiles (mean ± SEM) along the ALM neurite in the animals described in E. n denotes the number of neurites examined (1 per animal). (G) Number of CTNS-1::mKate2 puncta (mean ± SEM) in the first quarter of ALM neurite length after the cell body (proximal neurite), the middle two quarters (mid-neurite), and the last quarter (distal neurite). The number of neurites examined (1 per animal) corresponds to the number n in F. Statistical significance (control versus unc-16 mutants; other comparisons indicated by brackets) was determined by ANOVA on ranks (Kruskal-Wallis nonparametric test) followed by Dunn’s multiple comparison test. ****P < 0.0001; ns = not significant, P > 0.05. (H) Integrated fluorescence intensity (mean ± SEM, normalized to unc-16(prt183)) in the ALM cell body and the last 20 µm of the distal neurite (neurite tip). The number of neurites examined corresponds to the number n in F. Statistical significance (control versus unc-16 mutants; other comparisons indicated by brackets) was determined as described for G. ****P < 0.0001; ***P < 0.001; **P < 0.01; ns = not significant, P > 0.05. Source data are available for this figure: SourceData F7.

References

    1. Abe, N., Almenar-Queralt A., Lillo C., Shen Z., Lozach J., Briggs S.P., Williams D.S., Goldstein L.S.B., and Cavalli V.. 2009. Sunday driver interacts with two distinct classes of axonal organelles. J. Biol. Chem. 284:34628–34639. 10.1074/jbc.M109.035022 - DOI - PMC - PubMed
    1. Arimoto, M., Koushika S.P., Choudhary B.C., Li C., Matsumoto K., and Hisamoto N.. 2011. The Caenorhabditis elegans JIP3 protein UNC-16 functions as an adaptor to link kinesin-1 with cytoplasmic dynein. J. Neurosci. 31:2216–2224. 10.1523/JNEUROSCI.2653-10.2011 - DOI - PMC - PubMed
    1. Arribere, J.A., Bell R.T., Fu B.X.H., Artiles K.L., Hartman P.S., and Fire A.Z.. 2014. Efficient marker-free recovery of custom genetic modifications with CRISPR/Cas9 in Caenorhabditis elegans. Genetics. 198:837–846. 10.1534/genetics.114.169730 - DOI - PMC - PubMed
    1. Becker, E.B.E., and Bonni A.. 2006. Pin1 mediates neural-specific activation of the mitochondrial apoptotic machinery. Neuron. 49:655–662. 10.1016/j.neuron.2006.01.034 - DOI - PubMed
    1. Bowman, A.B., Kamal A., Ritchings B.W., Philp A.V., McGrail M., Gindhart J.G., and Goldstein L.S.. 2000. Kinesin-dependent axonal transport is mediated by the sunday driver (SYD) protein. Cell. 103:583–594. 10.1016/s0092-8674(00)00162-8 - DOI - PubMed

Publication types

MeSH terms