. 2022 Oct;158(4):345-368.
doi: 10.1007/s00418-022-02129-6. Epub 2022 Jul 12.

The changing landscape of immune cells in the fetal mouse testis

Affiliations

The changing landscape of immune cells in the fetal mouse testis

Samira Hosseini et al. Histochem Cell Biol. 2022 Oct.

Abstract

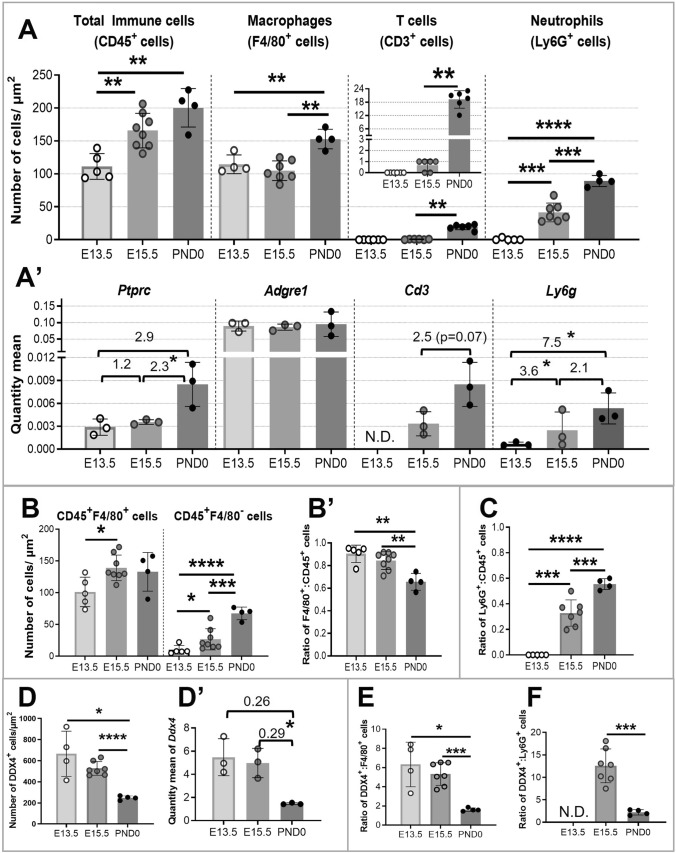
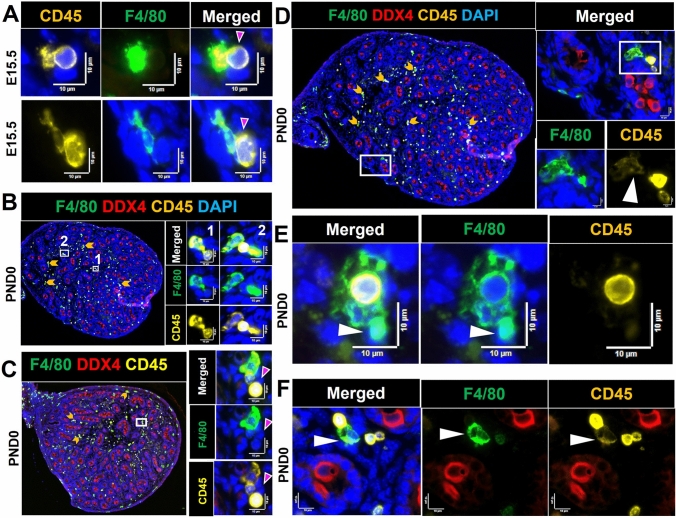
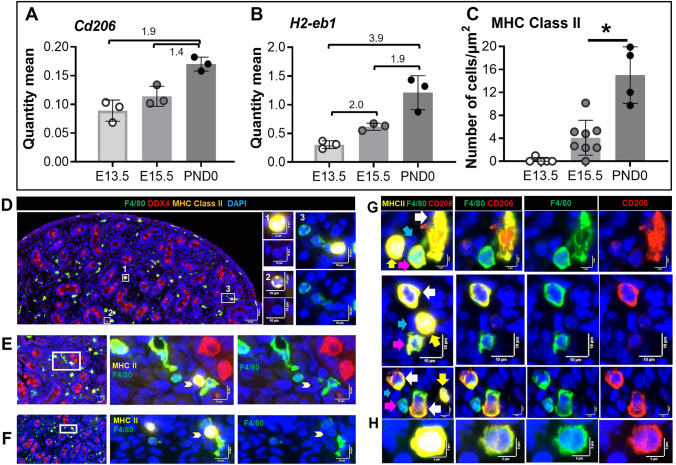
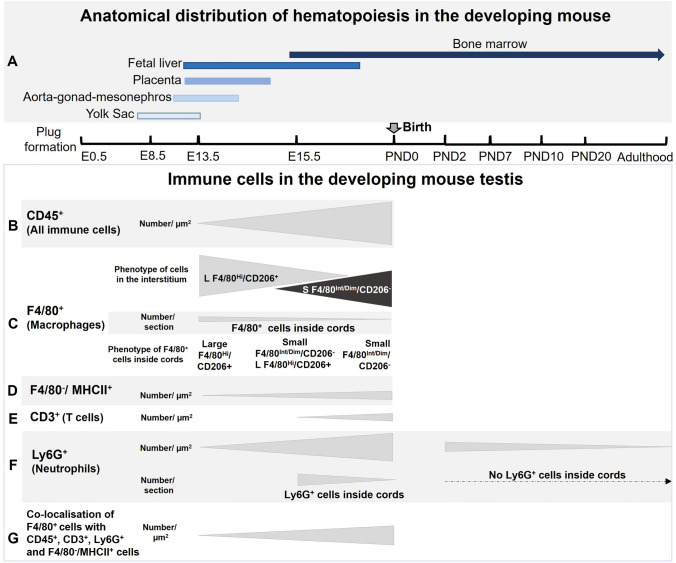
Fetal testis growth involves cell influx and extensive remodeling. Immediately after sex determination in mouse, macrophages enable normal cord formation and removal of inappropriately positioned cells. This study provides new information about macrophages and other immune cells after cord formation in fetal testes, including their density, distribution, and close cellular contacts. C57BL6J mouse testes from embryonic day (E) 13.5 to birth (post-natal day 0; PND0), were examined using immunofluorescence, immunohistochemistry, and RT-qPCR to identify macrophages (F4/80, CD206, MHCII), T cells (CD3), granulocytes/neutrophils (Ly6G), and germ cells (DDX4). F4/80+ cells were the most abundant, comprising 90% of CD45+ cells at E13.5 and declining to 65% at PND0. Changes in size, shape, and markers (CD206 and MHCII) documented during this interval align with the understanding that F4/80+ cells have different origins during embryonic life. CD3+ cells and F4/80-/MHCII+ were absent to rare until PND0. Ly6G+ cells were scarce at E13.5 but increased robustly by PND0 to represent half of the CD45+ cells. These immunofluorescence data were in accord with transcript analysis, which showed that immune marker mRNAs increased with testis age. F4/80+ and Ly6G+ cells were frequently inside cords adjacent to germ cells at E13.5 and E15.5. F4/80+ cells were often in clusters next to other immune cells. Macrophages inside cords at E13.5 and E15.5 (F4/80Hi/CD206+) were different from macrophages at PND0 (F4/80Dim/CD206-), indicating that they have distinct origins. This histological quantification coupled with transcript information identifies new cellular interactions for immune cells in fetal testis morphogenesis, and highlights new avenues for studies of their functional significance.

Keywords: Fetal testis development; Granulocytes; Immune cell localisation; Macrophages; Male germ cells; T cells.


Conflict of interest statement

The authors declare no competing interests.

The authors declare that the research was conducted in the absence of any commercial or financial relationships that could be construed as a potential conflict of interest.

Figures

Fig. 1
Fig. 1
Quantitative changes in immune cell populations in fetal testes, E13.5 to PND0. A The density of immune cells (CD45+ cells), macrophages (F4/80+ cells), T cells (CD3+ cells), and neutrophils (Ly6G+ cells) in E13.5, E15.5, and PND0 testes determined by counting all cells in sections labeled using immunofluorescence. A′ RT-qPCR results reported as quantity mean of transcripts encoding corresponding immune cell markers normalized to RPLP0, with fold-change values between age groups indicated. N.D. Not detected. B The density of CD45+/F4/80+ (macrophages) and CD45+/F4/80 cells (non-macrophages). B′ The ratio of F4/80+:CD45+ cells. C The ratio of Ly6G+:CD45+ cells. D The density of germ cells (DDX4+ cells) from E13.5 to PND 0. D′ qRT-PCR quantity mean of transcripts encoding germ cell marker Ddx4 normalized to Rplp0, with fold-change values between age groups indicated. E The ratio of DDX4+ to F4/80+. F The ratio of DDX4+ to Ly6G+ cells (neutrophils). Circles show results from individual animals; values represent mean ± SD. Significance determined using 2-tailed unpaired t test. *p ≤ 0.05 , **p ≤ 0.01 , ***p ≤ 0.001 , ****p ≤ 0.0001
Fig. 2
Fig. 2
Immune cells attached to the outer layer of the testis capsule and amongst the mesothelial cells of the coelomic epithelium (in the perimeter region), visualized by immunofluorescence. Lower magnification images on left, with white boxes indicating regions shown in high magnification on right hand panels; dimensions as indicated. A Whole E13.5 testis Sect. (1) F4/80+ cell attached to testis capsule outer layer. (2) CD45+/F4/80 cell amongst mesothelial cells. (3) F4/80+ cell inside the capsule, amongst mesothelial cells. B F4/80+ cell embedded in the capsule lamina (white arrow). C F4/80+ cells attached to the capsule outer layer (white arrows) and in the perimeter (orange arrow). D and D′ CD45+/F4/80 cells attached to the outer layer of capsule (white arrows). E In PND0 testis section, F4/80+ cell attached to the capsule outer layer. F At PND0, F4/80+ cells attached to the outer capsule layer (white arrow), amongst mesothelial cells (yellow arrow), and in perimeter area (orange arrow). F4/80 pan-macrophage marker, CD45 pan-immune cell marker, DDX4 pan-germ cell marker, laminin extracellular matrix, DAPI nuclei. Marker colors are indicated above each panel set
Fig. 3
Fig. 3
Contacts and co-localization of macrophages (CD45+/F4/80+) with immune (CD45+/F4/80) and other cells (CD45) in fetal and newborn mouse testes. A E15.5 testis. Contact between CD45+/F4/80+ and CD45+/F4/80 cells. Upper panels CD45+/F4/80 cell (pink arrow) contacting CD45+/F4/80+ cells. B–F PND0 testis. B (1) Co-localization of a CD45+/F4/80+ and CD45+/F4/80 cell; (2) two CD45+/F4/80+ cells flanking a CD45+/F4/80 cell. C A polymorphonuclear (PMN) CD45+ cell flanked by a CD45+/F4/80+ and a CD45+/F4/80 cell within a cluster of CD45 cells (e.g., pink arrow). D Co-localisation of a CD45+/F4/80+, a CD45+/F4/80 and a PMN; white arrow indicates the dim level of CD45 on CD45+/F4/80+ cell. E A CD45+/F4/80 cell engulfed by a CD45+/F4/80+ cell; white arrow indicates the very dim CD45+ signal on a CD45+/F4/80+. F Contact between a CD45+/F4/80 cell with a CD45DimF4/80+ cell (white arrow). White boxes in low-magnification images on the left in BD correspond to high-magnification panels on the right. Marker colors are indicated above each panel set
Fig. 4
Fig. 4
Proximity of macrophages (F4/80+) with germ cells (DDX4+) and cord basement membrane (laminin) in the E13.5 testis. A The number of F4/80+ cells inside cords per section, from E13.5 to PND0. Each point represents the average of 3 sections per biological sample. Asterisk indicates p ≤ 0.05. B1 Germ cell engulfed by a macrophage on the side of the testis adjacent to the mesonephros (white arrow). B2B4 Macrophages inside cords. B5 Macrophage in close contact with cord basement membrane. White boxes in high-magnification panels refer to low-magnification images to the right or below). Dotted white line in B1 denotes border between testis and mesonephros. Marker colors indicated above for each panel set
Fig. 5
Fig. 5
Proximity of macrophages (F4/80+) to germ cells (DDX4+) and cord basement membrane (laminin) in E15.5 and PND0 testes. A1 Germ cell in close contact with a macrophage, on the side of the testis adjacent to the mesonephros (white arrow). A2A3 Macrophages inside cords. A4 A macrophage positioned in the middle of the cord basement membrane (white arrow). B Co-localisation of a macrophage with germ cells in cord center (white arrow). White boxes in high-magnification panels refer to adjacent low-magnification images (A1A3). Dotted white line in A1 and B denotes testis–rete cord testis border. Marker colors are indicated above each panel set
Fig. 6
Fig. 6
Features of F4/80Hi/CD206+ and F4/80Int/Dim/CD206 cells in the E13.5 to PND0 mouse testis. A F4/80Hi cells in close contact with germ cells inside cords were CD206+ at E13.5 (white arrows). B Small F4/80Int cells in close contact with germ cells inside cords were CD206 at E15.5 (pink arrows). C and D Small F4/80Int/CD206 inside cords vs. large F4/80Hi/CD206+ cells outside cords at PND0. E and F A small F4/80Int/CD206 cell in the interestituim (pink arrows) and two large F4/80Hi/CD206+ cell in the cord perimeter area (white arrows). G A cluster of F4/80Hi/CD206+ cells (white arrow) and small F4/80DimCD206 cells (pink arrows). H Contact between two large F4/80Hi/CD206+ cells with small, rounded F4/80Int/CD206 cells (pink arrows). I Co-localisation a small F4/80Int/CD206 and a large F4/80Hi/CD206+ cell. Marker colors are indicated above each panel set. White boxes on low-magnification images refer to the high-magnification panels
Fig. 7
Fig. 7
Features of MHC Class II+ cells in the newborn (PND0) mouse testis. A Cd206 transcript levels. B H2-eb1 (encoding MHC class II) transcript levels. RT-qPCR results reported as quantity mean of transcripts normalized to RPLP0; fold-change values between age groups indicated. C The density of F4/80/MHCII+ cells at each age, from E13.5 to PND0 testis cross-sections. D Large (≥ 10 µm) (1) or small (≤ 10 µm) F4/80/MHCII+ cells (2, 3). E, F Contacts between small F4/80/MHCII+ and F4/80+/MHCII cells. G Three examples of clusters of large F4/80Hi/CD206+ cells (white arrows), small F4/80Int/CD206 cells (pink arrows) and small F4/80/MHCII+ cells (yellow arrows). Additional, unidentified cells present in clusters are indicated (blue arrows). H A rare, single F4/80+/CD206+/MHCII+ cell. In DF White boxes on low-magnification images refer to the high-magnification panels. Marker colors are indicated above each panel set
Fig. 8
Fig. 8
Location and cell–cell interactions of CD3+ cells (T cells) in the PND0 mouse testis. A Testicular T cells at PND0 indicated by arrowheads. B T cells appearing to be dividing. C Co-localisation of macrophage (F4/80+) and CD3+ cells (arrowheads). White boxes on low-magnification images refer to the high-magnification panels on the right. D A macrophage surrounding two CD3+ cells in close contact with the basement membrane (laminin+). Marker colors are indicated above each panel set.
Fig. 9
Fig. 9
Localization and cell contacts of Ly6G+ cells (neutrophils) in fetal and newborn mouse testes. A Ly6G+ cells in the interstitium at PND0. B Ly6G+ cells at cord perimeter areas at E15.5. C Ly6G+ cells inside cords at PND0 (dark arrowheads). D Several Ly6G+ cells in close proximity are present in the interstitium, near the cord perimeter and inside cords (white arrows) at PND0. E Co-localisation of Ly6G+ cells and DDX4+ cells inside cords (white arrows) at PND0. Marker colors are indicated above each panel set. Black and white boxes on low-magnification images refer to the high-magnification panels
Fig. 10
Fig. 10
Interactions of Ly6G+ cells (neutrophils) with other cells in the newborn mouse testis (PND0). A Two Ly6G+ cells in the cord perimeter area displaying a dim F4/80 signal (white arrows). B A neutrophil in contact with two macrophages: one semi-rounded macrophage in the cord perimeter area (orange arrows) and another in the interstitial area (white arrows), and a grouping of Ly6G+ and F4/80+Ly6G cells (yellow arrow). C Co-localisation of a neutrophil (white arrow) with several CD45+ cells. D Co-localisation of two Ly6G+ cells with CD45+ cells at cord perimeter (orange arrows). Co-localisation of a CD45+/Ly6G+ and a CD45+/Ly6G cell in the interstitium (white arrows). E A Ly6G+ (white arrow) and a F4/80+Ly6G (macrophage; yellow arrow) attached to each other. F Two Ly6G+ cells displaying different F4/80 levels. White boxes on lower-magnification images refer to the high-magnification panels on the right. Marker colors are indicated above each panel set or directly on figures
Fig. 11
Fig. 11
Ly6G+ cells (neutrophils) in mouse testis sections from birth to adulthood. Higher-magnification images in black boxes show Ly6G+ cells inside cords at PND0. Red circles with black arrows indicate all neutrophils detected in each section, except for the PND0 sample which had more than 50 labeled cells. The minimum and maximum number of Ly6G+ cells in the central section of each of 3 testes per age testis shown in parentheses. After day 10, Ly6G+ cells were rare to absent
Fig. 12
Fig. 12
Anatomical distribution of hematopoiesis in the developing mouse and summary of study outcomes. A Primitive hematopoiesis starts at E7.5 in the yolk sac. At approximately E9.5, the aorta-gonad-mesonephros region accommodates hematopoiesis, followed by hematopoiesis in placenta and fetal liver at E11.5. The bone marrow is the predominant hematopoietic tissue from about E14.5 and throughout adulthood (Mikkola and Orkin, ; Hoeffel and Ginhoux, ; Mevel et al., 2019). B CD45+ cell density increased from E13.5 to PND0. C The phenotype of F4/80+ cells in the E13.5 testis interstitium was large and F/80Hi/CD206+, while, from E15.5, a small F/80Int/Dim/CD206 population was detected. F4/80+ cells inside cords at E13.5 were exclusively large and F/80Hi/CD206+. Macrophages inside cords were large F/80Hi/CD206+ and small F/80Int/Dim/CD206 at E15.5, and small F/80Int/Dim/CD206 at PND0. D F/80/MHC class II+ cells increased from rare/single at E13.5 to PND0. E CD3+ cells were not detected at E13.5. Single CD3+ cells were observed at E15.5, with scattered CD3+cells present at PND0. F Ly6G+ cells were rare at E13.5, while, by PND0, they represented half of the testicular immune cell population. A lower number of Ly6G+ were observed at PND7, but they were rare to absent after PND10 and in the adult testis. G F4/80+ cells in clusters with CD45+, CD3+, Ly6G+, F4/80/MHCII+ cells were noted with increasing frequency from E13.5 to PND0

Similar articles

Cited by

References

    1. Adams IR, McLaren A. Sexually dimorphic development of mouse primordial germ cells: switching from oogenesis to spermatogenesis. Development. 2002 doi: 10.1242/dev.129.5.1155. - DOI - PubMed
    1. Akhtar M, al-Dayel F, Siegrist K, Ezzat A, Neutrophil-rich Ki-1-positive anaplastic large cell lymphoma presenting as a testicular mass. Mod Pathol. 1996;9(8):812–815. - PubMed
    1. Arena S, Peri FM, Nascimben F, Romeo C. Colchicine and neutrophils in testicular ischemia/reperfusion injury. Urol J. 2020;17(5):531–533. doi: 10.22037/uj.v16i7.6380. - DOI - PubMed
    1. Bhushan S, Theas MS, Guazzone VA, Jacobo P, Wang M, Fijak M, et al. Immune cell subtypes and their function in the testis. Front Immunol. 2020;30(11):583304. doi: 10.3389/fimmu.2020.583304. - DOI - PMC - PubMed
    1. Bolat D, Aydoğdu Ö, Polat S, Yarımoğlu S, Bozkurt İH, Yonguç T. Predictive value of preoperative neutrophil-to-lymphocyte ratio on the prognosis of germ cell testicular tumors. Turk J Urol. 2017;43(1):55–61. doi: 10.5152/tud.2016.38924. - DOI - PMC - PubMed