. 2022 Aug 1;128(2):378-394.
doi: 10.1152/jn.00475.2021. Epub 2022 Jul 13.

Contribution of individual features to repetition suppression in macaque inferotemporal cortex

Affiliations

Contribution of individual features to repetition suppression in macaque inferotemporal cortex

Nathaniel P Williams et al. J Neurophysiol. .

Abstract

When an image is presented twice in succession, neurons in area TE of macaque inferotemporal cortex exhibit repetition suppression, responding less strongly to the second presentation than to the first. Suppression is known to occur if the adapter and the test image are subtly different from each other. However, it is not known whether cross suppression occurs between images that are radically different from each other but that share a subset of features. To explore this issue, we measured repetition suppression using colored shapes. On interleaved trials, the test image might be identical to the adapter, might share its shape or color alone, or might differ from it totally. At the level of the neuronal population as a whole, suppression was especially deep when adapter and test were identical, intermediate when they shared only one attribute, and minimal when they shared neither attribute. At the level of the individual neuron, the degree of suppression depended not only on the properties of the two images but also on the preferences of the neuron. Suppression was deeper when the repeated color or shape was preferred by the neuron than when it was not. This effect might arise from feature-specific adaptation or alternatively from adapter-induced fatigue. Both mechanisms conform to the principle that the degree of suppression is determined by the preferences of the neuron.NEW & NOTEWORTHY When an image is presented twice in rapid succession, neurons of inferotemporal cortex exhibit repetition suppression, responding less strongly to the second than to the first presentation. It has been unclear whether this phenomenon depends on the selectivity of the neuron under study. Here, we show that, for a given neuron, suppression is deepest when features preferred by that neuron are repeated. The results argue for a mechanism based either on feature-specific suppression or fatigue.

Keywords: inferotemporal cortex; macaque; repetition suppression; rhesus macaque; visual cortex.


Conflict of interest statement

No conflicts of interest, financial or otherwise, are declared by the authors.

Figures
None
Graphical abstract
Figure 1.
Figure 1.
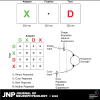
Experimental design. A: on each trial, a pair of colored shapes was presented in sequence. B: for testing each neuron, we used two tetrads of images, each produced by crossing two shapes with two colors. C: on interleaved trials, images from a given tetrad were presented in all 16 possible sequences. The test image might match the adapter in shape (“S”), color (“C”), neither (“N”) or both (“B”). D: in modeling repetition suppression, we assume that response strength depends on modulation of shape and color inputs contingent on the repetition of shape and color. Suppression may be same-feature-based (solid modulatory pathways) or cross-feature-based (dashed modulatory pathways). In image-based suppression, the two effects occur with equal strength. The diagram represents the formal features of suppression without reference to the nature of the underlying neural mechanisms.
Figure 2.
Figure 2.
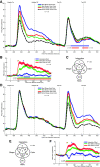
Responses to the adapter and the test were selective for shape and color and moderately selective for their conjunction. A and D: mean population firing rate as a function of time during trials sorted according to whether the adapter (A) or the test (D) contained the best or worst shape and the best or worst color for the neuron in question (means in 5 ms bins smoothed with a 10 ms standard deviation Gaussian kernel). Although the main purpose of this plot is to demonstrate neuronal selectivity for the shape and color of the adapter, we also note that the strength of the response to the test image was inversely related to the strength of the response to the adapter. The underlying red and blue horizontal bars indicate periods during which the red and blue curves deviated significantly from the black dashed curve. The P value juxtaposed to each bar indicates the statistical significance of the corresponding cluster. We consider possible explanations for this effect in the text. B and F: strength of the shape-selective signal (green), color-selective signal (red), and interaction signal (blue) as a function of time following adapter (B) or test (F) onset. Ribbons represent ±standard error of the mean. Each colored triangle indicates the time to half-peak of the correspondingly colored curve. Horizontal bars indicate periods during which the correspondingly colored curves deviated significantly from zero as indicated by a cluster-based permutation test. The P value juxtaposed to each bar indicates the statistical significance of the corresponding cluster. Time-to-half-peak markers for adapter (B) are at 101 ms (shape), 90 ms (color), and 166 ms (interaction). Time-to-half-peak markers for test (F) are at 102 ms (shape), 96 ms (color), and 161 ms (interaction). C and E: counts of cases (out of a total of 222 tetrads tested in 111 neurons) in which neuronal firing rate 75–375 ms following the onset of the adapter (C) or test (E) was significantly (P < 0.05) dependent on its shape, its color or their interaction. Individual monkeys yielded comparable results (Supplemental Material 2-M1 and 2-M2).
Figure 3.
Figure 3.
Suppression of the response to the test image depended on whether it resembled the adapter in shape and in color. A: for trials under each of four conditions (shape-match alone, color-match alone, both matching, and neither matching), we computed the mean across all 111 neurons of firing rate as a function of time following test onset. The response to the test image was suppressed under all three match conditions (colored curves) as compared with the no-match condition (black dashed curve). B: counts of cases (out of a total of 222 tetrads tested in 111 neurons) in which neuronal firing rate 75–375 ms following the onset of the test was significantly (P < 0.05) dependent on shape-match, color-match, or their interaction. C: strength of shape-match suppression (green), color-match suppression (red), and their interaction (blue) as a function of time following test onset. Time-to-half-peak markers are at 146 ms (shape-match), 154 ms (color-match), and 181 ms (interaction). Other conventions as in Fig. 2. Individual monkeys yielded comparable results (Supplemental Material 3-M1 and 3-M2).
Figure 4.
Figure 4.
Dependence of repetition suppression on neuronal shape and color preference is captured by models incorporating feature-based suppression alone or image-based suppression in combination with fatigue. A: images were sorted, for each neuron, according to whether they contained the preferred (best) or nonpreferred (worst) shape or color. The mean strength of the population response to the test image is plotted as a function of the mean strength of the population response elicited by the same image when presented as adapter. When the test image contained the best shape and worst color, shape-match suppression (black arrow) predominated. When it contained the best color and worst shape, color-match suppression (gray arrow) predominated. B: firing rates produced by best-fit model incorporating feature-based suppression. C: firing rates produced by best-fit model incorporating image-based suppression. D: firing rates produced by best-fit model incorporating both image-based suppression and fatigue. The S•• model (B) and the I•F model (D) provide equivalent fits to the observed data (A) as indicated by nearly identical variance-explained measures depicted in Fig. 6A. However, S•• prevails with regard to efficiency of fit because it has fewer free parameters. This is evident from the Akaike information criterion corrected (AICc) measures shown in Fig. 6B. Individual monkeys yielded comparable results (Supplemental Material 4 A-M1 and 4 A-M2).
Figure 5.
Figure 5.
Performance measures for 16 models parametrically adjusted to provide the best fit to population data shown in Fig. 4A. A: percentage reduction of residual sum of squared differences afforded by each model. The height of each bar represents 100 × (BM)/B where B = 103.4 which was the residual sum of squared differences for the model that contained free parameters only for shape and color drives (•••) and M was the residual sum of squared differences for the model in question. Asterisks indicate cases in which an F test applied to two models with different degrees of freedom revealed a greater improvement in the full model than could be explained by additional degrees of freedom alone (*P < 0.05; **P < 0.01). The F test was based on raw residual sum of squared differences (RSS) and not on the percentage reduction of RSS depicted in the plot. B: Akaike information criterion for each model. The parenthetic number appended to each model’s acronym indicates its number of degrees of freedom. Individual monkeys yielded comparable results (Supplemental Material 5-M1 and 5-M2).
Figure 6.
Figure 6.
A model incorporating same-feature-based suppression out-performed models incorporating cross-feature-based and image-based suppression in fitting data from individual neurons. Bar-height indicates the number of cases out of a total of 222 in which each model provided the best fit to the data. In fitting noise (produced across 10 iterations by randomly shuffling the repetition-status labels of the 16 mean firing rates for each case), same-feature-based and cross-feature-based models performed equally well and out-performed the image-based model (gray bars). In fitting the observed data, the same-feature-based model prevailed more often than in the shuffle control whereas the other models prevailed less often. The difference in distribution of counts was statistically significant (P = 0.0013, χ2 test, df = 2, n = 222).
Figure 7.
Figure 7.
The trough-rebound response dynamic was most pronounced for a test image matching the adapter in both shape and color. A: the trough-rebound index for a fully matching test image is plotted against the trough-rebound index for the adapter. B: the trough-rebound index for a fully matching test image is plotted against the trough-rebound index for a test image matching the adapter in neither shape nor color. Individual monkeys yielded comparable results (Supplemental Material 7-M1 and 7-M2).
Figure 8.
Figure 8.
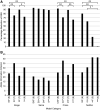
TE neurons are homogeneous wth respect to repetition suppression. A: for each neuron, for each of eight test images, we determined whether the mean firing rate 75–375 ms following test-image onset was lower when the test image matched the adapter in shape and color than when it matched in neither attribute. If it was lower, we considered it to be a case of suppression. For each neuron, the number of cases of suppression could range from a minimum of zero to a maximum of eight. The height of each black bar indicates the number of neurons with the corresponding count. We compared this distribution to the distribution of counts expected by chance on the principle that the probability of suppression for any particular neuron and any particular test image depended only on the overall frequency of cases of suppression across all neurons and all test images (gray bars). The black and gray distributions are not significantly different. B: collapsing data across all images studied in each neuron, we computed two measures: the mean firing rate and the mean difference in firing rate between trials when the test image differed from the adapter in both shape and color and trials when it was the same with regard to both attributes. The two measures were positively and significantly correlated, in accordance with the idea that suppression removes a fixed fraction of the response.
Figure 9.
Figure 9.
For a downstream area to distinguish a repeated image from an ineffective image on the basis of TE firing rate would be difficult because TE neurons do not form distinct low-suppression and high-suppression populations. A: when neurons were classified into putative low-suppression and high-suppression groups on the basis of responses to the test image during tetrad 1 trials, it was trivially possible, in data from tetrad 1 trials, to place a decision boundary in activation space that separated repeated (full match) from unrepeated (full nonmatch) conditions without regard to whether the test image was relatively ineffective (worst) or relatively effective (best). B: this approach failed when applied to data from tetrad 2 trials because subgroups yielding low suppression measures and high suppression measures for tetrad 1 did not exhibit low and high suppression for tetrad 2. For each tetrad studied in each neuron, firing rate was normalized by dividing the firing rate for each condition (best-match, best-nonmatch, worst-match, and worst-nonmatch) by the mean of the four firing rates. For each of the two populations under each of the four conditions, the population mean firing rate was computed as the average across neurons of the normalized firing rates.

Similar articles

Cited by

References

    1. Baylis GC, Rolls ET. Responses of neurons in the inferior temporal cortex in short term and serial recognition memory tasks. Exp Brain Res 65: 614–622, 1987. doi:10.1007/BF00235984. - DOI - PubMed
    1. Brown MW, Wilson FA, Riches IP. Neuronal evidence that inferomedial temporal cortex is more important than hippocampus in certain processes underlying recognition memory. Brain Res 409: 158–162, 1987. doi:10.1016/0006-8993(87)90753-0. - DOI - PubMed
    1. Saleem KS, Logothetis NK. Atlas of the Rhesus Monkey Brain in Stereotaxic Coordinates. Amsterdam: Academic Press, 2007.
    1. Fahy FL, Riches IP, Brown MW. Neuronal activity related to visual recognition memory: long-term memory and the encoding of recency and familiarity information in the primate anterior and medial inferior temporal and rhinal cortex. Exp Brain Res 96: 457–472, 1993. doi:10.1007/BF00234113. - DOI - PubMed
    1. Li L, Miller EK, Desimone R. The representation of stimulus familiarity in anterior inferior temporal cortex. J Neurophysiol 69: 1918–1929, 1993. doi:10.1152/jn.1993.69.6.1918. - DOI - PubMed

Publication types

LinkOut - more resources