. 2022 Sep 1;33(10):ar86.
doi: 10.1091/mbc.E22-05-0165. Epub 2022 Jul 13.

GOPC facilitates the sorting of syndecan-1 in polarized epithelial cells

Affiliations

GOPC facilitates the sorting of syndecan-1 in polarized epithelial cells

Charlotte Ford et al. Mol Biol Cell. .

Abstract

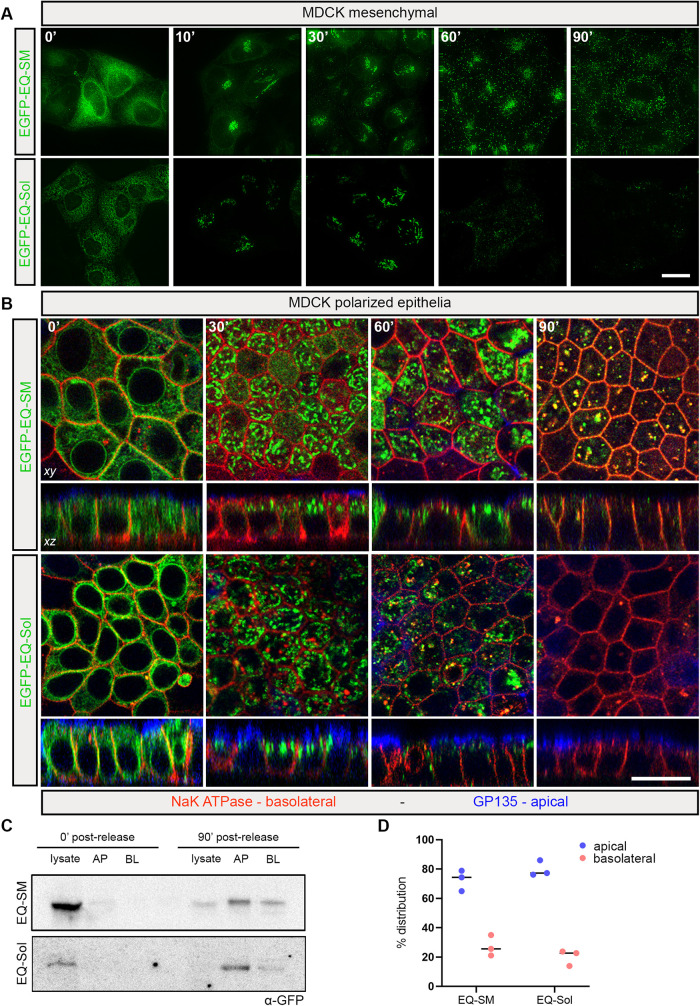
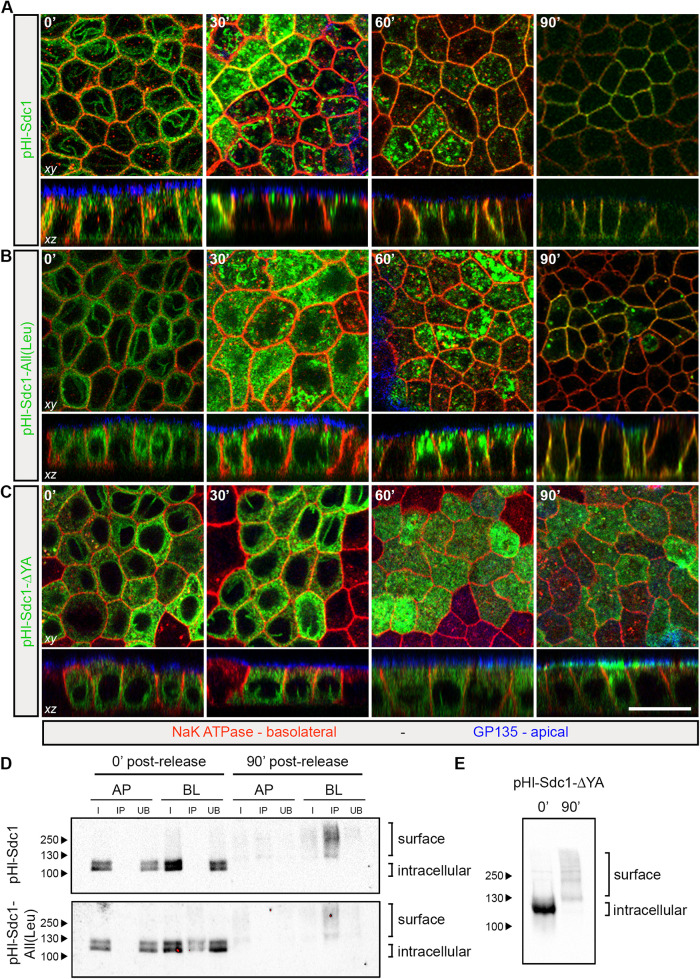
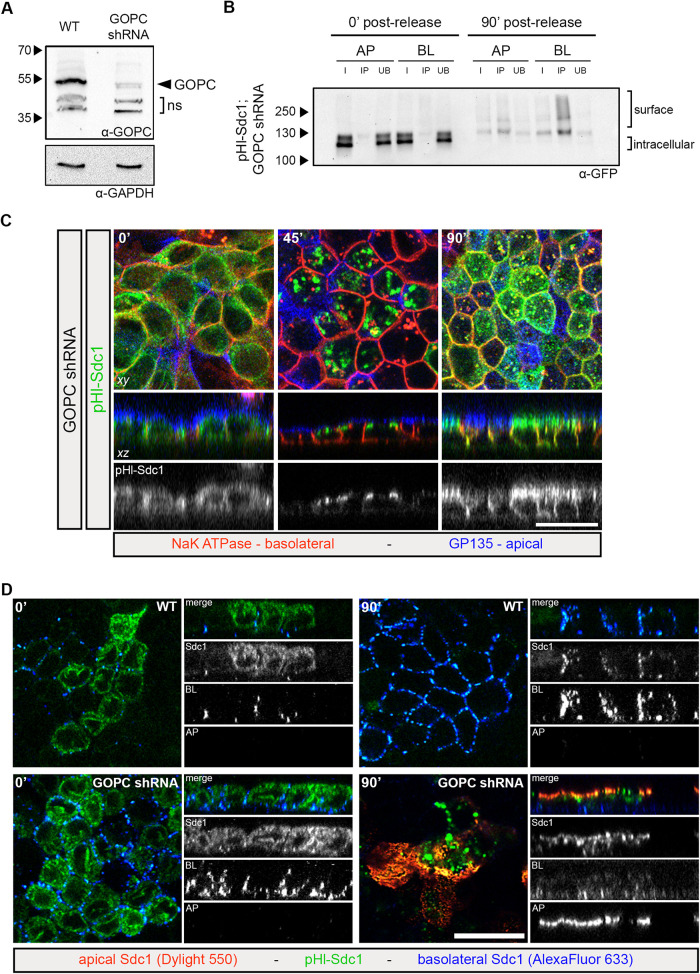
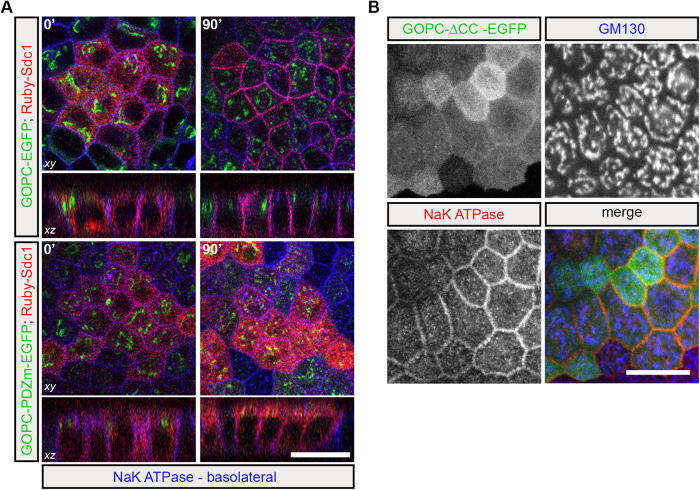
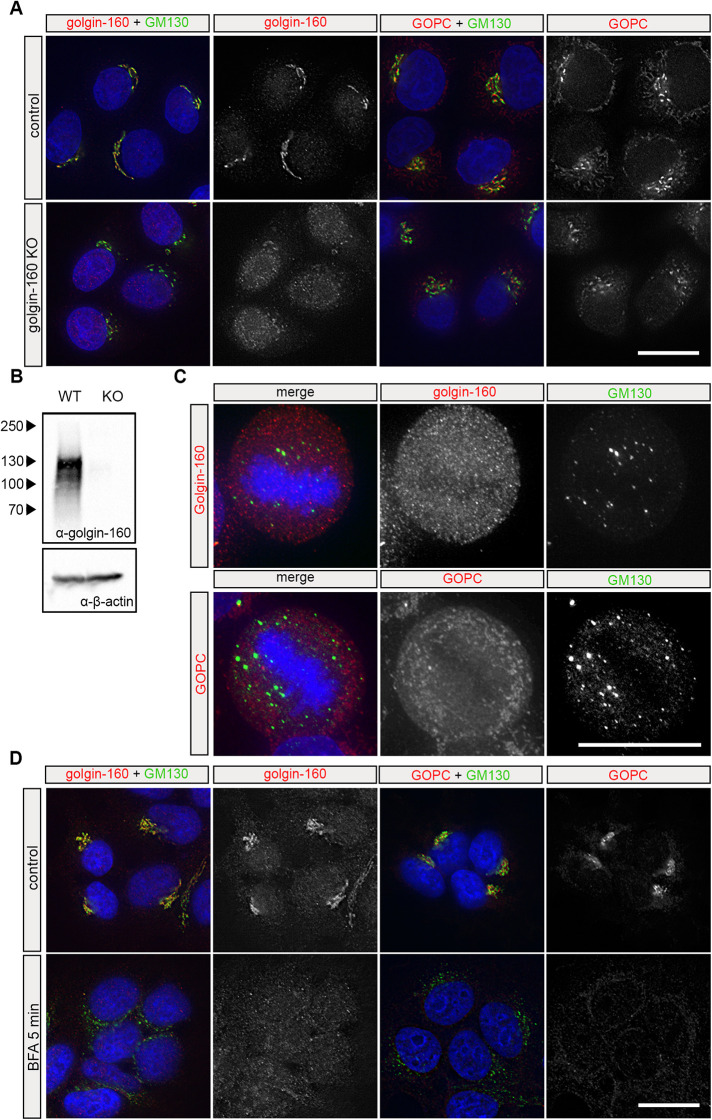
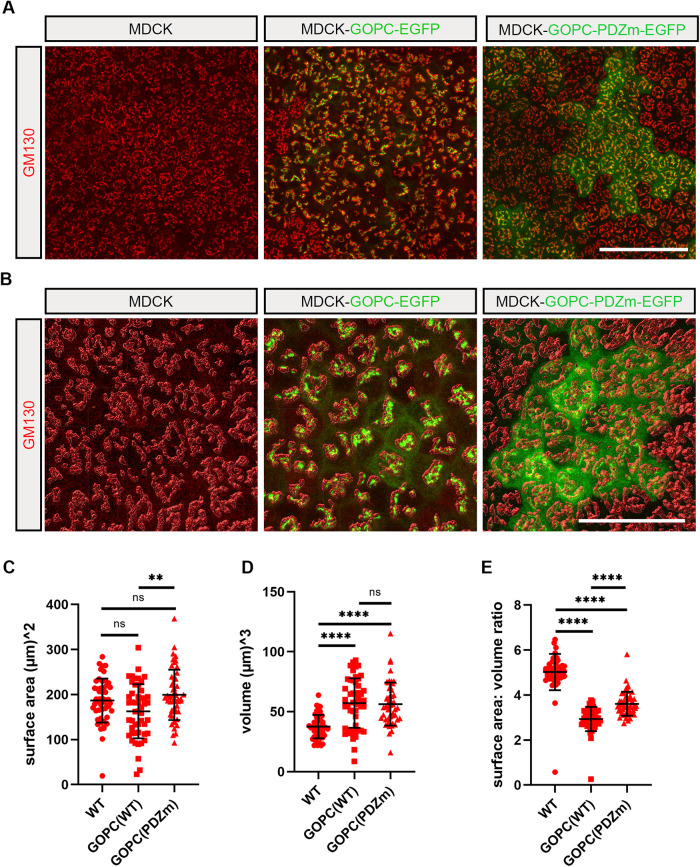
The trans-Golgi network must coordinate sorting and secretion of proteins and lipids to intracellular organelles and the plasma membrane. During polarization of epithelial cells, changes in the lipidome and the expression and distribution of proteins contribute to the formation of apical and basolateral plasma membrane domains. Previous studies using HeLa cells show that the syndecan-1 transmembrane domain confers sorting within sphingomyelin-rich vesicles in a sphingomyelin secretion pathway. In polarized Madin-Darby canine kidney cells, we reveal differences in the sorting of syndecan-1, whereupon the correct trafficking of the protein is not dependent on its transmembrane domain and changes in sphingomyelin content of cells during polarization. Instead, we reveal that correct basolateral targeting of syndecan-1 requires a full-length PDZ motif in syndecan-1 and the PDZ domain golgin protein GOPC. Moreover, we reveal changes in Golgi morphology elicited by GOPC overexpression. These results suggest that the role of GOPC in sorting syndecan-1 is indirect and likely due to GOPC effects on Golgi organization.


Figures

FIGURE 1:
FIGURE 1:
RUSH EQ-SM and EQ-Sol trafficking in MDCK cells. (A) Example micrographs of mesenchymal MDCK cells expressing RUSH-EGFP-EQ-SM or RUSH-EGFP-EQ-Sol at 0, 10, 30, 60, and 90 min after the addition of biotin, imaged by deconvolution microscopy. Scale bars represent 20 μm. (B) Example micrographs of polarized MDCK cells expressing RUSH-EGFP-EQ-SM or RUSH-EGFP-EQ-Sol at 0, 30, 60, and 90 min after the addition of biotin. Both single XY slices and XZ stacks are shown. Cells were fixed before staining with anti-NaK ATPase and anti-GP135 primary antibodies, followed by DyLight 550 (red)- and AlexaFluor 633 (blue)-conjugated secondary antibodies, respectively. Scale bars represent 20 μm. (C) Representative immunoblots of secreted RUSH-EGFP-EQ-SM or RUSH-EGFP-EQ-Sol collected from cell culture medium. MDCK cells expressing RUSH-EGFP-EQ-SM or RUSH-EGFP-EQ-Sol were polarized, and RUSH proteins were released from the ER by the addition of biotin. Apical and basolateral media as well as respective whole cell lysates were collected at 0 and 90 min postrelease. Media and lysates were processed for immunoblotting with an anti-GFP antibody. (D) Graph showing quantification of band intensity of three representative immunoblots of RUSH-EGFP-EQ-SM or RUSH-EGFP-EQ-Sol secretion into apical and basolateral medium as described in C. Blots were analyzed using ImageJ.
FIGURE 2:
FIGURE 2:
Physical properties of Sdc1 transmembrane domain not required for polarized delivery of Sdc1. Example micrographs of polarized MDCK cells expressing RUSH-pHluorin-Sdc1 (A), RUSH-pHluorin-Sdc1-AllL (B), or RUSH-pHluorin-Sdc1∆YA (C) at 0, 30, 60, and 90 min after the addition of biotin. Both single XY slices and XZ stacks are shown. Cells were fixed before staining with anti-NaK ATPase and anti-GP135 primary antibodies, followed by DyLight 550 (red)– and AlexaFluor 633 (blue)-conjugated secondary antibodies, respectively. Scale bars represent 20 μm. (D) MDCK cells expressing RUSH-pHluorin-Sdc1 or RUSH-pHluorin-Sdc1-AllL were polarized, and RUSH proteins were released from the ER by the addition of biotin. Biotin was added to the apical domain (AP) or the basolateral domain (BL) at 0 or 90 min postrelease. Biotinylated domain-specific surface protein was collected and processed for immunoblotting with an anti-GFP antibody. (E) Cultured MDCK cells expressing RUSH-pHluorin-Sdc1∆YA were collected at 0 or 90 min after release by the addition of biotin. Samples were collected and processed for immunoblotting with an anti-GFP antibody.
FIGURE 3:
FIGURE 3:
GOPC is required for basolateral delivery of Sdc1. (A) Immunoblot showing WT MDCK cells or MDCK cells stably expressing GOPC shRNA that were collected and processed for immunoblotting with an anti-GOPC antibody, revealing KD of GOPC. Two nonspecific bands are indicated (ns). (B) Polarized MDCK cells expressing GOPC shRNA and RUSH-pHluorin-Sdc1 were subjected to cell surface biotinylation following release of RUSH-pHluorin-Sdc1 from the ER. Biotin was added to the apical domain (AP) or the basolateral domain (BL) at 0 or 90 min postrelease. Biotinylated domain-specific surface protein was collected and processed for immunoblotting with an anti-GFP antibody. (C) Example micrographs of polarized MDCK cells expressing GOPC shRNA and RUSH-pHluorin-Sdc1 at 0, 45, and 90 min post–release from the ER. Both single XY slices and XZ stacks are shown. Cells were fixed before staining with anti-NaK ATPase and anti-GP135 primary antibodies, followed by DyLight 550 (red)- and AlexaFluor 633 (blue)-conjugated secondary antibodies, respectively. Scale bars represent 20 μm. (D) Micrographs showing the presence of Sdc1 on the apical membrane of MDCK cells following GOPC KD, as visualized by differential secondary antibody addition to the apical or basolateral membrane of nonpermeabilized cells. WT and GOPC shRNA cells expressing RUSH-pHluorin-Sdc1 were polarized before being fixed at 0 and 90 min post–release of pHlourin-Sdc1. After fixation, an anti-GFP antibody that recognizes pHluorin was added to both the apical and basolateral Transwell chambers. Cells were then washed, a DyLight 550 (red) secondary antibody was added to the apical chamber, and an AlexaFluor 633 (blue) secondary antibody was added to the basolateral chamber. Apical, basolateral and total pHlourin-Sdc1 signal can thus be distinguished by red, blue, and green fluorescence, respectively.
FIGURE 4:
FIGURE 4:
The PDZ domain of GOPC is required for Sdc1 sorting. (A) MDCK cells expressing GOPC shRNA and RUSH-Ruby-Sdc1 were complemented with either GOPC-WT-EGFP or GOPC-PDZm-EGFP and polarized. Cells were fixed at 0 and 90 min post–release of Ruby-Sdc1 from the ER. Cells were stained with anti-NaK ATPase and AlexaFluor 633 (blue)-conjugated secondary antibody. Images show representative fields of view as XY slices and XZ stacks. (B) MDCK cells expressing GOPC-∆CC-EGFP. Cells were fixed before being stained with anti-NaK ATPase and anti-GP135 primary antibodies, followed by DyLight 550 (red)- and AlexaFluor 633 (blue)-conjugated secondary antibodies, respectively. Images show a max projection of the mid three z slices of polarized MDCK cells to indicate lack of GOPC-∆CC-EGFP signal within the Golgi region. Scale bars represent 20 μm.
FIGURE 5:
FIGURE 5:
GOPC localization is influenced by cell cycle and ARF GTPase signaling but not golgin-160. (A) Representative images showing endogenous golgin-160 and GOPC in control and golgin-160 CRISPR KO HeLa cells. Cells were cultured for 24 h before fixation, permeabilization, and staining with an anti–golgin-160 or anti-GOPC antibody (as indicated) and a DyLight 550–conjugated secondary antibody and anti-GM130 and AlexaFluor 488–conjugated secondary antibody. Nuclei were identified by staining with 4’-6-diamidino-2-phenylindole (DAPI). Imaged by deconvolution microscopy. (B) Immunoblot showing WT or golgin-160 CRISPR KO HeLa cells that were collected and processed for immunoblotting with an anti–golgin-160 antibody. (C) Representative images showing endogenous golgin-160 and GOPC in cells undergoing mitosis. Cultured HeLa cells were fixed and permeabilized before being stained with an anti–golgin-160 or anti-GOPC antibody (as indicated) and a DyLight 550–conjugated secondary antibody and anti-GM130 and an AlexaFluor 488–conjugated secondary antibody. DAPI was used to stain the nucleus. Cells with condensed nuclei, indicated by DAPI staining, are outlined with white dashes. During mitosis, close association between GM130 and golgin-160 or GOPC is lost, and localization becomes distinct. Imaged by deconvolution microscopy. (D) Representative images showing endogenous golgin-160 and GOPC in control or brefeldin A (BFA)-treated cells. Cultured HEK cells were treated with either mock vehicular control or 1 µg/ml BFA for 5 min before fixation. Fixed cells were permeabilized before being stained with an anti–golgin-160 or anti-GOPC antibody (as indicated) and a DyLight 550–conjugated secondary antibody and anti-GM130 and an AlexaFluor 488–conjugated secondary antibody. Nuclei were stained with DAPI. Short BFA incubation times do not grossly disrupt Golgi morphology but reveal proteins that are dependent on Arf for localization. Imaged by deconvolution microscopy. Scale bars represent 20 μm.
FIGURE 6:
FIGURE 6:
GOPC overexpression induces changes in Golgi morphology. (A) Representative micrographs from WT MDCK cells or MDCK cells expressing GOPC-EGFP or GOPC-PDZm-EGFP showing Golgi morphology. Cells were polarized and fixed before being stained with an anti-GM130 primary antibody and an AlexaFluor 546–conjugated secondary antibody. Scale bar represents 50 μm. (B) 3D surfaces of GM130 staining generated from WT or GOPC-EGFP– or GOPC-PDZm-EGFP–expressing MDCK cells using IMARIS software. Scale bar represents 20 μm. Analysis of Golgi surface area (C), volume (D), and the surface area:volume ratio (E) of cells expressing GOPC-EGFP or GOPC-PDZm-EGFP. Cells expressing GOPC-EGFP or GOPC-PDZm-EGFP were polarized and fixed before being stained as in A. GM130 signal was then analyzed using IMARIS, rendering GM130 as a 3D surface for measurement. Quantification shows the average ± SD and individual values obtained for 50 Golgi per condition. ** p ≤ 0.01, **** p ≤ 0.0001.

Similar articles

References

    1. Afratis NA, Nikitovic D, Multhaupt HAB, Theocharis AD, Couchman JR, Karamanos NK (2017). Syndecans—key regulators of cell signaling and biological functions. FEBS J 284, 27–41. - PubMed
    1. Bass MD, Humphries MJ (2002). Cytoplasmic interactions of syndecan-4 orchestrate adhesion receptor and growth factor receptor signalling. Biochem J 368, 1–15. - PMC - PubMed
    1. Bentson LF, Agbor VA, Agbor LN, Lopez AC, Nfonsam LE, Bornstein SS, Handel MA, Linder CC (2013). New point mutation in Golga3 causes multiple defects in spermatogenesis. Andrology 1, 440–450. - PMC - PubMed
    1. Boncompain G, Divoux S, Gareil N, de Forges H, Lescure A, Latreche L, Mercanti V, Jollivet F, Raposo G, Perez F (2012). Synchronization of secretory protein traffic in populations of cells. Nat Methods 9, 493–498. - PubMed
    1. Cao X, Surma MA, Simons K (2012). Polarized sorting and trafficking in epithelial cells. Cell Res 22, 793–805. - PMC - PubMed

LinkOut - more resources