. 2022 Sep 1;33(10):ar87.
doi: 10.1091/mbc.E22-06-0239. Epub 2022 Jul 13.

Dynamic cell cycle-dependent phosphorylation modulates CENP-L-CENP-N centromere recruitment

Affiliations

Dynamic cell cycle-dependent phosphorylation modulates CENP-L-CENP-N centromere recruitment

Alexandra P Navarro et al. Mol Biol Cell. .

Abstract

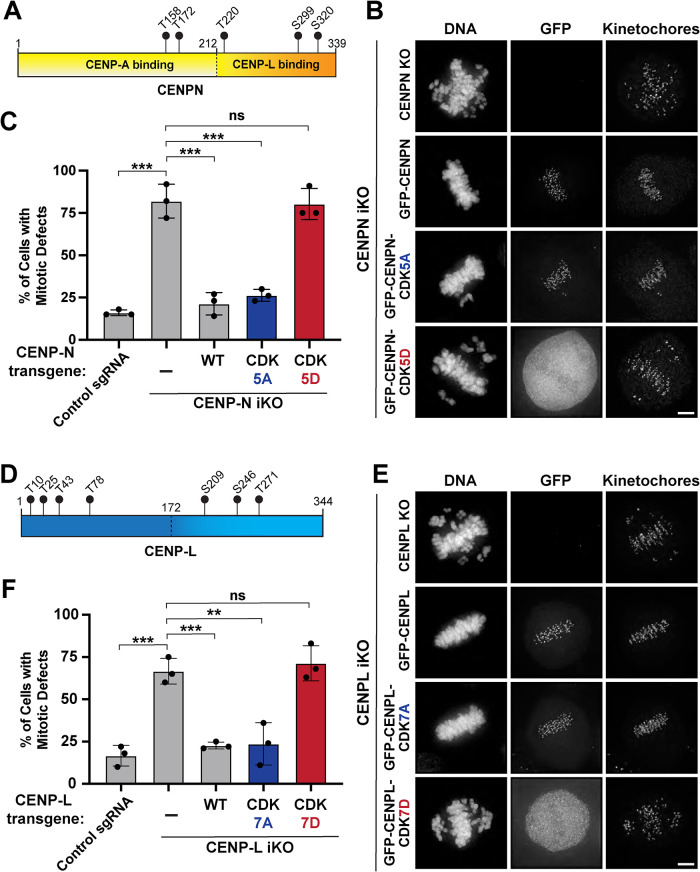
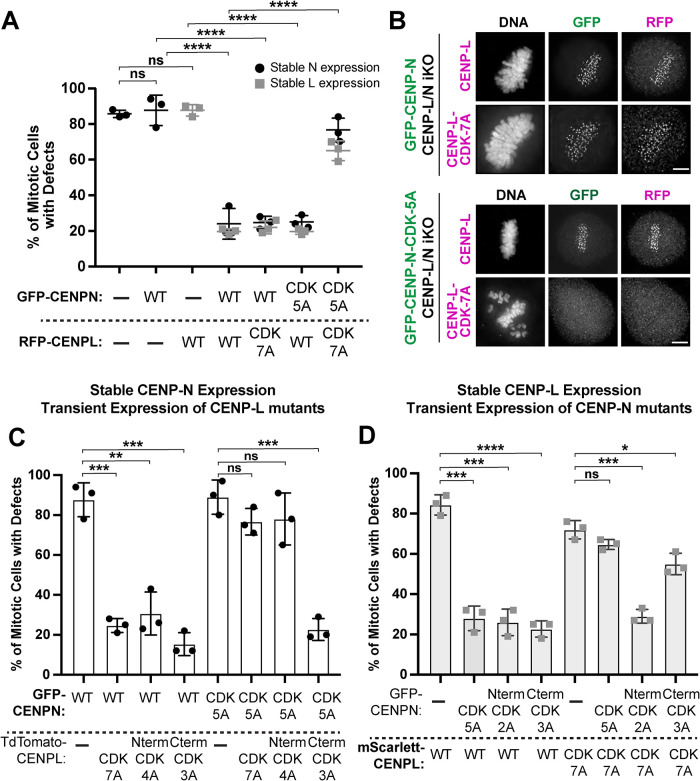
The kinetochore is a macromolecular structure that is needed to ensure proper chromosome segregation during each cellular division. The kinetochore is assembled upon a platform of the 16-subunit constitutive centromere-associated network (CCAN), which is present at centromeres throughout the cell cycle. The nature and regulation of CCAN assembly, interactions, and dynamics needed to facilitate changing centromere properties and requirements remain to be fully elucidated. The CENP-LN complex is a CCAN component that displays unique cell cycle-dependent localization behavior, peaking in the S phase. Here, we demonstrate that phosphorylation of CENP-L and CENP-N controls CENP-LN complex formation and localization in a cell cycle-dependent manner. Mimicking constitutive phosphorylation of either CENP-L or CENP-N or simultaneously preventing phosphorylation of both proteins prevents CENP-LN localization and disrupts chromosome segregation. Our work suggests that cycles of phosphorylation and dephosphorylation are critical for CENP-LN complex recruitment and dynamics at kinetochores to enable cell cycle-dependent CCAN reorganization.


Figures

FIGURE 1:
FIGURE 1:
CENP-N and CENP-L levels vary throughout the cell cycle. (A) Diagram illustrating the proteins that interact directly with centromere histone, CENP-A, within the constitutive centromere-associated network (CCAN). (B) Represen­tative images of centromere protein levels throughout the cell cycle. All GFP images are scaled to the S-phase image for each corresponding row. Note: The signal intensity in the representative images for G2 represents centromeres that have not been resolved following duplication of centromere DNA. Therefore, the signal in these images is brighter than what is represented in the quantification. DNA images shown in this figure are taken from the GFP-CENP-L cells shown in this image. Scale bar is 5 μm. (C) Quantification of CENP-C, CENP-N, and CENP-L levels throughout the cell cycle. CENP-C levels were detected using an antibody against CENP-C. CENP-N and CENP-L levels were determined using replacement cell lines expressing GFP-tagged transgenes. Additionally, CENP-L levels were determined using an antibody against untagged endogenous CENP-L a HeLa cell line not expressing GFP-CENP-L cell cycle stages were determined using the following markers: G1/prophase/mitosis–DM1a (presence of midbody for G1); spindle morphology for prophase and mitosis; S phase–PCNA (selected cells specifically in mid–S phase) Schonenberger et al., 2015; G2–cyclin B (looked for cytoplasmic Cyclin-B signal). Fluorescence intensity is graphed as a percent of max fluorescence. Each dot in the graph represents the mean percentage of max fluorescence intensity value obtained from three separate experiments. In each experiment 5, 10, and 10 cells were imaged per cell cycle stage and at least 40 kinetochores were quantified per cell. (D) Tables representing the mapped and predicted phosphorylation sites for CENP-N and CENP-L. Phosphorylation sites mapped by mass spectrometry include results from my data and previously published data of mitotically enriched proteomewide mass spectrometry analysis. The figure legend indicates where the phosphopeptides were identified. Predicted phosphorylation sites are additional serine/threonine residues in both CENP-L and CENP-N that fit the minimal CDK consensus sequence [S/T]-P. PSM = peptide spectrum match; Xcorr = cross-correlation.
FIGURE 2:
FIGURE 2:
Mutating phosphorylation sites in CENP-L and CENP-N affect their ability to localize to the kinetochore. (A) Diagram illustrating the positions of the SP/TP sites that were mutagenized in the CDK phosphomutants of CENP-N. We specifically note the sites that are present in the two known functional domains of CENP-N. (B) Representative images of the mitotic phenotypes observed for each replacement condition. All images were deconvolved and max projected. Images are scaled the same. Scale bar is 5 μm. (C) Quantification of mitotic phenotypes in CENP-N replacement cell lines after 5-day induction of endogenous CENP-N in the inducible knockout (iKO) cell line. Each point in the graph represents the percentage of cells with mitotic defects in three separate experiments. In each experiment at least 100 mitotic cells were randomly assessed for mitotic defects using microtubule stain to identify cells in mitosis (not shown). Multiple clones for each cell line were assessed to similar results-data shown was collected from a single clone over three experiments. The control sgRNA used is a guide that cuts a single time in the genome (van den Berg et al., 2018). Error bars indicate SD. Unpaired two-tailed t test was performed. p values from left to right: *** = 0.0004, *** = 0.0009, *** = 0.0008, ns = 0.8424. (D) Diagram illustrating the positions of the SP/TP sites that were mutagenized in the CDK-phosphomutants of CENP-L. (E) Representative images of the mitotic phenotypes observed for each replacement condition. All images were deconvolved and max projected. Images are scaled the same. Scale bar is 5 μm. (F) Quantification of mitotic phenotypes in CENP-L replacement cell lines after 5-day induction of endogenous CENP-L in the inducible knockout (iKO) cell line. Each dot in the graph represents the percentage of cells of cells with mitotic defects counted in three separate experiments. In each experiment at least 100 mitotic cells were randomly assessed for mitotic defects using microtubule stain to identify cells in mitosis (not shown). Multiple clones for each cell line were assessed to similar results—data shown were collected from a single clone over three experiments. The control sgRNA used is a guide that cuts at a single time in the genome (van den Berg et al., 2018). Error bars represent standard deviations. Unpaired two-tailed t test was performed. p values from left to right:*** = 0.0009, *** = 0.0007, ** = 0.0071, ns = 0.5652.
FIGURE 3:
FIGURE 3:
CDK sites in CENP-L and CENP-N are located at interaction interfaces between each protein and other proteins of the CCAN. Cartoon model of CENP-L (shown in blue) and CENP-N (shown in yellow) adapted from PDB:7QOO (Pesenti et al., 2022) with amino acid residues of interest represented as sticks. Note: The following residues are not present in the structure: CENP-N: T220; CENP-L: T10, T25. Only a portion of the structure is represented in this figure. Each boxed region highlights where each amino acid residue is in the CENP-L/N structure and the interaction interface that is represented in the larger CCAN structure not included in this simplified figure. The following amino acid residues are shown for each interacting protein: CENP-O (shown in orange):110–203; CENP-M (shown in green): 65–130; CENP-I (shown in magenta): 334–662.
FIGURE 4:
FIGURE 4:
Phosphorylation state affects the interaction between CENP-N and CENP-L. (A) Diagram illustrating the lacO ectopic targeting assay. (B) Representative images of the Lac array assay for LacI-GFP-CENP-N mutants and the recruitment of TdTomato-CENP-L. GFP and TdTomato images are scaled the same. Images are max projected and deconvolved. Scale bar is 5 μm. (C, D) Quantification of fluorescence intensity for recruitment of TdTomato-tagged constructs to the lacO array by the LacI-GFP bait protein. Each dot represents the ratio between RFP:GFP fluorescence at a single focus. Data were collected from three separate experiments. Error bars represent SD. Unpaired two-tailed t test was performed. For C, p values presented for brackets going from left to right: **** = < 0.0001, ns = 0.6305, **** = < 0.0001, * = 0.0429, **** = < 0.0001. N values from left to right: N = 38, N = 37, N = 38, N = 38, N = 30, N = 30. For D, p values presented for brackets from left to right: **** = < 0.0001, *** = 0.005, ****< 0.001, *** = 0.008. N values from left to right: 41, 53, 53, 54, 54, 25, 26.
FIGURE 5:
FIGURE 5:
Splitting phosphomimetic point mutations between the N and C terminus results in differential localization behavior. (A) Representative images of mitotic and interphase cells demonstrating the localization of CENP-N split phosphomutants stably expressed in HeLa cells in the presence of endogenous protein. Showing DNA (Hoechst) and GFP (GFP booster). Diagrams illustrate what sites were mutated in each GFP-tagged construct. Images are deconvolved and max projected. Scale bar is 5 μm. (B) Representative images of mitotic phenotypes from CENP-N inducible knockout cell lines expressing the indicated GFP-tagged guide-resistant constructs after 5-day induction of CENP-N knockout. Shown in the figure is DNA (Hoechst), GFP, Kinetochores (anti-centromere antibodies (ACA). Images are deconvolved and max projected. Scale bar is 5 μm. (C) Quantification of mitotic cells with defects observed in GFP-CENPN replacement cell lines following inducible knockout (iKO) of endogenous CENP-N for 5 d. Mitotic defects include misaligned chromosomes and multipolar spindles. Each dot in the graph represents the percentage of cells with mitotic defects counted in three separate experiments. In each experiment at least 100 mitotic cells were randomly assessed for mitotic defects using microtubule stain to identify cells in mitosis (not shown). Multiple clones for each cell line were assessed to similar results; data shown were collected from a single clone over three separate experiments. The control sgRNA used is a guide that cuts at a single time in the genome (van den Berg et al., 2018). Error bars represent standard deviations. Unpaired two-tailed t test was performed. p values from left to right: *** = 0.0008, ** = 0.0014, ns = 0.4086, ns = 0.6098, ns = 0.8672. I GFP-CENP-NNtermCDK-2D replacement cell line is not a clonal cell line, and is only enriched for GFP fluorescence. All other GFP rescue cell lines are clonal. (D) Representative images of mitotic and interphase cells demonstrating the localization of CENP-L split phosphomutants stably expressed in HeLa cells in the presence of endogenous protein. DNA (Hoechst) and GFP (GFP booster) are shown. Diagrams illustrate what sites were mutated in each GFP-tagged construct. Images are deconvolved and max projected. Scale bar is 5 μm. (E) Representative images of mitotic phenotypes from CENP-L inducible knockout cell lines expressing the indicated GFP-tagged guide-resistant constructs after 5-day induction of CENP-L knockout. Shown in the figure are DNA (Hoechst), GFP, and kinetochores (anti-centromere antibodies [ACA]). Images are deconvolved and max projected. Scale bar is 5 μm. (F) Quantification of mitotic cells with defects observed in GFP-CENP-L replacement cell lines following inducible knockout (iKO) of endogenous CENP-L for 5 d. Mitotic defects include misaligned chromosomes and multipolar spindles. Each dot in the graph represents the percentage of cells with mitotic defects counted in three separate experiments. In each experiment at least 100 mitotic cells were randomly assessed for mitotic defects using microtubule stain to identify cells in mitosis (not shown). Multiple clones for each cell line were assessed to similar results-data shown was collected from a single clone over three experiments. The control sgRNA used is a guide that cuts at a single time in the genome (van den Berg et al., 2018). Error bars represent standard deviations. Unpaired two-tailed t test was performed. p values from left to right: *** = 0.0002, **** = < 0.0001, * = 0.0255, ** = 0.0029, **** = < 0.0001.
FIGURE 6:
FIGURE 6:
Preventing phosphorylation of both proteins negatively affects the function of the CENP-LN complex. (A) Quantification of mitotic cells with defects observed in CENP-L/CENP-N dual inducible knockout (iKO) cell lines following 5 d of knockout of endogenous. In the stable N expression experiments (represented by black dots), Td-Tomato-tagged CENP-L constructs were transiently transfected on the third day of dox induction, 48 h before cells were fixed. The inverse was done for the stable L expression (represented by gray dots) experiments. Each dot represents the percent of cells with mitotic defects counted in three separate experiments. Approximately 75 cells were counted per condition; cells were selected by finding cells expressing a control plasmid expressing a GFP or RFP alone (not shown). Multiple clones for each cell line were assessed with similar results—data shown were collected from a single clone over three experiments. Unpaired two-tailed t test was performed. p values from left to right: ns = 0.7126, ns = 0.4169, all **** = <0.0001. (B) Representative immunofluorescence images of mitotic phenotypes from CENP-L/N inducible knockout cell lines stably expressing either GFP-CENPN or CENP-CENPNCDK-5A and transiently expressing TdTomato-tagged CENP-L or CENP-LCDK-7A constructs 48 h before fixing. Images are deconvolved and max projected. Scale bar is 5 μm. (C) Quantification of mitotic cells with defects observed in CENP-L/CENP-N dual inducible knockout (iKO) cell lines following 5 d of knockout of endogenous stably expressing either GFP-CENP-N or GFP-CENP-NCDK-5A and transiently expressing TdTomato-CENP-L constructs for 48 h before fixation. Each dot represents the percent of cells with mitotic defects counted in three separate experiments. Approximately 75 cells were counted per condition; cells were selected by finding cells expressing a control plasmid expressing a GFP or RFP alone (not shown). Multiple clones for each cell line were assessed with similar results—data shown were collected from a single clone over three experiments. Unpaired two-tailed t test was performed. p values from left to right: *** = 0.0003, ** = 0.0020, *** = 0.0003, ns = 0.1199, ns = 0.2879, *** = 0.0003. (D) Quantification of mitotic cells with defects observed in CENP-L/CENP-N dual inducible (iKO) knockout cell lines following 5 d of knockout of endogenous stably expressing either mScarlett-CENP-L or mScarlett-CENP-LCDK-7A and transiently expressing GFP-CENP-N constructs for 48 h before fixation. Each dot represents the percent of cells with mitotic defects counted in three separate experiments. Approximately 75 cells were counted per condition; cells were selected by finding cells expressing a control plasmid expressing a GFP or RFP alone (not shown). Multiple clones for each cell line were assessed with similar results—data shown were collected from a single clone over three experiments. Unpaired two-tailed t test was performed. p values from left to right: *** = 0.0002, *** = 0.0003, ****–< 0.0001, ns = 0.0720, *** = 0.0002, * = 0.0136.
FIGURE 7:
FIGURE 7:
Modulating the interaction between CENP-L and CENP-N impacts the localization behavior of the CENP-L/N complex throughout the cell cycle. Phosphorylation functions to weaken the interaction between CENP-L and CENP-N. Based on our data, the CENP-LN complex is phosphorylated upon entry into mitosis. This phosphorylation event functions to break the interaction between a subset of CENP-N and CENP-L molecules resulting in their dissociation from the centromere. Following phosphorylation in mitosis, CENP-L and CENP-N must then be dephosphorylated to relocalize them to the centromere during S-phase.

Similar articles

Cited by

References

    1. Allu PK, Dawicki-McKenna JM, Van Eeuwen T, Slavin M, Braitbard M, Xu C, Kalisman N, Murakami K, Black BE (2019). Structure of the human core centromeric nucleosome complex. Curr Biol 29, 2625–2639.e2625. - PMC - PubMed
    1. Amano M, Suzuki A, Hori T, Backer C, Okawa K, Cheeseman IM, Fukagawa T (2009). The CENP-S complex is essential for the stable assembly of outer kinetochore structure. J Cell Biol 186, 173–182. - PMC - PubMed
    1. Basilico F, Maffini S, Weir JR, Prumbaum D, Rojas AM, Zimniak T, De Antoni A, Jeganathan S, Voss B, van Gerwen S, et al. (2014). The pseudo GTPase CENP-M drives human kinetochore assembly. Elife 3, e02978. - PMC - PubMed
    1. Carroll CW, Milks KJ, Straight AF (2010). Dual recognition of CENP-A nucleosomes is required for centromere assembly. J Cell Biol 189, 1143–1155. - PMC - PubMed
    1. Carroll CW, Silva MC, Godek KM, Jansen LE, Straight AF (2009). Centromere assembly requires the direct recognition of CENP-A nucleosomes by CENP-N. Nat Cell Biol 11, 896–902. - PMC - PubMed

Publication types

MeSH terms

Substances

LinkOut - more resources