. 2022 Jul 12;40(2):111076.
doi: 10.1016/j.celrep.2022.111076.

Stochastic models of nucleosome dynamics reveal regulatory rules of stimulus-induced epigenome remodeling

Affiliations

Stochastic models of nucleosome dynamics reveal regulatory rules of stimulus-induced epigenome remodeling

Jinsu Kim et al. Cell Rep. .

Abstract

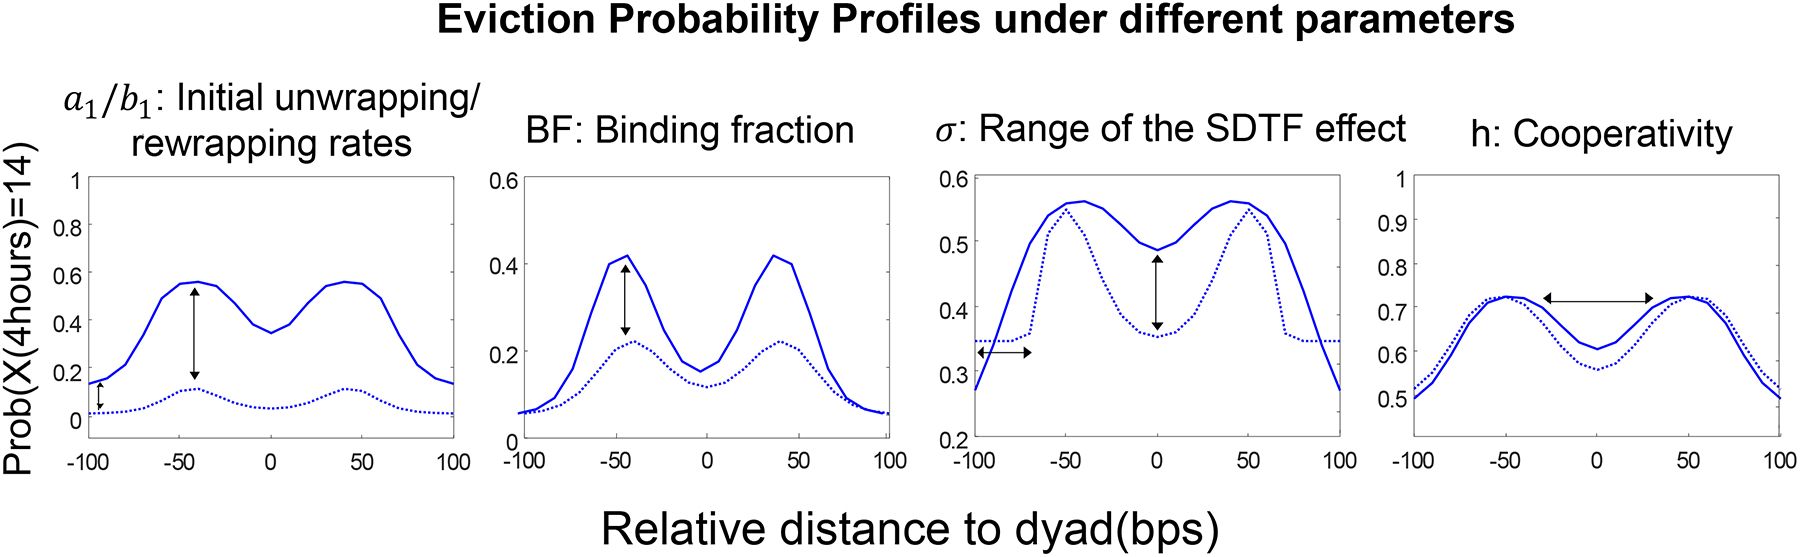
The genomic positions of nucleosomes are a defining feature of the cell's epigenomic state, but signal-dependent transcription factors (SDTFs), upon activation, bind to specific genomic locations and modify nucleosome positioning. Here we leverage SDTFs as perturbation probes to learn about nucleosome dynamics in living cells. We develop Markov models of nucleosome dynamics and fit them to time course sequencing data of DNA accessibility. We find that (1) the dynamics of DNA unwrapping are significantly slower in cells than reported from cell-free experiments, (2) only models with cooperativity in wrapping and unwrapping fit the available data, (3) SDTF activity produces the highest eviction probability when its binding site is adjacent to but not on the nucleosome dyad, and (4) oscillatory SDTF activity results in high location variability. Our work uncovers the regulatory rules governing SDTF-induced nucleosome dynamics in live cells, which can predict chromatin accessibility alterations during inflammation at single-nucleosome resolution.

Keywords: ATAC-seq; CP: Molecular biology; NF-κB; cooperativity; histone eviction; nucleosome dynamics; random walk; signal-dependent transcription factor; stochastic model; time-dependent Markov model.


Conflict of interest statement

Declaration of interests The authors declare no competing interests.

Figures

Figure 1:
Figure 1:. A stochastic model accounts for nucleosome eviction by dynamic SDTF activity.
A. Immune responses activate SDTFs with different temporal dynamics, ultimately affecting chromatin accessibility. B. Schematic for the unwrapping/rewrapping model for nucleosome dynamics under SDTF signaling dynamics. C. State configuration of the stochastic nucleosome model, where ai, bi, ci, di represent rate parameters. (See also Figure S1 and S7).
Figure 2:
Figure 2:. Periodicity of SDTF oscillations affects DNA accessibility.
A. Experimental knowledge of SDTF signaling dynamics in single cells (top: two individual single cells, bottom: hundreds of single cells). WT and Mut cells activate NFκB with different temporal dynamics (Adelaja et al., 2021). B-D. Chromatin response to oscillatory SDTF dynamics with different frequency. B. SDTF dynamics with rapid (top) or slow oscillation (bottom). C. 50 sample traces of DNA dynamics under the oscillatory SDTF inputs of half-period=10min (top) and 60min (bottom). Red traces reach the fully evicted state, and black traces do not. D. Time evolution of histone eviction probability. E-G. Parameter sensitivity under oscillatory vs. constant SDTF signals. E. Oscillatory and constant SDTF signal inputs. F. Full eviction probability vs unwrap parameter cooperativity (h = 1.3). m represents the fold-change increase in unwrapping/rewrapping parameters. G. Mean chromatin accessibility distribution at t = 500 min with the oscillatory or constant SDTF dynamics. To model heterogeneous cell environment, we randomly perturb the system parameters. Coefficient variation (standard deviation/mean) of the distributions under oscillatory SDTF and constant SDTF are 0.35 and 0.12, respectively. (See also Figure S2).
Figure 3:
Figure 3:. Modeling SDTF binding sites, range of SDTF effect, and cooperativity in unwrapping steps reveals potential Eviction Probability Profiles.
A. Summary of NFκB motifs adjacent to nucleosome dyads. Shown are NFκB motifs in relation to each nucleosome dyad called by NucleoATAC (Schep et al., 2015) at 0 hours and 4 hours after TNF stimulation, in male mouse BMDMs (no replicates used, n=1 for each timepoint, validation experiment performed in Figure 6). Locations shown have an NFκB motif +/− 100bp of the nucleosome dyad. B. SDTFs locally affects the DNA-histone contact regions near the SDTF binding site. C. The range parameter σ determines how widely the SDTF affects the rewrapping parameters. D. Computation of the full eviction probability via the stochastic model shows that motifs at the dyad promote greater nucleosome unwrapping probability under a non-oscillatory SDTF signal and non-cooperative open/close parameters. E. The full eviction probability is maximal at the SDTF binding location between the edge and dyad under cooperative unwrap/rewrap parameters. Assuming 50% of right edge-unwrapping and 50% of left edge-unwrapping, the average full eviction probability displays a center valley. (See also Figure S3, S4, and S6).
Figure 4:
Figure 4:. Fitting the model Eviction Probability Profiles to SDTF binding location data provides evidence of cooperativity and estimates model parameters.
A. Probabilities of full eviction with respect to relative motif position from the nucleosome dyad, and SDTF binding effect range for the macrophage system under non-oscillatory NFκB signal. Three different ranges (σ2 = 1.5, 10, and 50) and cooperativity parameters (h = 1, 1.1 and 1.2) are chosen. B. Left: Nucleosome counts from male mouse BMDM ATAC-seq samples under non-oscillatory TNF-induced NFκB activity at NFκB motifs at 0 hours and 4 hours (no replicates used, n=1 for each timepoint, validation experiment performed in Figure 6). Right: Full eviction probability vs. SDTF binding locations. Experiment-based Eviction Probability Profile (red curves). Model-based Eviction Probability Profile before and after parameter fitting by gradient descent (blue curves). C. Full DNA eviction probability under a steady NFκB input signal of different durations. Red: Experimental measurements shown in Cheng et al., 2021. Blue: Simulated values using the stochastic model with the fitted parameters in Table S1. D. Left: Fold change (WT/Mut) of resulting chromatin accessibility after activation of SDTFs with different dynamics. Two biological replicates were used for each genotype (n=2). Right: Reproduction of the experimental measurements using the stochastic nucleosome model under the fitted parameters listed in Table S1. Counts are converted to proportion due to simulation of a different number of nucleosome locations. E. Left: Variance in chromatin accessibility across genomic locations at 4 hours in WT and Mut cells, as measured by bulk ATACseq. Two biological replicates were used for each genotype (n=2). Right: Reproduction of the experimental measurements using the stochastic nucleosome model. (See also Figure S5).
Figure 5:
Figure 5:. Consistency of the Eviction Probability Profiles under more general parameter settings.
A. Generalization of the model where SDTF binding rate κon(s) is a function of the binding location s. B. Resulting Eviction Probability Profiles based on the binding rates illustrated in A. C. Generalization of the model where SDTF binding rate κon(n) is a function of the DNA opening state n. D. Resulting Eviction Probability Profiles based on the binding rates illustrated in C. (See also Figure S6).
Figure 6:
Figure 6:. Stimulation of macrophages with LPS leads to consistent modeling results.
A. Schematic of SDTF activation in response to TNF or LPS. TNF stimulation results in NFκB activity, while LPS stimulation results in both NFκB and IRF activity. B. Top: Experimental and simulated nucleosome counts after LPS stimulation, for NFκB-associated nucleosome locations after 0hrs and 4hrs (n=1 for each timepoint). Bottom: Analogous counts for IRF-associated nucleosome locations (n=1 for each timepoint). C. Eviction Probability Profiles associated with LPS-induced NFκB activity, using the same model parameters as the TNF-induced data (green) and direct fit (blue). D. Eviction Probability Profiles associated with LPS-induced IRF3 activity. *: All the parameters are the same as the fitted parameters with the TNF data (Figure 4) except for the SDTF unbinding fraction, BF. (See also Figure S5).
Figure 7:
Figure 7:. The Eviction Probability Profile is a fingerprint for kinetic features of nucleosome dynamics.
The geometric characteristics of the Eviction Probability Profile has one-to-one correspondence to the parameters of the stochastic epigenome model. For a given location-specific nucleosome eviction profile, this correspondence can be used to identify epigenetic features such as the DNA unwrapping parameter, the SDTF binding fraction, and the cooperativity. (See also Figure S5).

References

    1. Adelaja A, Taylor B, Sheu KM, Liu Y, Luecke S, and Hoffmann A (2021). Six distinct NFκB signaling codons convey discrete information to distinguish stimuli and enable appropriate macrophage responses. Immunity 54, 916–930.e7. 10.1016/j.immuni.2021.04.011. - DOI - PMC - PubMed
    1. Alberts B, Johnson A, Lewis J, Raff M, Roberts K, and Walter P (2002). Chromosomal DNA and Its Packaging in the Chromatin Fiber. Molecular Biology of the Cell. 4th Edition.
    1. Allfrey VG, Littau VC, and Mirsky AE (1963). ON THE ROLE OF HISTONES IN REGULATING RIBONUCLEIC ACID SYNTHESIS IN THE CELL NUCLEUS*. Proc Natl Acad Sci U S A 49, 414–421. - PMC - PubMed
    1. Al-Radhawi MA, Vecchio DD, and Sontag ED (2019). Multi-modality in gene regulatory networks with slow promoter kinetics. PLOS Computational Biology 15, e1006784. 10.1371/journal.pcbi.1006784. - DOI - PMC - PubMed
    1. Barken D (2005). Comment on “Oscillations in NF- B Signaling Control the Dynamics of Gene Expression.” Science 308, 52a–52a. 10.1126/science.1107904. - DOI - PMC - PubMed

Publication types