. 2022 Jul 12;40(2):111039.
doi: 10.1016/j.celrep.2022.111039.

A specialized Hsp90 co-chaperone network regulates steroid hormone receptor response to ligand

Affiliations

A specialized Hsp90 co-chaperone network regulates steroid hormone receptor response to ligand

Sarah J Backe et al. Cell Rep. .

Abstract

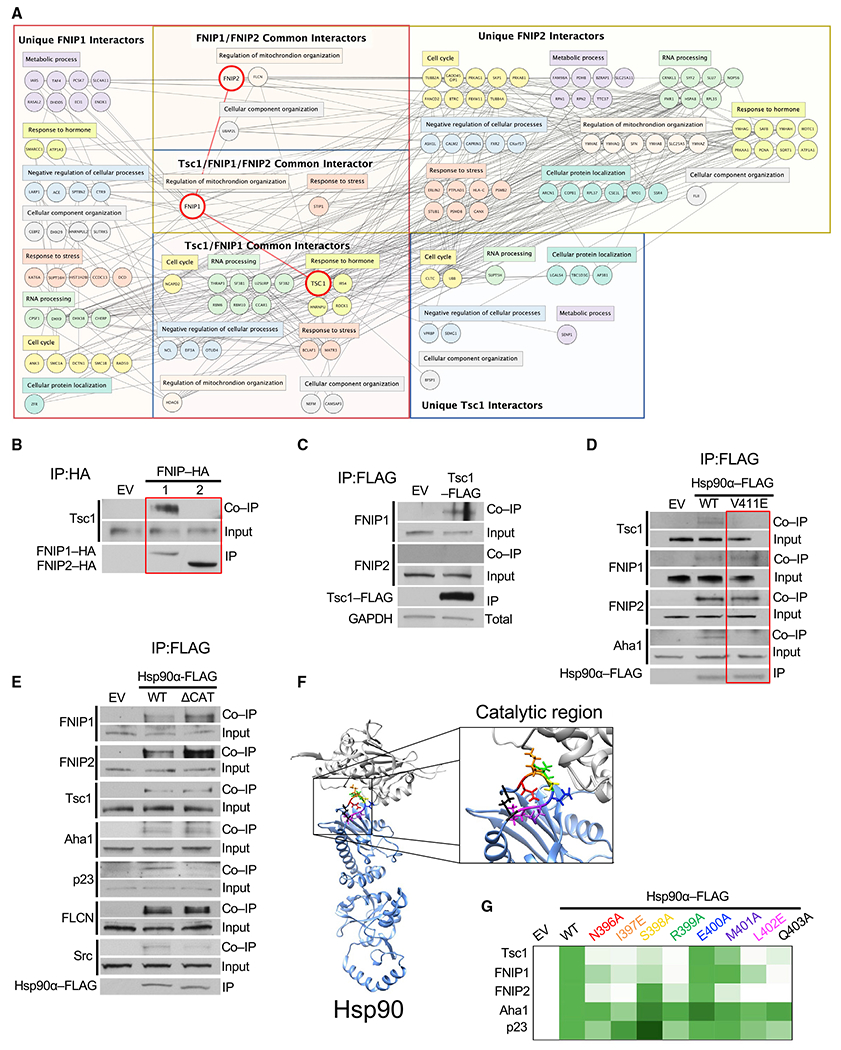
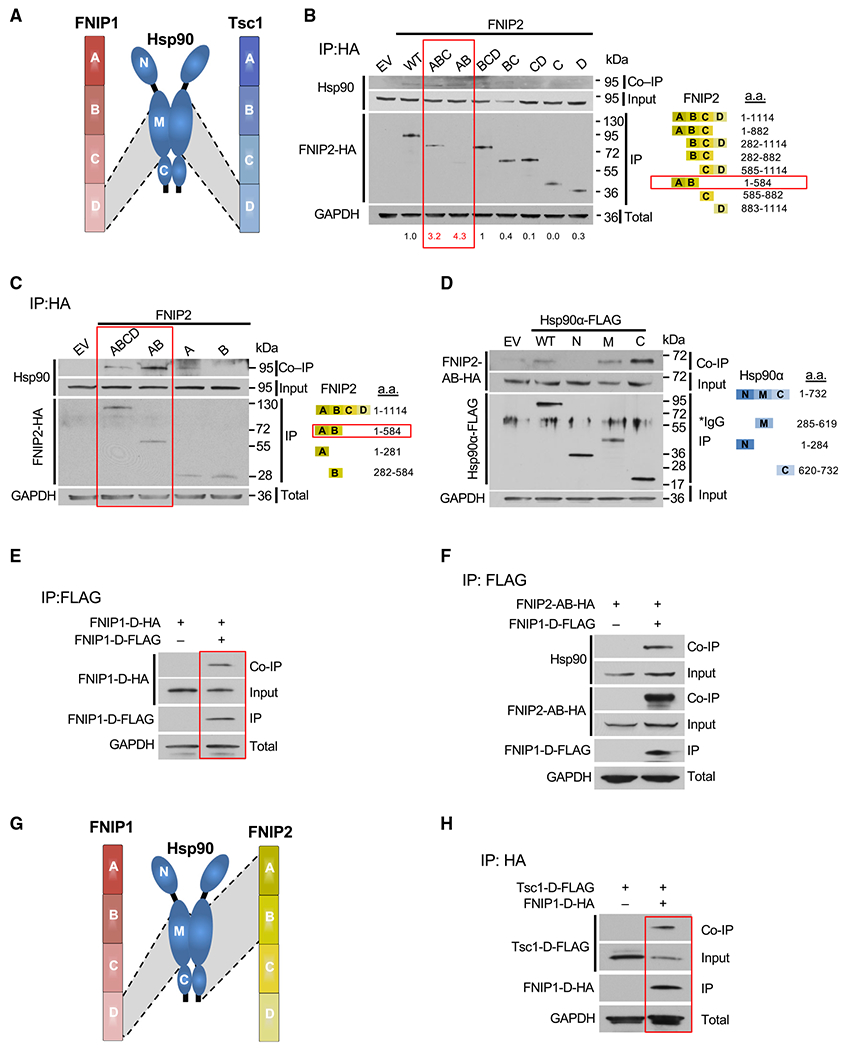
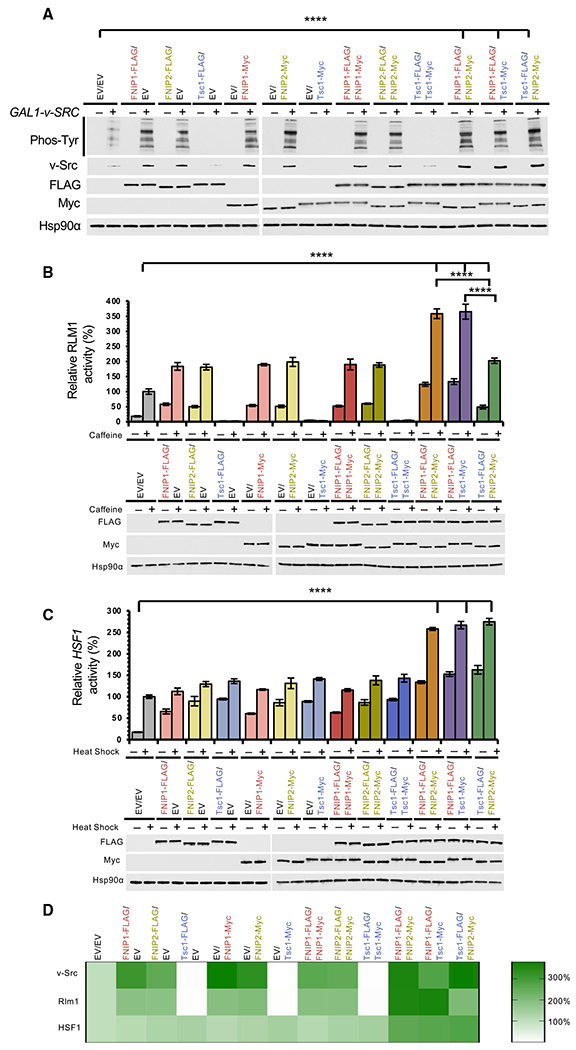
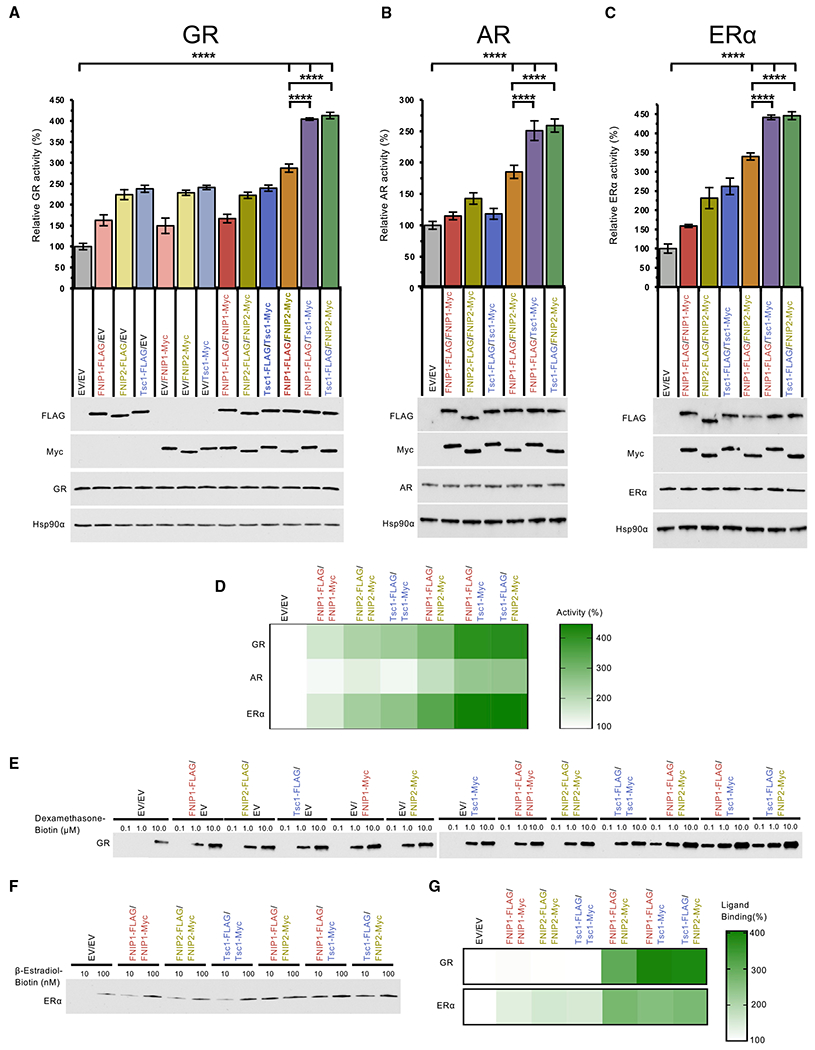
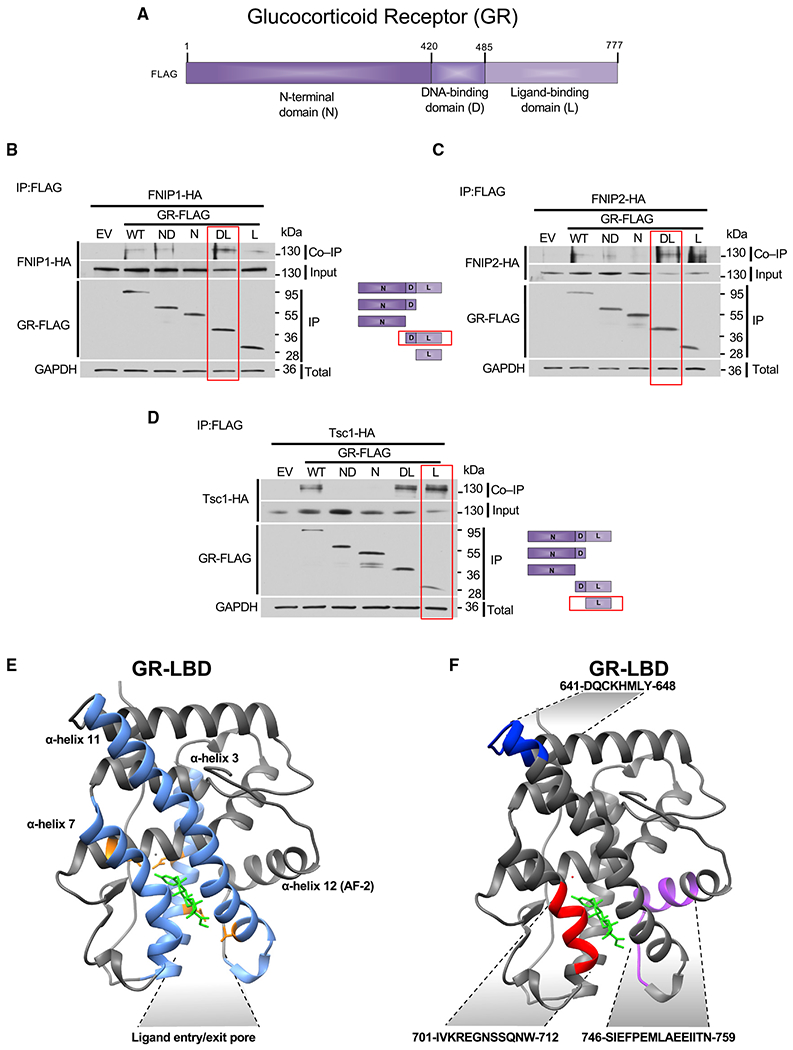
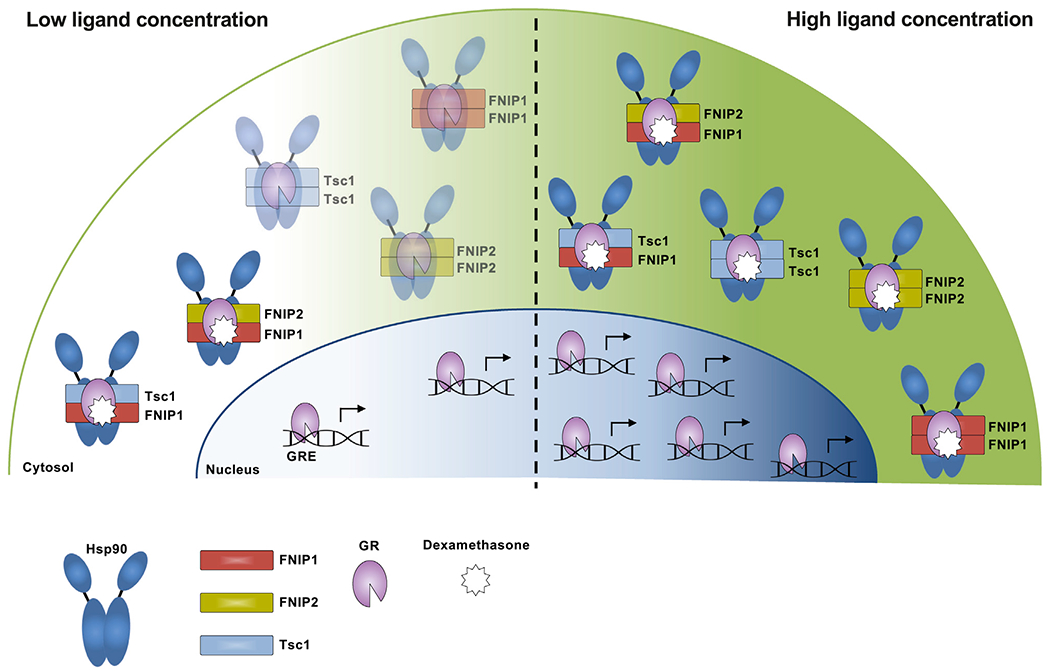
Heat shock protein-90 (Hsp90) chaperone machinery is involved in the stability and activity of its client proteins. The chaperone function of Hsp90 is regulated by co-chaperones and post-translational modifications. Although structural evidence exists for Hsp90 interaction with clients, our understanding of the impact of Hsp90 chaperone function toward client activity in cells remains elusive. Here, we dissect the impact of recently identified higher eukaryotic co-chaperones, FNIP1/2 (FNIPs) and Tsc1, toward Hsp90 client activity. Our data show that Tsc1 and FNIP2 form mutually exclusive complexes with FNIP1, and that unlike Tsc1, FNIP1/2 interact with the catalytic residue of Hsp90. Functionally, these co-chaperone complexes increase the affinity of the steroid hormone receptors glucocorticoid receptor and estrogen receptor to their ligands in vivo. We provide a model for the responsiveness of the steroid hormone receptor activation upon ligand binding as a consequence of their association with specific Hsp90:co-chaperone subpopulations.

Keywords: CP: Molecular biology; FNIP1; FNIP2; Hsp90; Tsc1; androgen receptor; chaperone; chaperone code; co-chaperone; glucocorticoid receptor; steroid hormone receptors.


Conflict of interest statement

Declaration of interests The authors declare no competing interests.

Figures

Figure 1.
Figure 1.. Hsp90 catalytic loop facilitates binding of Tsc1 and FNIPs co-chaperones
(A) FNIP1-FLAG, FNIP2-FLAG, or Tsc1-FLAG was transiently expressed in HEK293 cells. FLAG-tagged proteins were isolated by immunoprecipitation (IP) and subject to liquid chromatography-tandem mass spectrometry (LC-MS/MS) to identify interacting proteins. Interacting proteins were divided into categories based on biological function using https://string-db.org. See also Figure S1. (B) FNIP1-HA, FNIP2-HA, or empty vector (EV; control) was immunoprecipitated from HEK293 cells. coIP of Tsc1 was examined by immunoblot. (C) Tsc1-FLAG was immunoprecipitated from HEK293 cells. coIP of FNIP1 or FNIP2 was examined by immunoblot. GAPDH was used as a loading control. (D) Hsp90α-FLAG-wild type (WT) and -V411E were transiently transfected and immunoprecipitated from HEK293 cells. EV was used as a control. coIP of co-chaperones were examined by immunoblot. (E) Full-length Hsp90α-FLAG or Hsp90 without the catalytic loop (ΔCAT) was expressed and immunoprecipitated from HEK293 cells. coIP of clients and co-chaperones was evaluated by immunoblot. EV was used as a control. (F) Structure of a single Hsp90β protomer (PDB: 5FWK) with the catalytic residues colored as follows: red, N396; orange, I397; yellow, S398; green, R399; blue, E400; purple, M401; pink, L402; black, Q403. Structures were rendered using Chimera v.1.12 (UCSF). (G) Heatmap representation of Hsp90α-FLAG catalytic point mutant interaction with co-chaperones. See also Figure S2.
Figure 2.
Figure 2.. Architecture of FNIP2 co-chaperone association with Hsp90
(A) Schematic of FNIP1 and Tsc1 carboxy-domains (FNIP1-D, Tsc1-D) binding to the middle domain of Hsp90. (B) Domains of FNIP2-HA were transiently expressed in HEK293 cells and isolated by IP. Endogenous Hsp90 coIP was evaluated by immunoblot. EV was used as a control. The ratio of Hsp90-coIP:FNIP2-IP was determined by densitometry. (C) Hsp90-binding domain of FNIP2 was divided into smaller fragments, which were subsequently expressed and isolated from HEK293 cells. coIP of endogenous Hsp90 was examined by immunoblot. EV was used as a control. (D) Hsp90α-FLAG domains were co-transfected in HEK293 cells with FNIP2-AB-HA. Hsp90α domains were isolated, and coIP of FNIP2-AB-HA was examined by immunoblot. EV was used as a control. (E) FNIP1-D-HA and FNIP1-D-FLAG were co-expressed in HEK293 cells. FNIP1-D-FLAG was isolated by IP. coIP of FNIP1-D-HA was examined by immunoblot. FNIP1-D-HA transfection without FNIP1-D-FLAG was used as a control. (F) FNIP1-D-FLAG and FNIP2-AB-HA were co-expressed in HEK293 cells. FNIP1-D-FLAG was immunoprecipitated, and coIP of FNIP2-AB-HA was evaluated by immunoblot. FNIP2-AB-HA expressed alone was used as a control. (G) Schematic representation of FNIP1-carboxy-domain and FNIP2-amino-domain binding to Hsp90-MD or Hsp90-MD and -CTD, respectively. (H) Tsc1-D-FLAG was transfected alone or with FNIP1-D-HA in HEK293 cells. coIP of Tsc1-D-FLAG with FNIP1-D-HA was examined by immunoblot.
Figure 3.
Figure 3.. Differential regulation of client protein activity by FNIPs and Tsc1 co-chaperones
(A) GAL1-v-SRC was transformed into yeast cells with human Hsp90α, containing different combinations of FNIP1-myc, FNIP1-FLAG, FNIP2-myc, FNIP2-FLAG, Tsc1-myc, or Tsc1-FLAG. Empty vector (EV) was used as a control. Cells were grown on glucose (−) or galactose (+) media. v-Src activity was examined by immunoblotting for total phosphotyrosine. v-Src, Hsp90α, and co-chaperone expression was determined by immunoblotting. v-Src activity was quantified by densitometry of total phosphotyrosine from samples grown on galactose (+) media. Tukey’s multiple comparisons test was performed to assess statistical significance (****p < 0.0005). (B) RLM1-LacZ activity was measured in yeast expressing human Hsp90α and containing different combinations of FNIP1-myc, FNIP1-FLAG, FNIP2-myc, FNIP2-FLAG, Tsc1-myc, or Tsc1-FLAG. Empty vector (EV) was used as a control. Cells were grown to mid-log phase and stressed with 8 mM caffeine for 4 h. Data are presented as mean ± standard deviation derived from three independent experiments. Tukey’s multiple comparisons test was performed to assess statistical significance (****p < 0.0005). Hsp90α and co-chaperone expression was determined by immunoblotting. (C) HSE-LacZ was transformed into yeast cells with human Hsp90α and containing different combinations of FNIP1-myc, FNIP1-FLAG, FNIP2-myc, FNIP2-FLAG, Tsc1-myc, or Tsc1-FLAG. Empty vector (EV) was used as a control. Cells were heat shocked at 39°C for 40 min, and heat-shock response was measured in three independent experiments. All data represent mean ± standard deviation (SD). Tukey’s multiple comparisons test was performed to assess statistical significance (****p < 0.0005). Hsp90α and co-chaperone expression was determined by immunoblotting. (D) Percentage of client activity (Figures 3A–3C) represented as a heatmap.
Figure 4.
Figure 4.. FNIPs and Tsc1 co-chaperones enhance the activity and ligand binding of steroid hormone receptors
(A) GR activity was measured in yeast expressing human Hsp90α and containing different combinations of FNIP1-myc, FNIP1-FLAG, FNIP2-myc, FNIP2-FLAG, Tsc1-myc, or Tsc1-FLAG. Empty vector (EV) was used as a control. Cells were grown to mid-log phase followed by the addition of 30 μM dexamethasone final concentration. Data are presented as mean ± standard deviation derived from three independent experiments. Tukey’s multiple comparisons test was performed to assess statistical significance (****p < 0.0005). Hsp90α and co-chaperone expression was determined by immunoblotting. (B) AR activity was measured as above, using 20 nM DHT as ligand in place of dexamethasone. (C) ER activity was measured as above, with the exception of 200 nM β-estradiol that was used in place of dexamethasone. (D) Percentage of SHR activity (Figures 4A–4C) represented as a heatmap. (E) Lysates from yeast expressing human GR and Hsp90α and containing different combinations of FNIP1-myc, FNIP1-FLAG, FNIP2-myc, FNIP2-FLAG, Tsc1-myc, or Tsc1-FLAG were collected and incubated with biotinylated dexamethasone. Streptavidin-coated agarose beads were used to isolate the fraction of GR bound to the biotinylated dexamethasone. Relative GR affinity for ligand was determined by immunoblotting. Empty vector (EV) was used as a control. See also Figure S4. (F) Lysates from yeast expressing human ERα and Hsp90α and containing different combinations of FNIP1-myc, FNIP1-FLAG, FNIP2-myc, FNIP2-FLAG, Tsc1-myc, or Tsc1-FLAG were collected and incubated with biotinylated β-estradiol. Streptavidin-coated agarose beads were used to isolate the fraction of ERα bound to the biotinylated β-estradiol. Relative ERα affinity for ligand was determined by immunoblotting. Empty vector (EV) was used as a control. See also Figure S4. (G) Percentage of SHR bound to ligand (Figures 4E and 4F) at the lowest ligand concentration (0.1 μM dexamethasone-biotin, 10 nM β-estradiol-biotin) represented as a heatmap.
Figure 5.
Figure 5.. Hsp90 induces conformational alterations in glucocorticoid receptor ligand-binding domain
(A) Schematic representation of GR domains. (B) GR-FLAG-WT and -domains were co-expressed with FNIP1-HA. GR domains were isolated by FLAG IP. coIP of FNIP1-HA was assessed by immunoblot. GAPDH was used as a loading control. (C) GR-FLAG-WT and -domains were co-expressed with FNIP2-HA. GR domains were isolated by FLAG IP. coIP of FNIP2-HA was determined by immunoblot. GAPDH was used as a loading control. (D) GR-FLAG-WT and -domains were co-expressed with Tsc1-HA. GR domains were isolated by FLAG IP. coIP of Tsc1-HA was assessed by immunoblot. GAPDH was used as a loading control. (E) Ribbon structure of GR LBD bound to dexamethasone (PDB: 4UDC). Helices important for positioning the ligand entry/exit pore (α-helix-3, -7, -11, and -12) are colored blue. Residues that make contact with dexamethasone (Q570, N564, T739) are colored orange. Dexamethasone is colored green. (F) Ribbon structure of GR LBD bound to dexamethasone (PDB: 4UDC) with peptides identified by LiP highlighted. Red, peptides 701–712; blue, peptides 641–648; purple, peptides 746–759. Structures were rendered using Chimera v.1.14 (UCSF).
Figure 6.
Figure 6.. Hsp90:co-chaperone complexes regulate GR response to ligand
Schematic model of the cellular pool of Hsp90:co-chaperone complexes. Hsp90 exists in complex with different combinations of co-chaperones, which aid in scaffolding of clients such as GR to Hsp90. When cellular concentrations of ligand are low, only the co-chaperone complexes that promote the highest ligand-affinity client conformation allow ligand binding and subsequent activity. When excesses ligand is present, all Hsp90:co-chaperone complexes promote GR ligand binding and activity. Hsp90 is depicted as blue ovals, co-chaperones are depicted as colored rectangles (red, FNIP1; yellow, FNIP2; blue, Tsc1), GR is shown as a purple circle, and dexamethasone is depicted as white stars.

Similar articles

Cited by

References

    1. Abdou NI, Rider V, Greenwell C, Li X, and Kimler BF (2008). Fulvestrant (Faslodex), an estrogen selective receptor downregulator, in therapy of women with systemic lupus erythematosus. clinical, serologic, bone density, and T cell activation marker studies: a double-blind placebo-controlled trial. J. Rheumatol 35, 797. - PubMed
    1. Adams A, Gottschling DE, Kaiser CA, and Stearns T. (1997). Methods in Yeast Genetics (Cold Spring Harbor Laboratory Press; ).
    1. Ali MMU, Roe SM, Vaughan CK, Meyer P, Panaretou B, Piper PW, Prodromou C, and Pearl LH (2006). Crystal structure of an Hsp90-nucleotide-p23/Sba1 closed chaperone complex. Nature 440, 1013–1017. 10.1038/nature04716.. - DOI - PMC - PubMed
    1. Astrinidis A, Senapedis W, Coleman TR, and Henske EP (2003). Cell cycle-regulated phosphorylation of hamartin, the product of the tuberous sclerosis complex 1 gene, by cyclin-dependent kinase 1/cyclin B. J. Biol. Chem 278, 51372–51379. 10.1074/jbc.M303956200. - DOI - PubMed
    1. Baba M, Hong SB, Sharma N, Warren MB, Nickerson ML, Iwamatsu A, Esposito D, Gillette WK, Hopkins RF 3rd, Hartley JL, et al. (2006). Folliculin encoded by the BHD gene interacts with a binding protein, FNIP1, and AMPK, and is involved in AMPK and mTOR signaling. Proc. Natl. Acad. Sci. USA 103, 15552–15557. 10.1073/pnas.0603781103. - DOI - PMC - PubMed

Publication types

LinkOut - more resources