. 2022 Jul 12;40(2):111073.
doi: 10.1016/j.celrep.2022.111073.

Mislocalization of protein kinase A drives pathology in Cushing's syndrome

Affiliations

Mislocalization of protein kinase A drives pathology in Cushing's syndrome

Mitchell H Omar et al. Cell Rep. .

Abstract

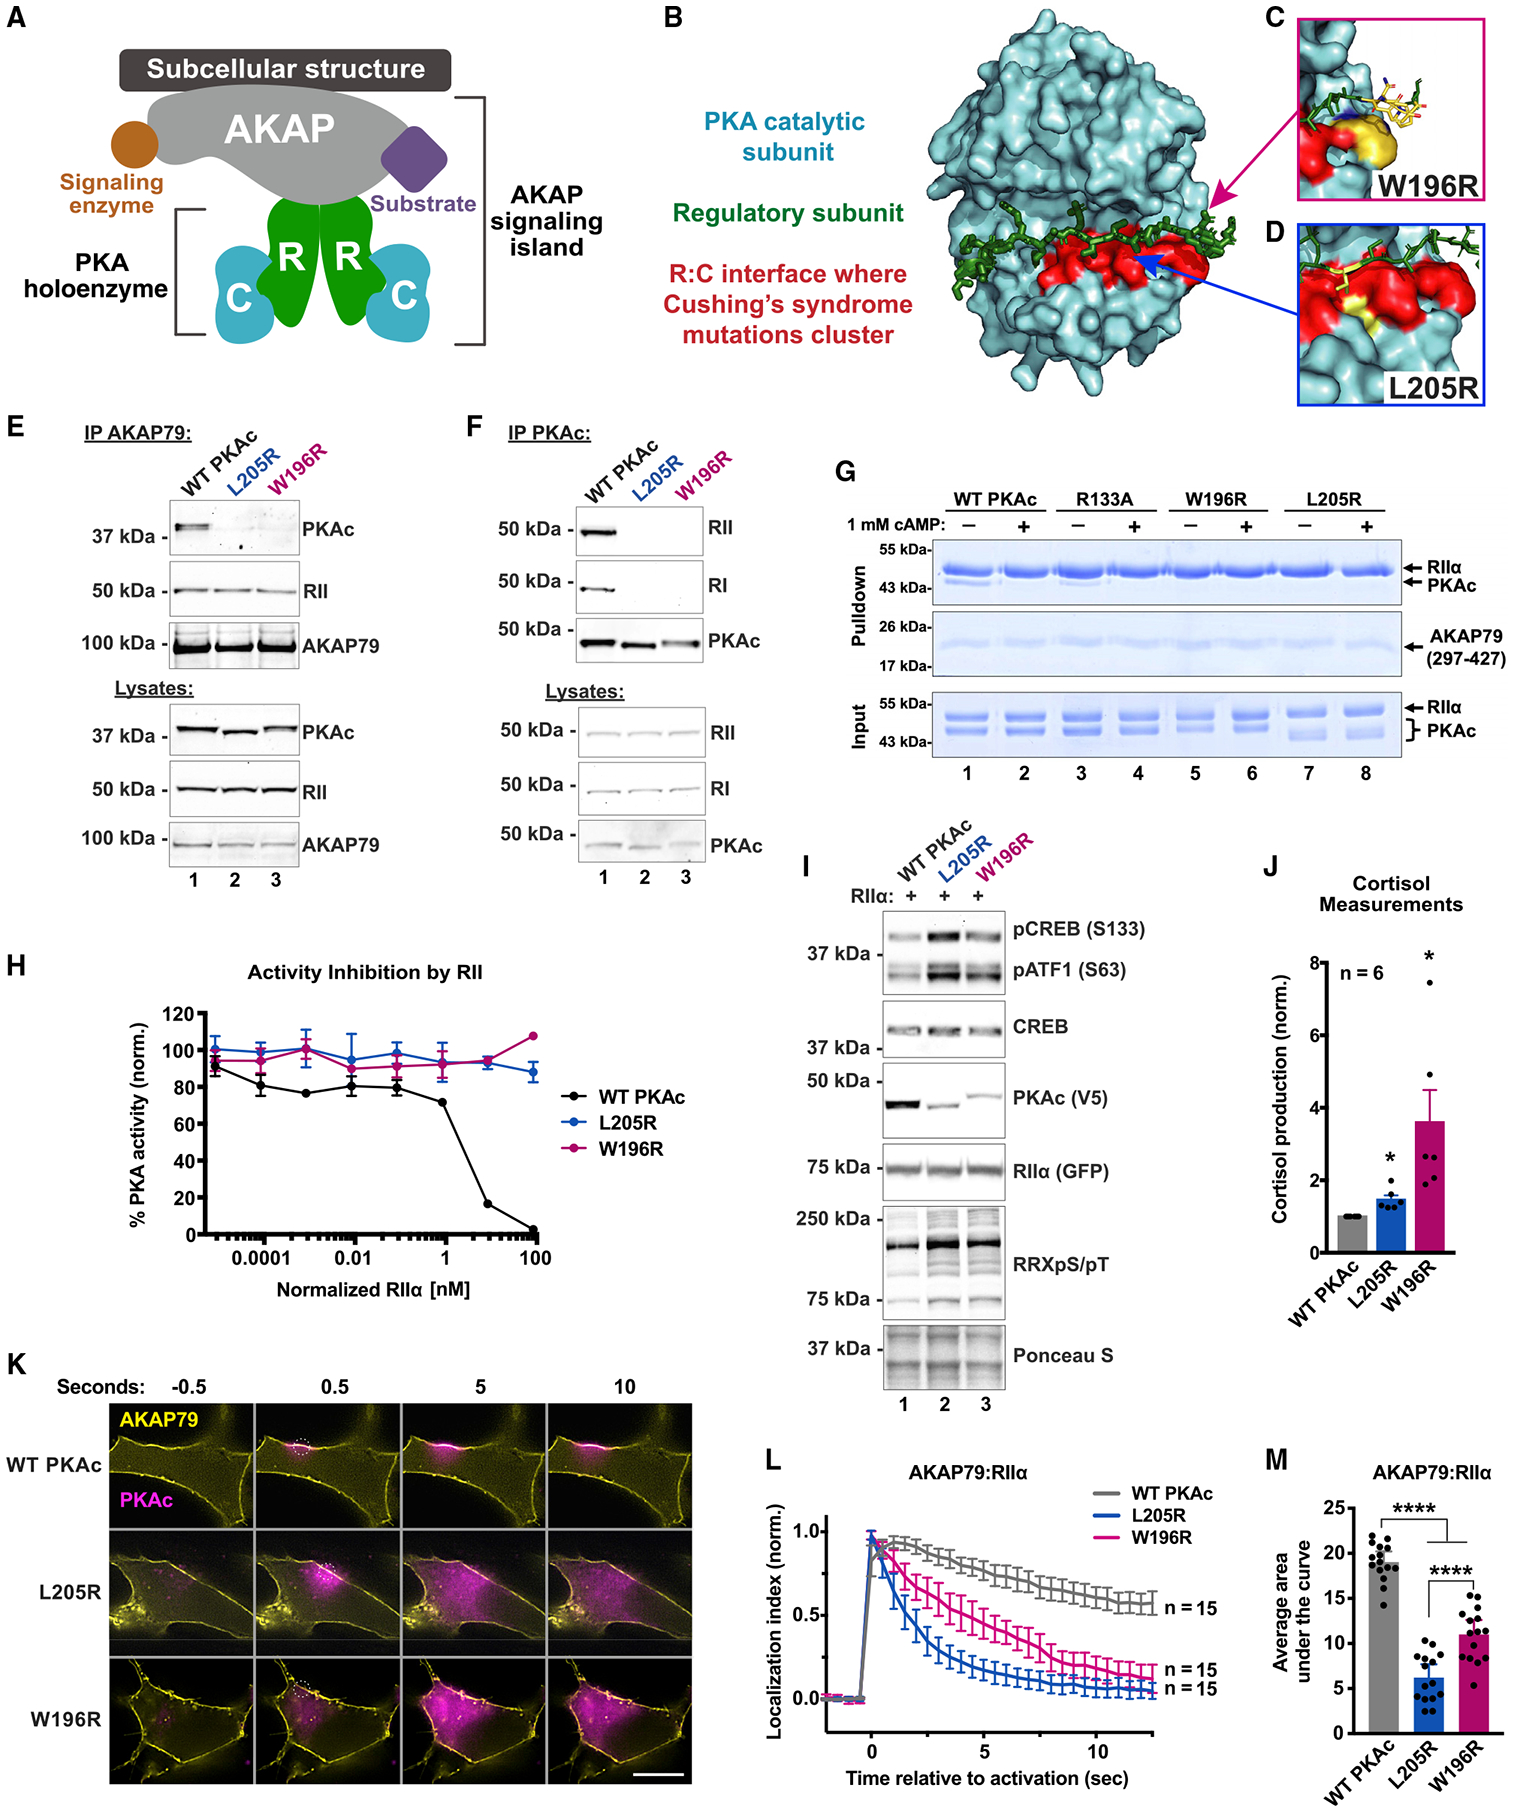
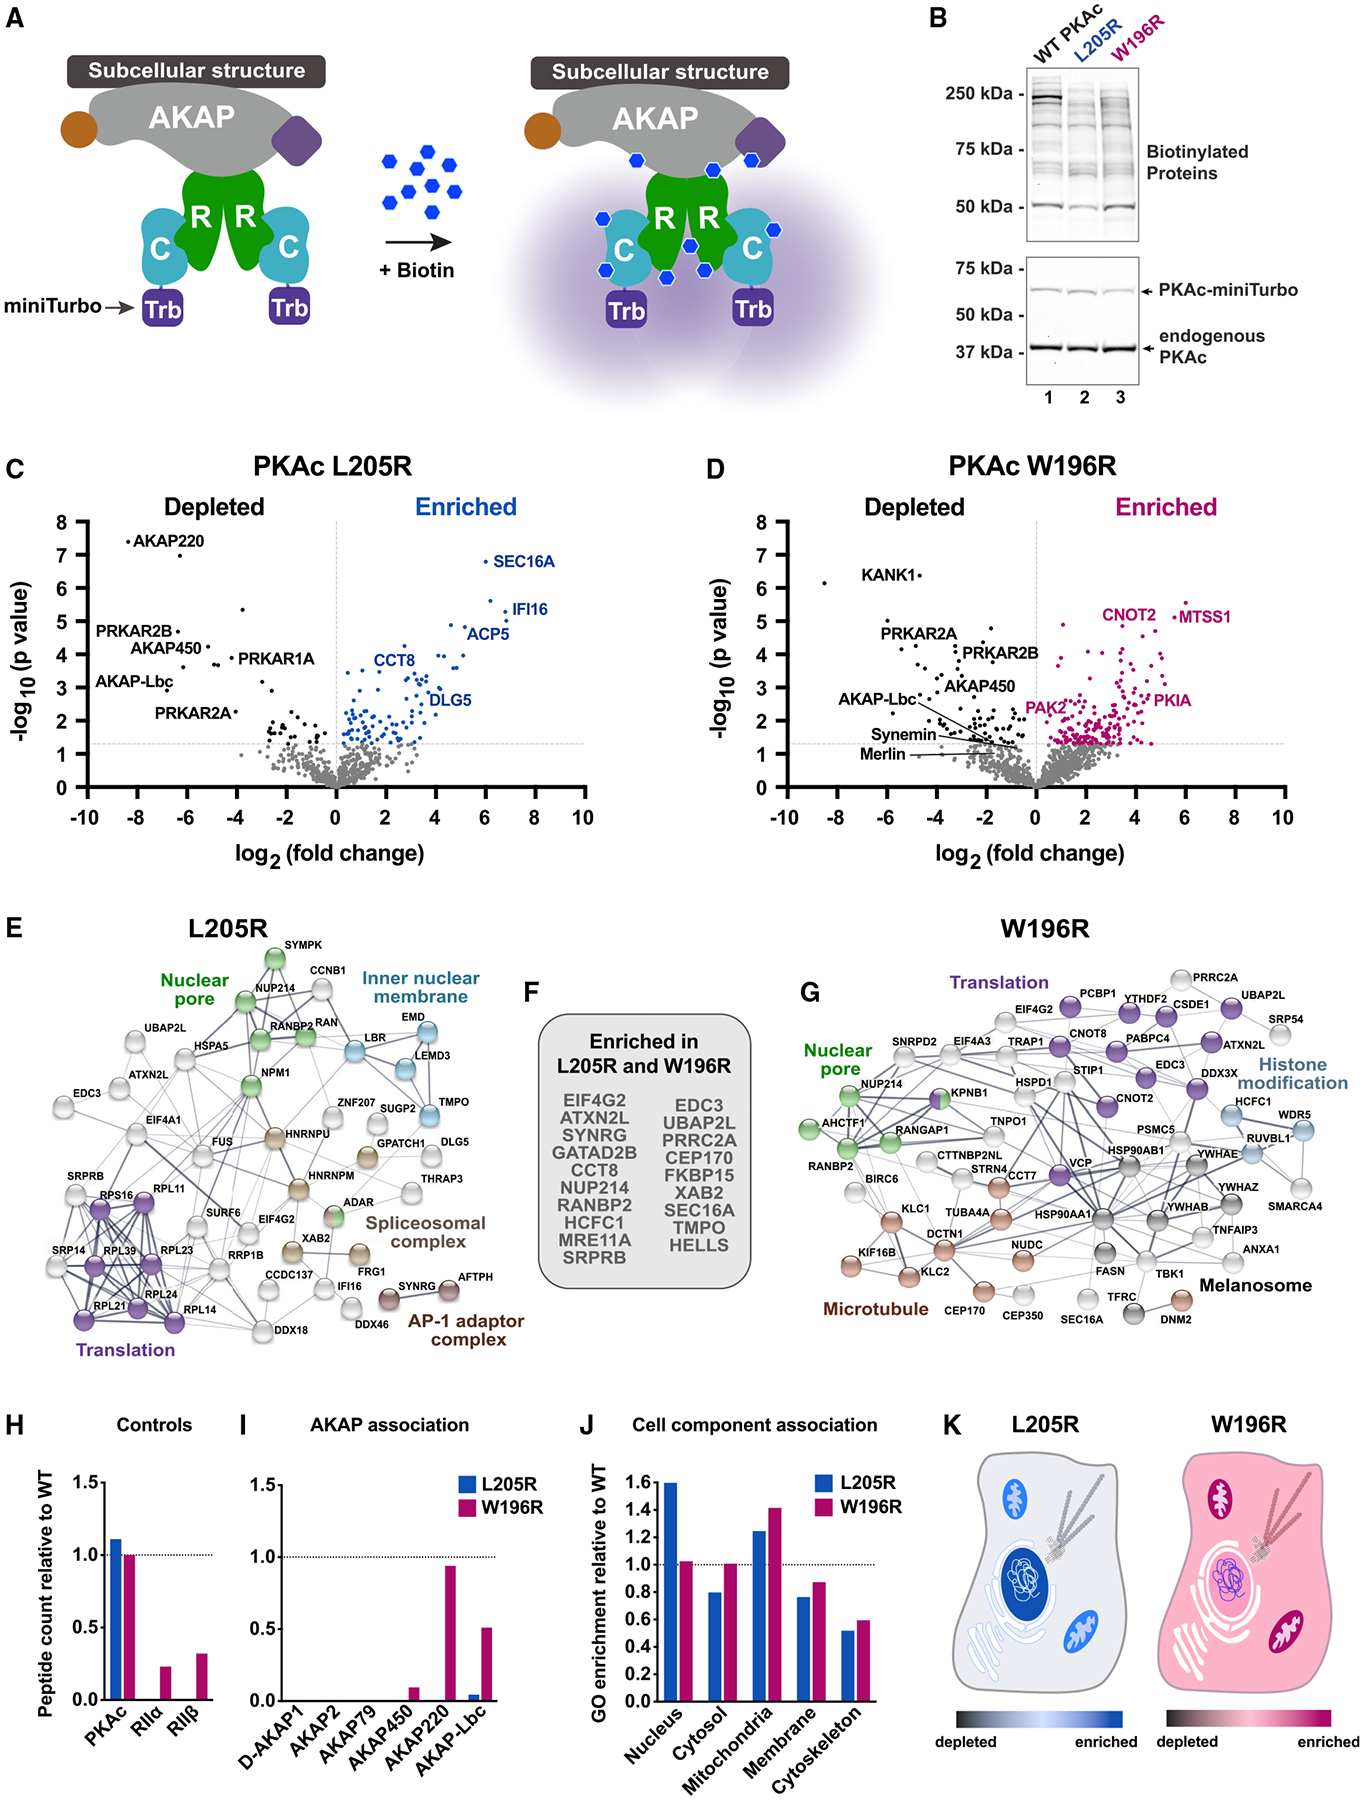
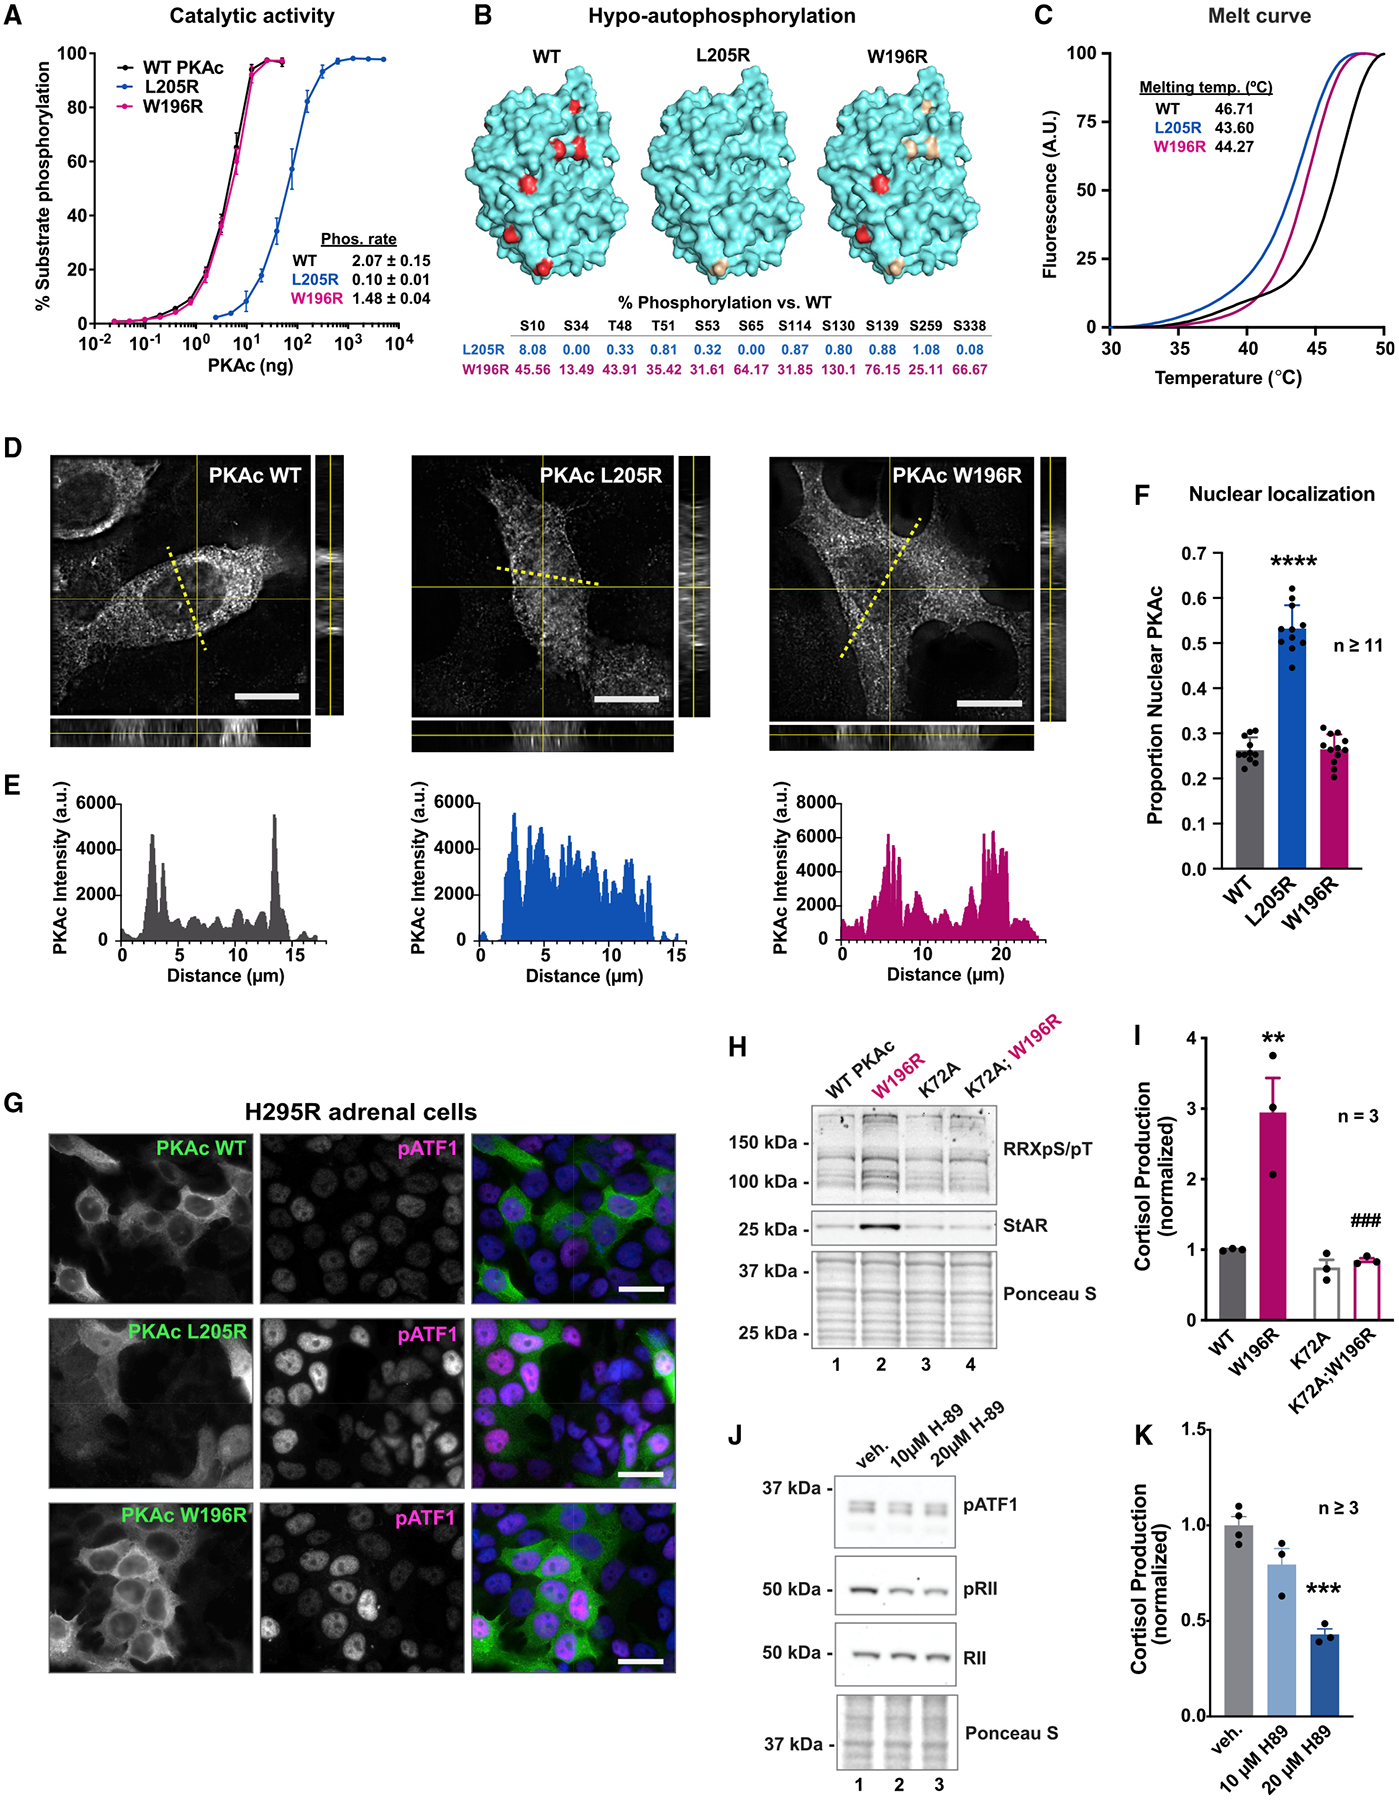
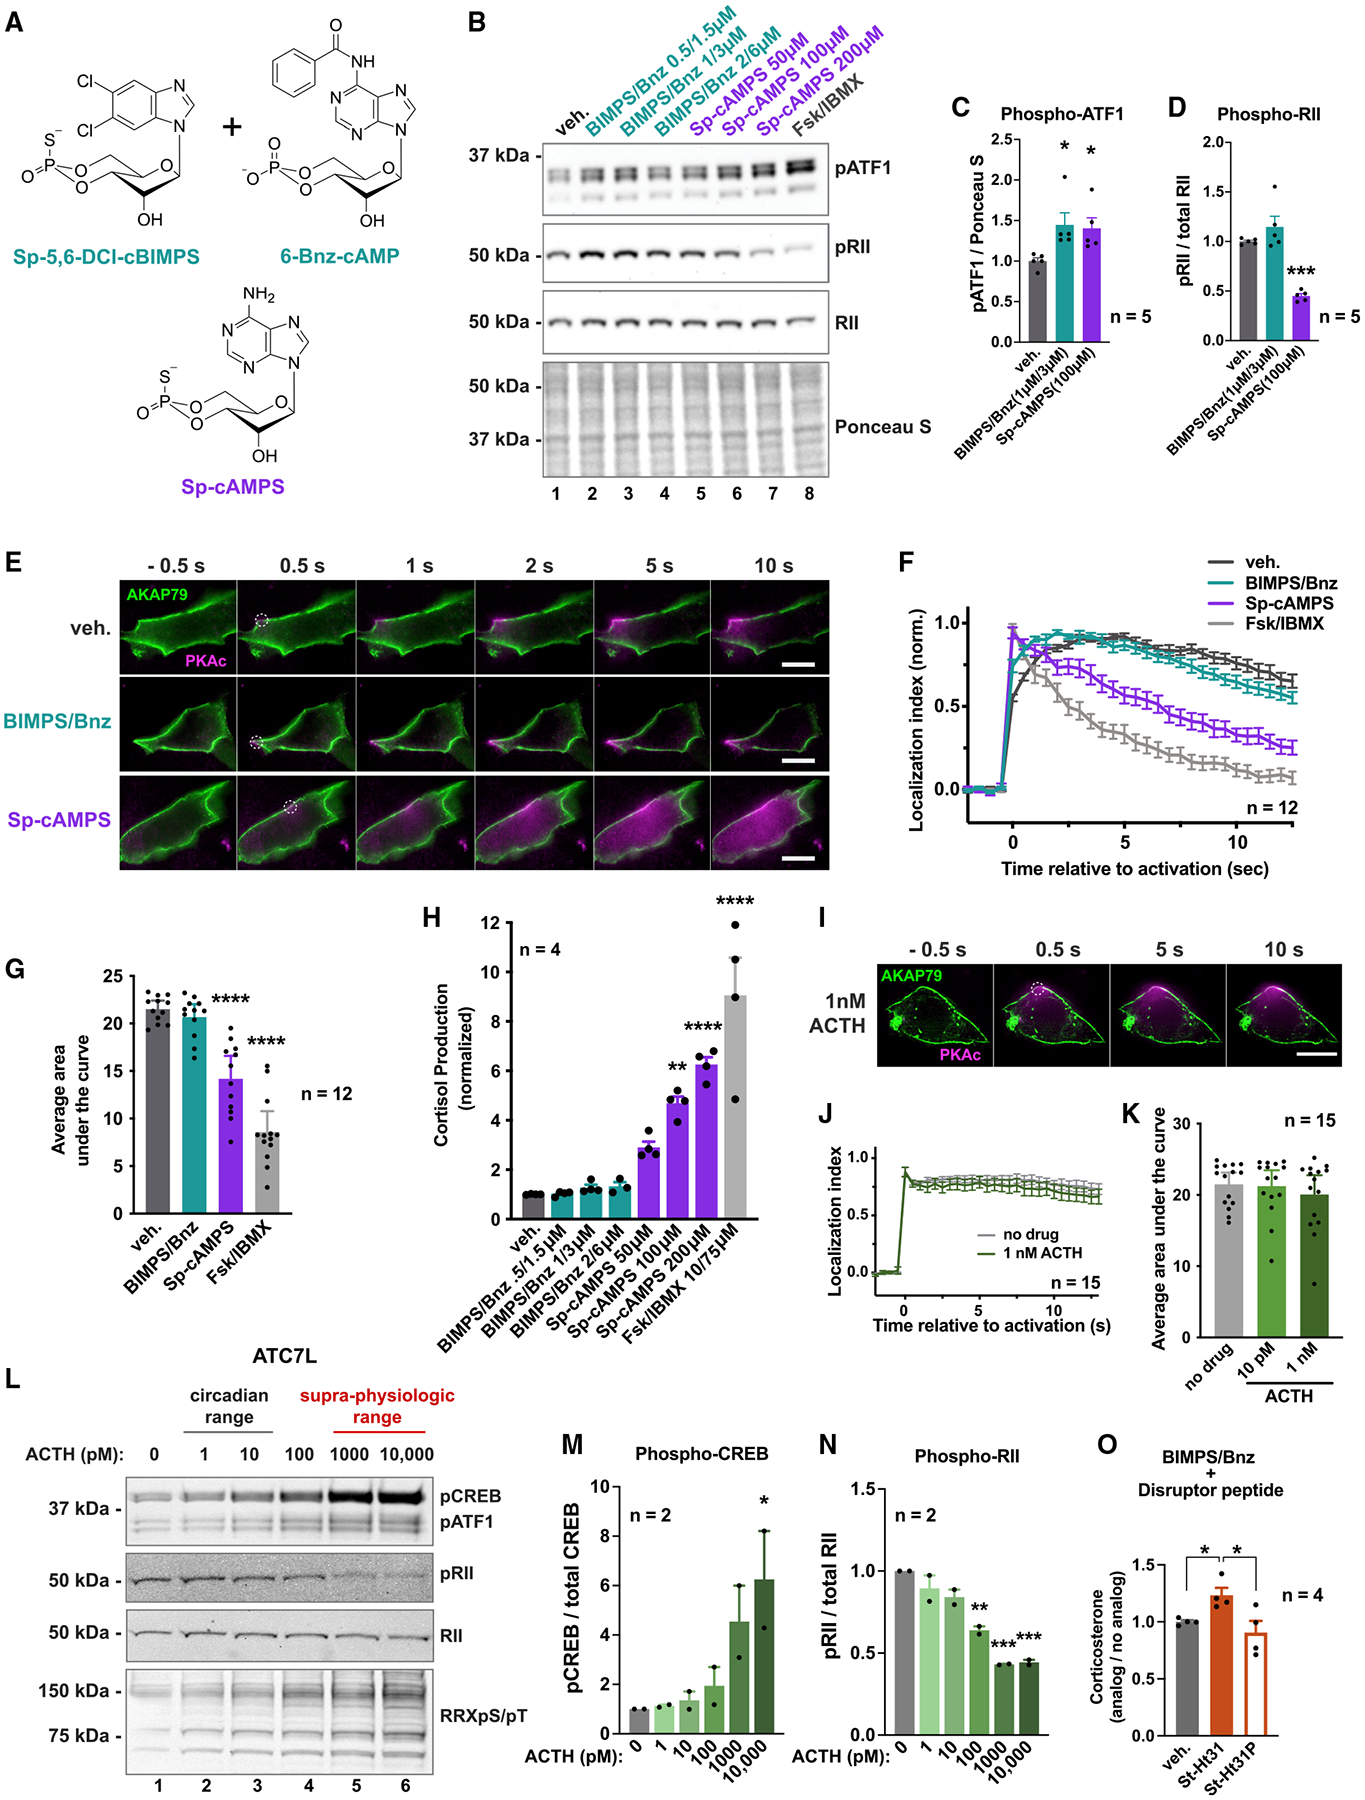
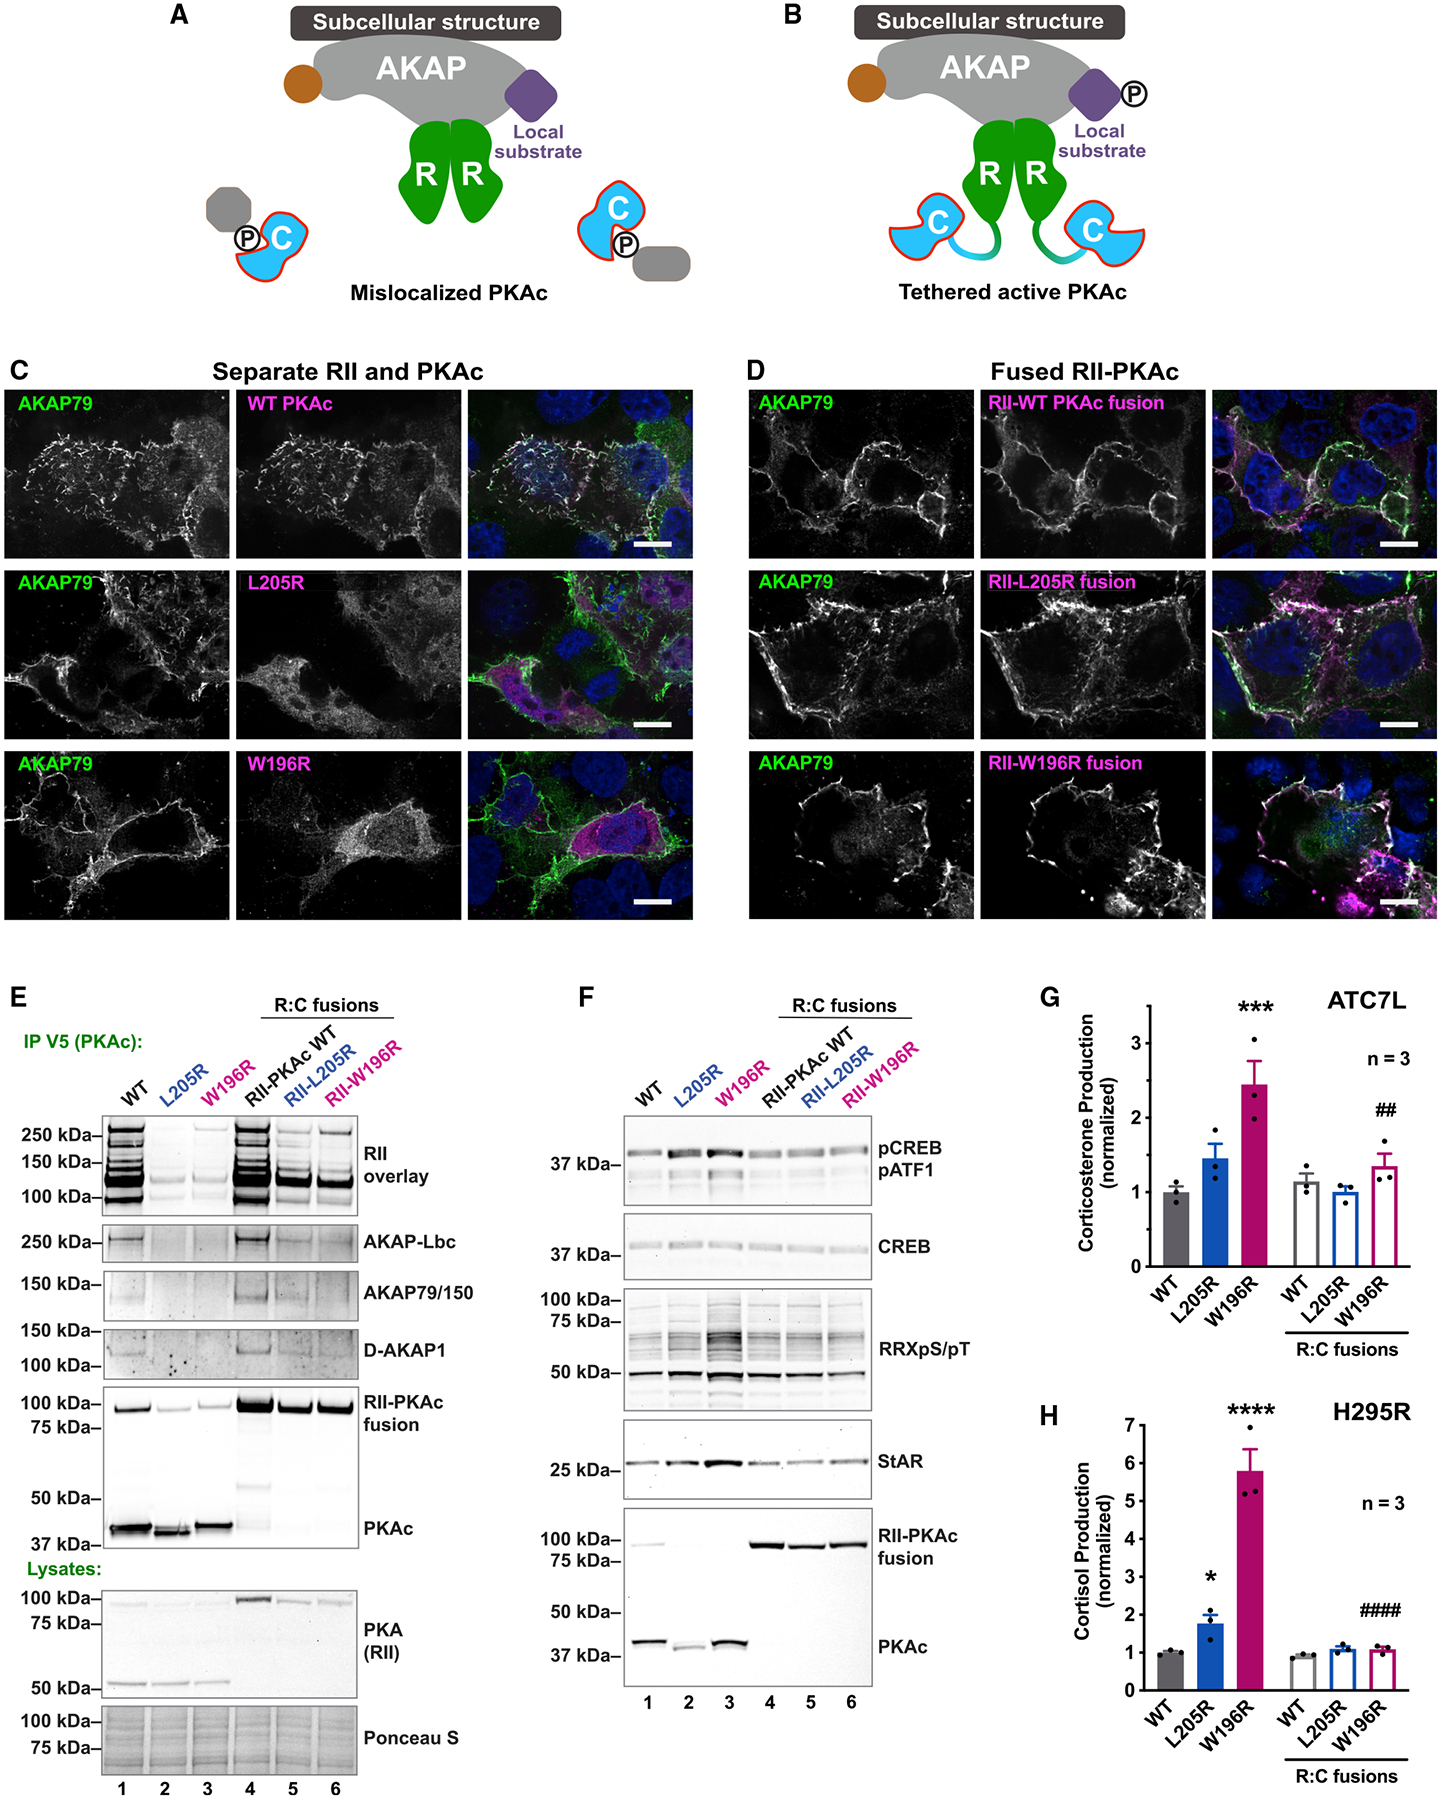
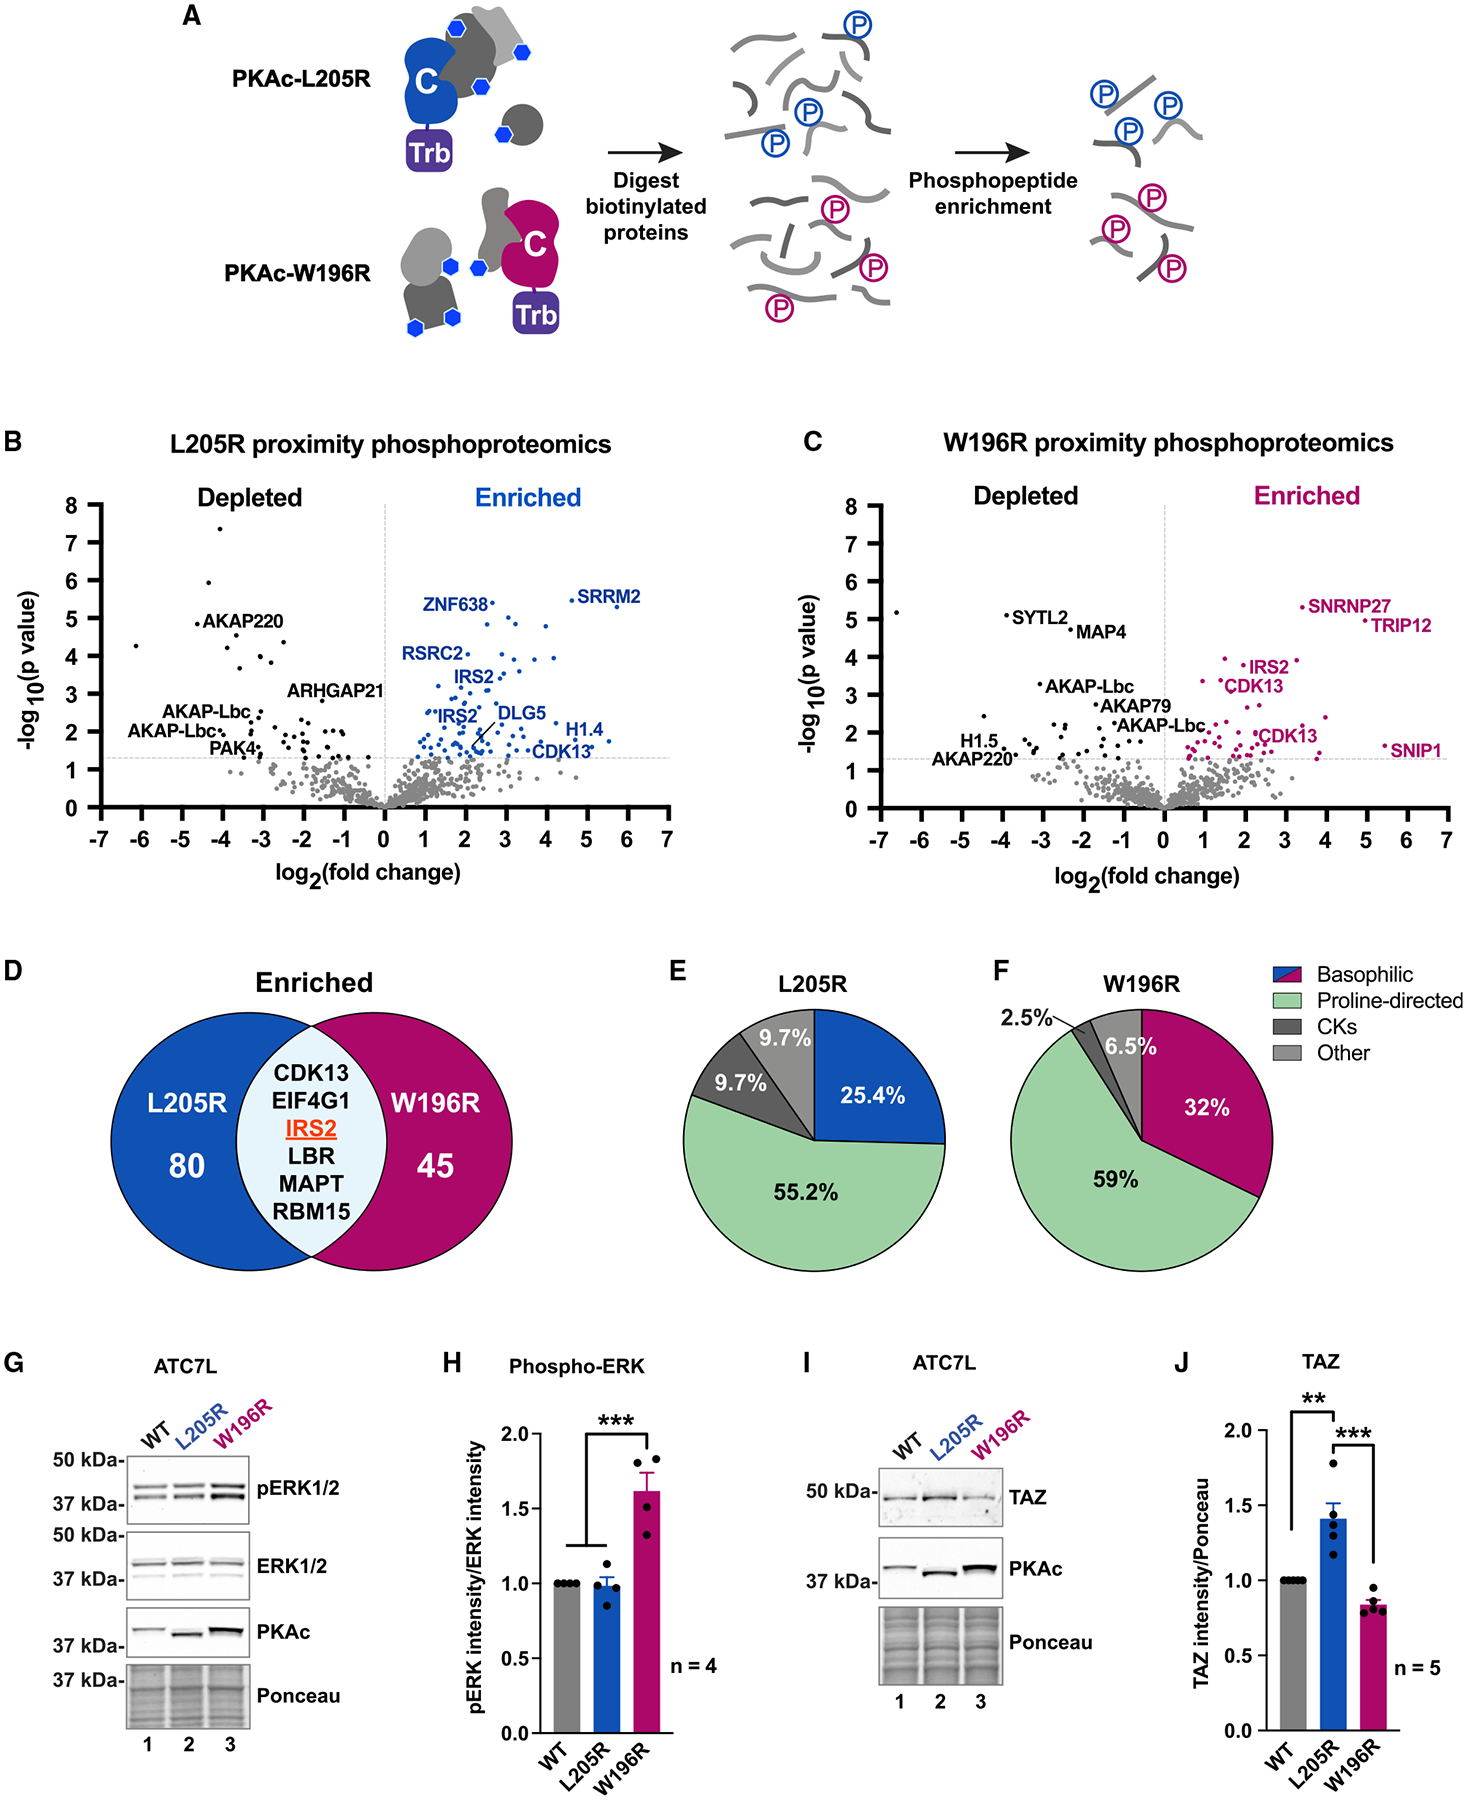
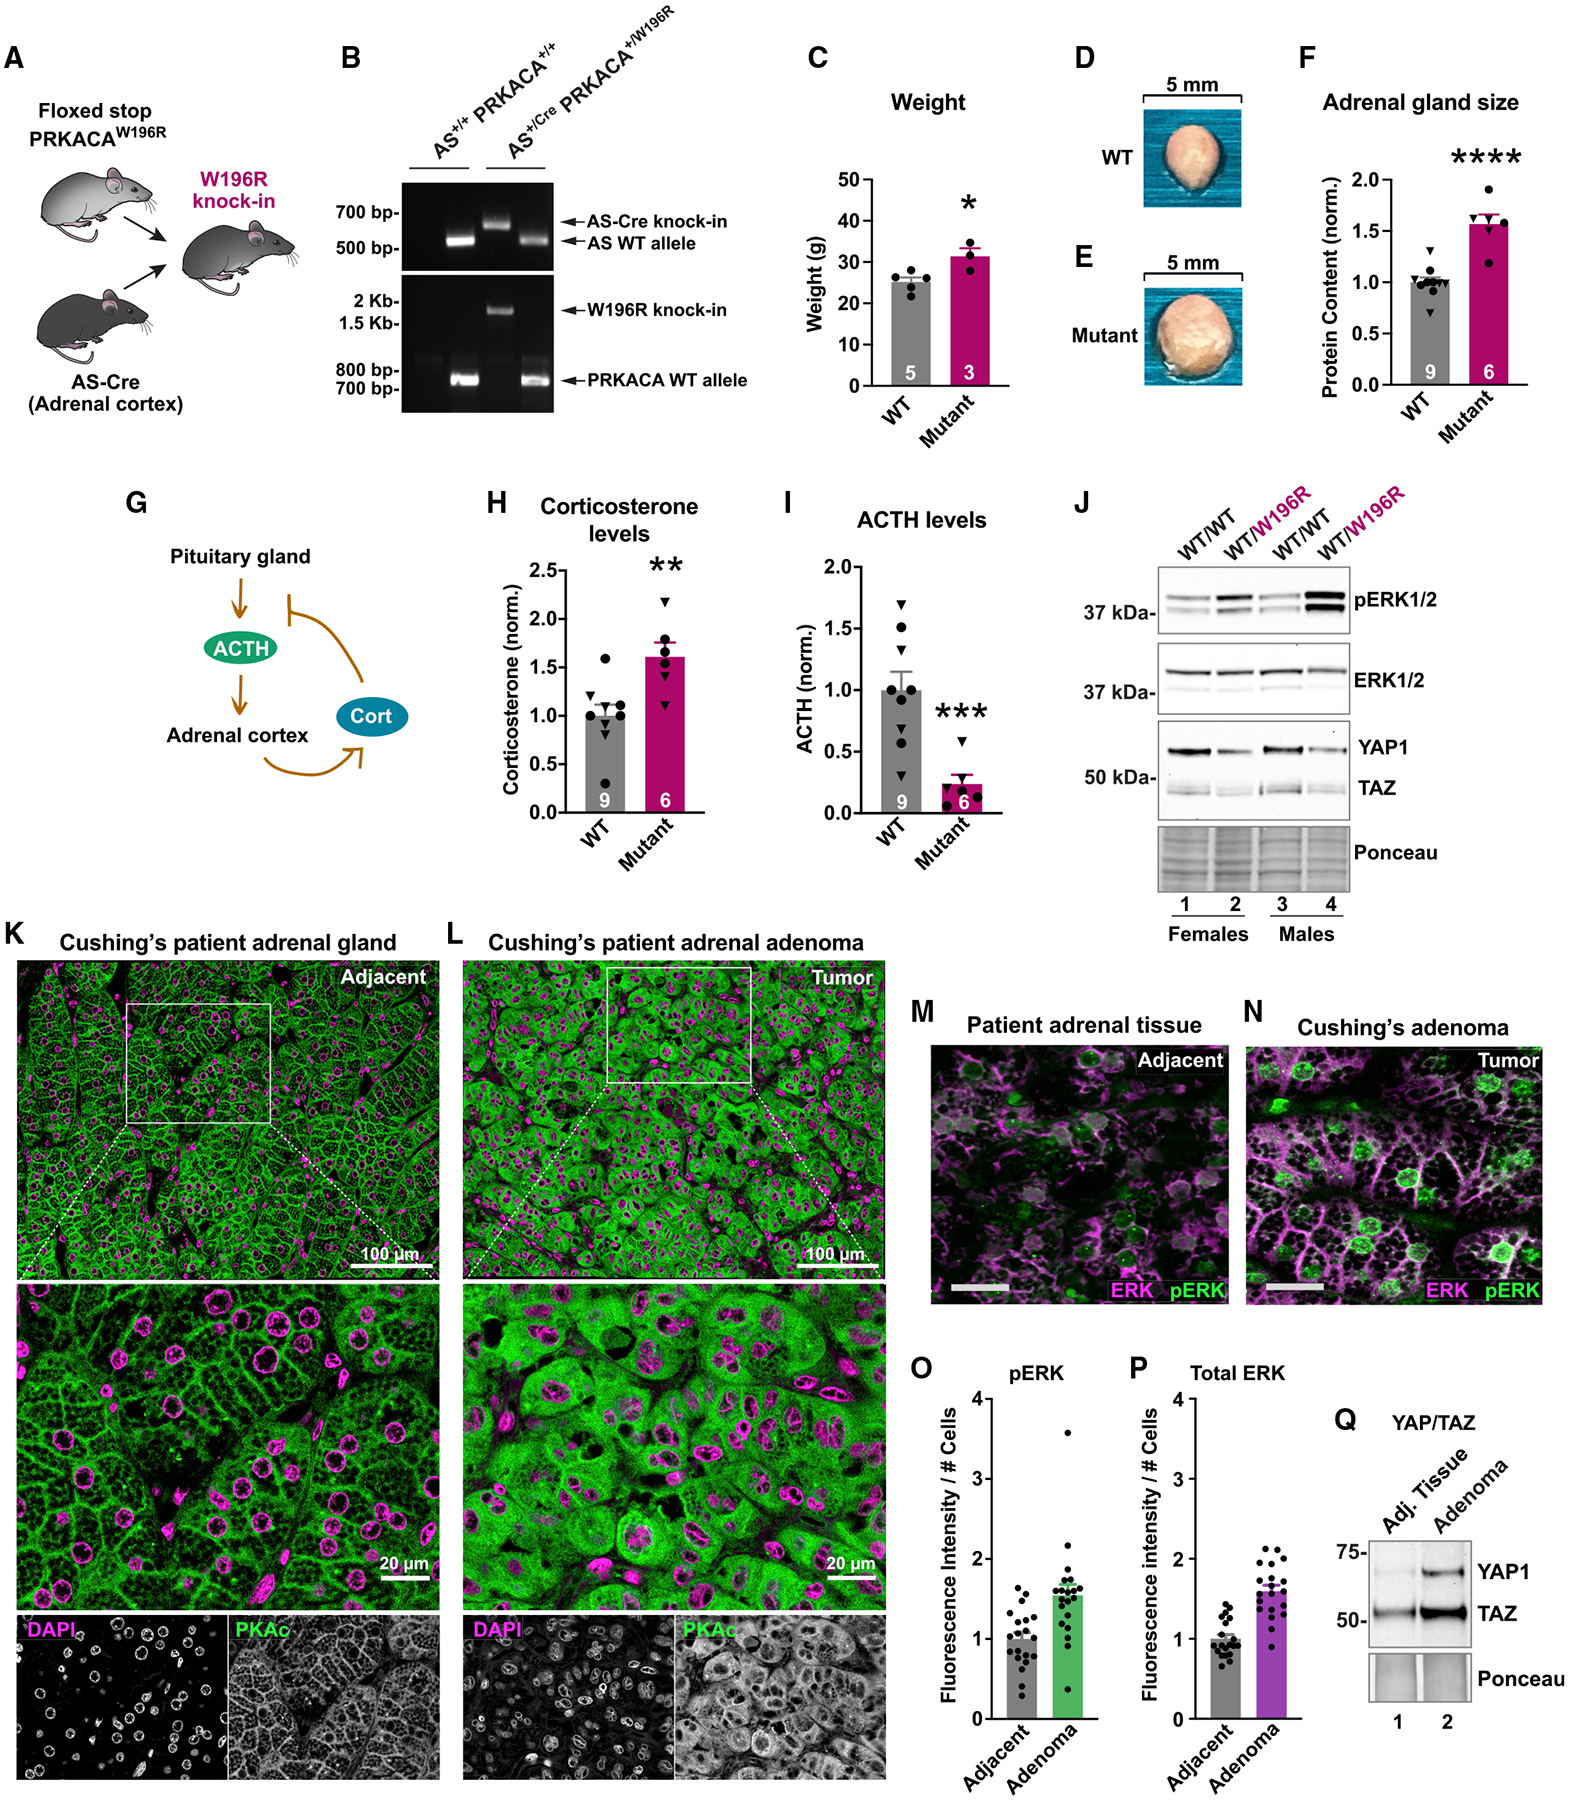
Mutations in the catalytic subunit of protein kinase A (PKAc) drive the stress hormone disorder adrenal Cushing's syndrome. We define mechanisms of action for the PKAc-L205R and W196R variants. Proximity proteomic techniques demonstrate that both Cushing's mutants are excluded from A kinase-anchoring protein (AKAP)-signaling islands, whereas live-cell photoactivation microscopy reveals that these kinase mutants indiscriminately diffuse throughout the cell. Only cAMP analog drugs that displace native PKAc from AKAPs enhance cortisol release. Rescue experiments that incorporate PKAc mutants into AKAP complexes abolish cortisol overproduction, indicating that kinase anchoring restores normal endocrine function. Analyses of adrenal-specific PKAc-W196R knockin mice and Cushing's syndrome patient tissue reveal defective signaling mechanisms of the disease. Surprisingly each Cushing's mutant engages a different mitogenic-signaling pathway, with upregulation of YAP/TAZ by PKAc-L205R and ERK kinase activation by PKAc-W196R. Thus, aberrant spatiotemporal regulation of each Cushing's variant promotes the transmission of distinct downstream pathogenic signals.

Keywords: CP: Cell biology; CP: Metabolism; PRKACA; adrenal; anchoring; cortisol; photoactivation; proteomics; proximity biotinylation; scaffold; signaling; stress hormone.


Conflict of interest statement

Declaration of interests The authors declare no competing interests.

Figures

Figure 1.
Figure 1.. Cushing’s mutants are excluded from AKAP signaling islands
(A) Model of AKAP signaling island. Regulatory subunits, R; catalytic subunits, C. (B) Structure of PKAc bound to the inhibitory region of RIIβ (green). The W196R (C) and L205R (D) mutations fall within the red region. (E) Immunoprecipitation of AKAP79 from H295R adrenal cells. (F) Immunoprecipitation of PKAc from H295R cells. (G) AKAP79 (297–427)-PKA complex formation in vitro ± cAMP. (H) Changes in PKA-dependent phosphorylation of a fluorescently labeled peptide substrate upon increasing concentrations of RIIα. Mean ± SD; n = 4. (I) Immunoblots of CRISPR PKAcα−/− U2OS cells expressing RII-GFP with either WT or mutant PKAc-V5. Mean ± 95% CI. (J) Cortisol measurements from H295R cells infected with PKAc variants. Mean ± SE. *p ≤ 0.05, Student’s t tests after one-way ANOVA; n = 6. (K) Photoactivation time courses in H295R cells. AKAP79-YFP, RII-iRFP, and PKAc tagged with photoactivatable mCherry were expressed. Scale bar, 10 μm. (L) Quantitation of (K). Three experimental replicates. (M) Integration of (L). Mean ± SE. ****p ≤ 0.0001, one-way ANOVA with Dunnett’s correction. See also Figure S1.
Figure 2.
Figure 2.. Proximity proteomics identify distinct associations among PKAc variants
(A) Model of PKAc tagged with miniTurbo biotin ligase at an AKAP signaling island. Upon application of biotin, proteins in proximity (5–10 nm) to PKAc are biotinylated. (B) Immunoblots of lysates from stable H295R lines after proximity biotinylation. Neutravidin-HRP signal (top) shows banding differences among conditions. PKAc signal (bottom) shows expression of tagged kinase at low levels versus endogenous PKAc. (C and D) Volcano plots of proximity proteomics. Black, proteins underrepresented versus WT. Blue (L205R) and Red (W196R), proteins enriched in the mutant conditions. Gray, proteins with a corrected p value lower than 0.05. Four biological replicates. (E–G) STRING network depictions of selected enriched proteins in L205R (E) and W196R (G). Between is a list (F) of proteins identified as enriched in both mutant conditions. (H) Quantitation of association with PKA holoenzyme components. (I) Association with AKAPs as determined by peptides identified versus WT condition. (J) Gene ontology enrichment scores for cell component relative to WT. (K and L) Graphical depictions of (J). See also Figure S2.
Figure 3.
Figure 3.. Cushing’s mutants exhibit distinct physiochemical profiles
(A) Catalytic activity of recombinant WT and mutant PKAc toward a peptide substrate. Data are %substrate phosphorylation (mean ± SD) after 5 min; n = 4. Relative rates were determined per ng of enzyme as pmol phosphate incorporation per min. Calculated from assays containing 0.8 ng WT and W196R PKAc and 19.5 ng L205R at linear rates of phosphorylation. (B) Structural depictions and quantification of relative abundance of phosphorylated sites compared with WT PKAc as measured by mass spectrometry. Red ≥66.7% WT levels. Gold, 1–66.6% WT levels; n = 3. (C) Normalized thermal melt curves for WT and mutant PKAc. (D) Orthogonal depictions of PKAc immunofluorescence in H295R cells. Side, zy planes; bottom, zx planes; scale bar, 10 μm. (E) Line plots of PKAc signals in (D) as indicated by yellow dotted lines. (F) Quantitation of line plots using DAPI signal to define nucleus; n ≥ 11; mean ± SE.****p ≤ 0.0001, one-way ANOVA with Dunnett’s correction. (G) H295R cells expressing V5-tagged PKAc variants were stained for V5 and pATF1. Scale bar, 20 μm. (H) Immunoblot of H295R lysates infected with PKAc variants as listed. Represents three replicate experiments. (I) Cortisol measurements from H295R cells. Kinase activity is necessary for the mutant’s effect on cortisol production. Mean ± SE. **p ≤ 0.01 versus WT and ###p ≤ 0.001 versus W196R; one-way ANOVA with Sidak correction; n = 3. (J) Immunoblot of H295R lysates after 1-h incubation with vehicle or H89. Represents three experimental replicates. (K) Cortisol measurements from H295R cells after 1-h vehicle or H89. Mean ± SE. ***p ≤ 0.001, one-way ANOVA with Sidak correction. See also Figure S3.
Figure 4.
Figure 4.. PKA activation is not sufficient for stress hormone overproduction
(A) cAMP analogs used. (B) Immunoblot of H295R lysates after 1 h with vehicle or increasing concentrations of PKA-activating drugs. (C and D) Quantification of phospho-ATF1 signal normalized to total protein (C) and phospho-RIIβ signal divided by total RIIβ (D). Teal, 1 μM Sp-5,6-DCl-cBIMPS + μM 6-Bnz-cAMP. Purple, 100 μM Sp-cAMPS. Mean ± SE. *p < 0.05, one-way ANOVA with Holm-Sidak correction; n = 5. (E) Photoactivation time course of H295R cells expressing AKAP79-YFP, RII-iRFP, and WT PKAc tagged with photoactivatable mCherry. Top, vehicle only; middle, 1 μM Sp-5,6-DCl-cBIMPS + 3 μM 6-Bnz-cAMP; bottom, 100 μM Sp-cAMPS. Scale bar, 10 μm. (F) Amalgamated photoactivation data from three experimental replicates. Mean ± SE. (G) Integration of values from (F). Mean ± SE. ****p ≤ 0.0001, one-way ANOVA with Dunnett’s correction. (H) Cortisol measurements from H295R cells treated for 1 h with vehicle or increasing concentrations of PKA-activating drugs. Mean ± SE. ***p ≤ 0.001, ****p ≤ 0.0001, one-way ANOVA with Dunnett’s correction; n = 4. (I) Photoactivation time course after exposure to 1 nM ACTH. Scale bar, 10 μm. (J) Photoactivation quantitation of H295R cells with and without ACTH. Data from two experimental replicates. Mean ± SE. (K) Integration of curves from (J). No significant differences by one-way ANOVA. Mean ± SE. (L) Immunoblot of ATC7L cells after 1-h ACTH treatment. (M and N) Quantification of (K). Phospho-CREB signal divided by total CREB (M) and phospho-RIIβ signal divided by total RIIβ (N). Mean ± SE. *p < 0.05, **p ≤ 0.01, ***p ≤ 0.001, one-way ANOVA with Holm-Sidak correction; n = 2 full dosage curves. (O) Two-hour corticosterone production of ATC7L cells with no peptide (gray), stearated Ht31 (25 μM; filled orange) or proline-mutated stearated Ht31 (25 μM; open orange). Quantification normalizes hormone production after 2 μM Sp-5,6-DCl-cBIMPS/6 μM 6-Bnz-cAMP treatment to no analog treatment. Mean ± SE. *p < 0.05, one-way ANOVA with Holm-Sidak correction; n = 4. See also Figure S4.
Figure 5.
Figure 5.. Tethering Cushing’s mutants restores normal stress hormone production
(A) Model of PKAc Cushing’s mutant displaced from AKAPs. (B) Our strategy to tether active kinase mutants to AKAPs by fusing RII with PKAc-L205R or W196R. (C) U2OS cells expressing AKAP79 (green) along with a self-cleaving RII-P2A-PKAc-V5 (PKAc in magenta). Scale bar, 10 μm. (D) Same as (C) but with fused constructs of RII-PKAc (magenta). Scale bar, 10 μm. (E) Western blots evaluating AKAP association after immunoprecipitating P2A (lanes 1–3) or fusion (lanes 4–6) constructs of PKAc. RII overlay detects multiple type II AKAPs. Represents three replicates. (F) Immunoblot of ATC7L lysates. P2A constructs, lanes 1–3; fused RII-PKAc, lanes 4–6. Represents three replicates. (G) Corticosterone measurements from ATC7L cells expressing separate or fused RII and PKAc variants. Mean ± SE. ***p ≤ 0.001 versus WT, ##p ≤ 0.01 versus W196R unfused condition. One-way ANOVA with Sidak correction; n = 3. (H) Cortisol measurements from H295R cells expressing separate or fused RII and PKAc. Mean ± SE. ****p ≤ 0.0001 versus WT, ####p ≤ 0.0001 versus W196R unfused condition. One-way ANOVA with Sidak correction; n = 3. See also Figure S5.
Figure 6.
Figure 6.. Proximity phosphoproteomic analyses reveal disruption of ERK and Hippo signaling
(A) Locally biotinylated proteins are isolated, digested, and subjected to phosphoenrichment. (B and C) Proximity phosphoproteomics of PKAc-miniTurbo-biotinylated H295R samples from L205R (B) and W196R (C) versus WT. Phosphopeptides depleted in the mutant conditions, black; enriched phosphopeptides, blue (L205R) or red (W196R). (D) Venn diagram of significantly enriched phosphopeptides identified in mutant conditions. (E and F) NetworKIN kinase prediction for phosphosites enriched in L205R (E) and W196R (F) conditions. (G) Immunoblot of ATC7L cells expressing PKAc variants. (H) Quantitation of (G). Mean ± SE. ***p ≤ 0.001, one-way ANOVA with Sidak correction; n = 4. (I) Immunoblot of ATC7L cells expressing PKAc variants. (J) Quantitation of (I). Mean ± SE. ***p ≤ 0.001, **p ≤ 0.01, one-way ANOVA with Sidak correction; n = 5. See also Figure S6.
Figure 7.
Figure 7.. In vivo and clinical studies of Cushing’s PKAc mutants
(A) Strategy to make a mouse with adrenal cortex-specific heterozygous expression of PKAc-W196R. (B) Gel of genotyping PCR for littermate males. (C) Weight of 1-year female mutant mice (red; n = 3) compared with littermate controls (gray; n = 5). Mean ± SE. *p ≤ 0.05 by Student’s t test. (D and E) Images of adrenal glands from WT (D) and PKAc-W196R heterozygotes (E). (F) Adrenal gland lysate protein concentration from male (triangles) and female (circles) mice. Mean ± SE. ****p ≤ 0.0001 by Student’s t test. (G) Negative feedback mechanism wherein stress hormone downregulates ACTH. (H and I) Serum corticosterone (H) and ACTH (I) levels from male (triangles) and female (circles) mice. **p ≤ 0.01 and ***p ≤ 0.001 by Welch’s t test. Mean ± SE. (J) Immunoblot of adrenal gland lysates from female (lanes 1 and 2) and male (lanes 3 and 4) littermate mice. (K and L) Resected tissue from a Cushing’s patient. PKAc (green) and DAPI (magenta) were stained in normal adjacent adrenal tissue (K) and adenoma (L). (M and N) Immunostaining for ERK (magenta) and phospho-ERK (green) in adjacent adrenal gland (M) and adenoma (N) of a Cushing’s patient. Scale bar, 20 μm. (O and P) Quantitation of fluorescence for phospho-ERK (O) and total ERK (P). Ten images each per condition from two patients. Mean ± SE. (Q) Immunoblot detecting YAP1 and TAZ levels in normal adrenal and adenoma from a Cushing’s patient. Represents two patients. See also Figure S7.

References

    1. Amunjela JN, Swan AH, and Brand T (2019). The role of the Popeye domain containing gene family in organ homeostasis. Cell 8. 10.3390/cells8121594. - DOI - PMC - PubMed
    1. Baffi TR, Lordén G, Wozniak JM, Feichtner A, Yeung W, Kornev AP, King CC, Del Rio JC, Limaye AJ, Bogomolovas J, et al. (2021). mTORC2 controls the activity of PKC and Akt by phosphorylating a conserved TOR interaction motif. Sci. Signal 14, eabe4509. 10.1126/scisignal.abe4509. - DOI - PMC - PubMed
    1. Bathon K, Weigand I, Vanselow JT, Ronchi CL, Sbiera S, Schlosser A, Fassnacht M, and Calebiro D (2019). Alterations in protein kinase A substrate specificity as a potential cause of cushing syndrome. Endocrinology 160, 447–459. 10.1210/en.2018-00775. - DOI - PubMed
    1. Bauman AL, Soughayer J, Nguyen BT, Willoughby D, Carnegie GK, Wong W, Hoshi N, Langeberg LK, Cooper DMF, Dessauer CW, and Scott JD (2006). Dynamic regulation of cAMP synthesis through anchored PKA-adenylyl cyclase V/VI complexes. Molecular cell 23, 925–931. 10.1016/j.molcel.2006.07.025. - DOI - PMC - PubMed
    1. Beuschlein F, Fassnacht M, Assié G, Calebiro D, Stratakis CA, Osswald A, Ronchi CL, Wieland T, Sbiera S, Faucz FR, et al. (2014). Constitutive activation of PKA catalytic subunit in adrenal Cushing’s syndrome. N. Engl. J. Med 370, 1019–1028. 10.1056/NEJMoa1310359. - DOI - PMC - PubMed

Publication types

Substances