. 2022 Jul 12;40(2):111045.
doi: 10.1016/j.celrep.2022.111045.

Single-cell atlas of craniogenesis uncovers SOXC-dependent, highly proliferative, and myofibroblast-like osteodermal progenitors

Affiliations

Single-cell atlas of craniogenesis uncovers SOXC-dependent, highly proliferative, and myofibroblast-like osteodermal progenitors

Marco Angelozzi et al. Cell Rep. .

Abstract

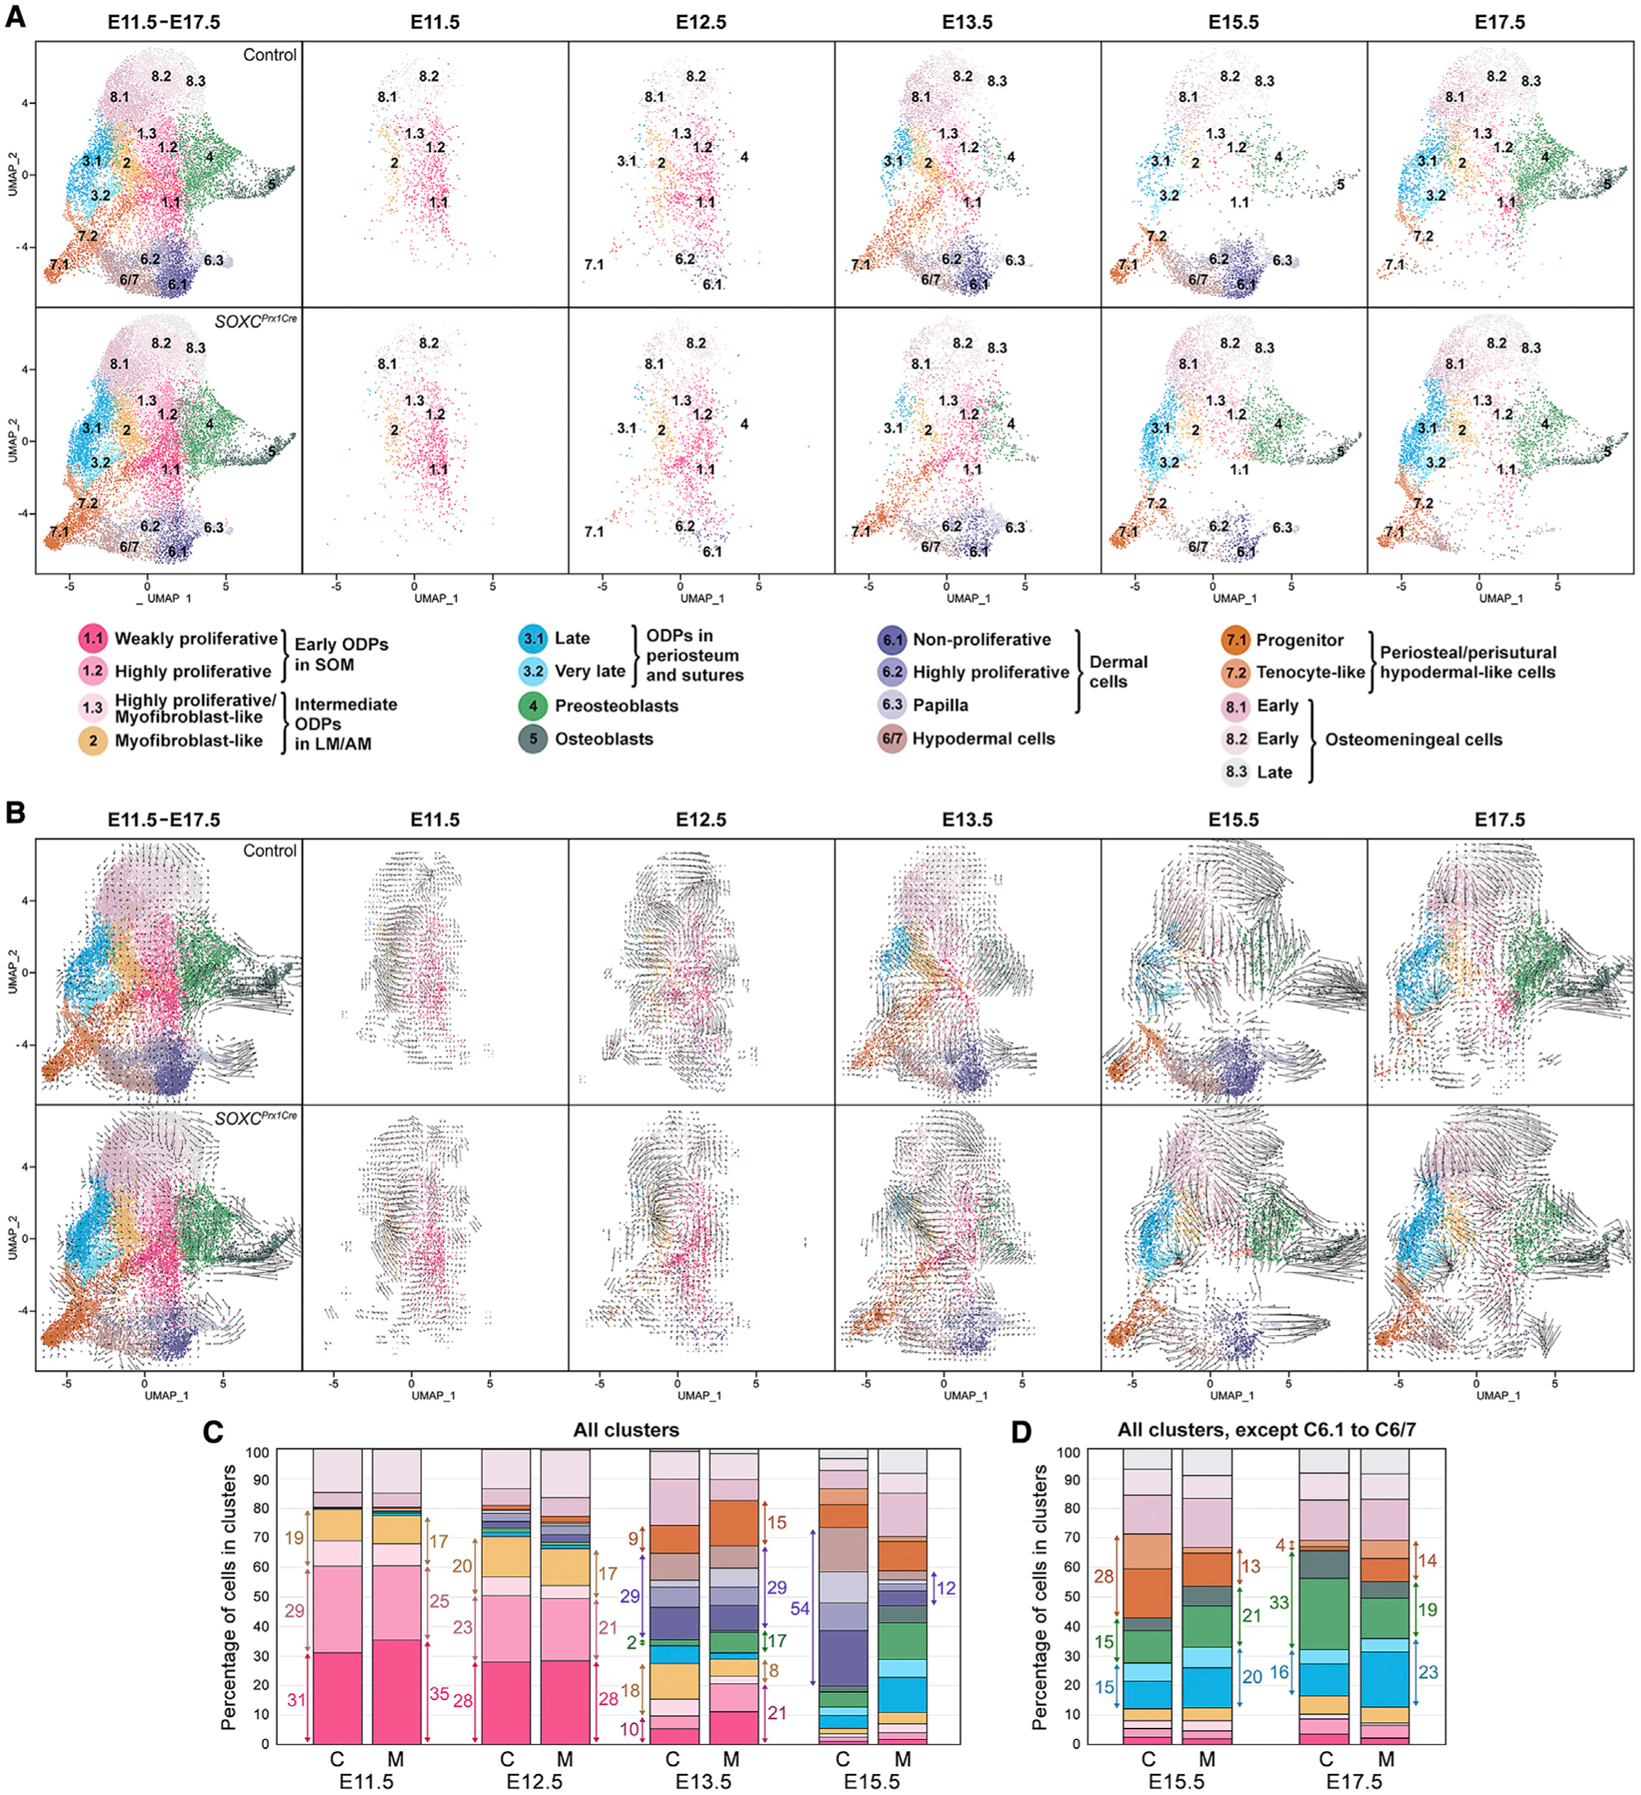
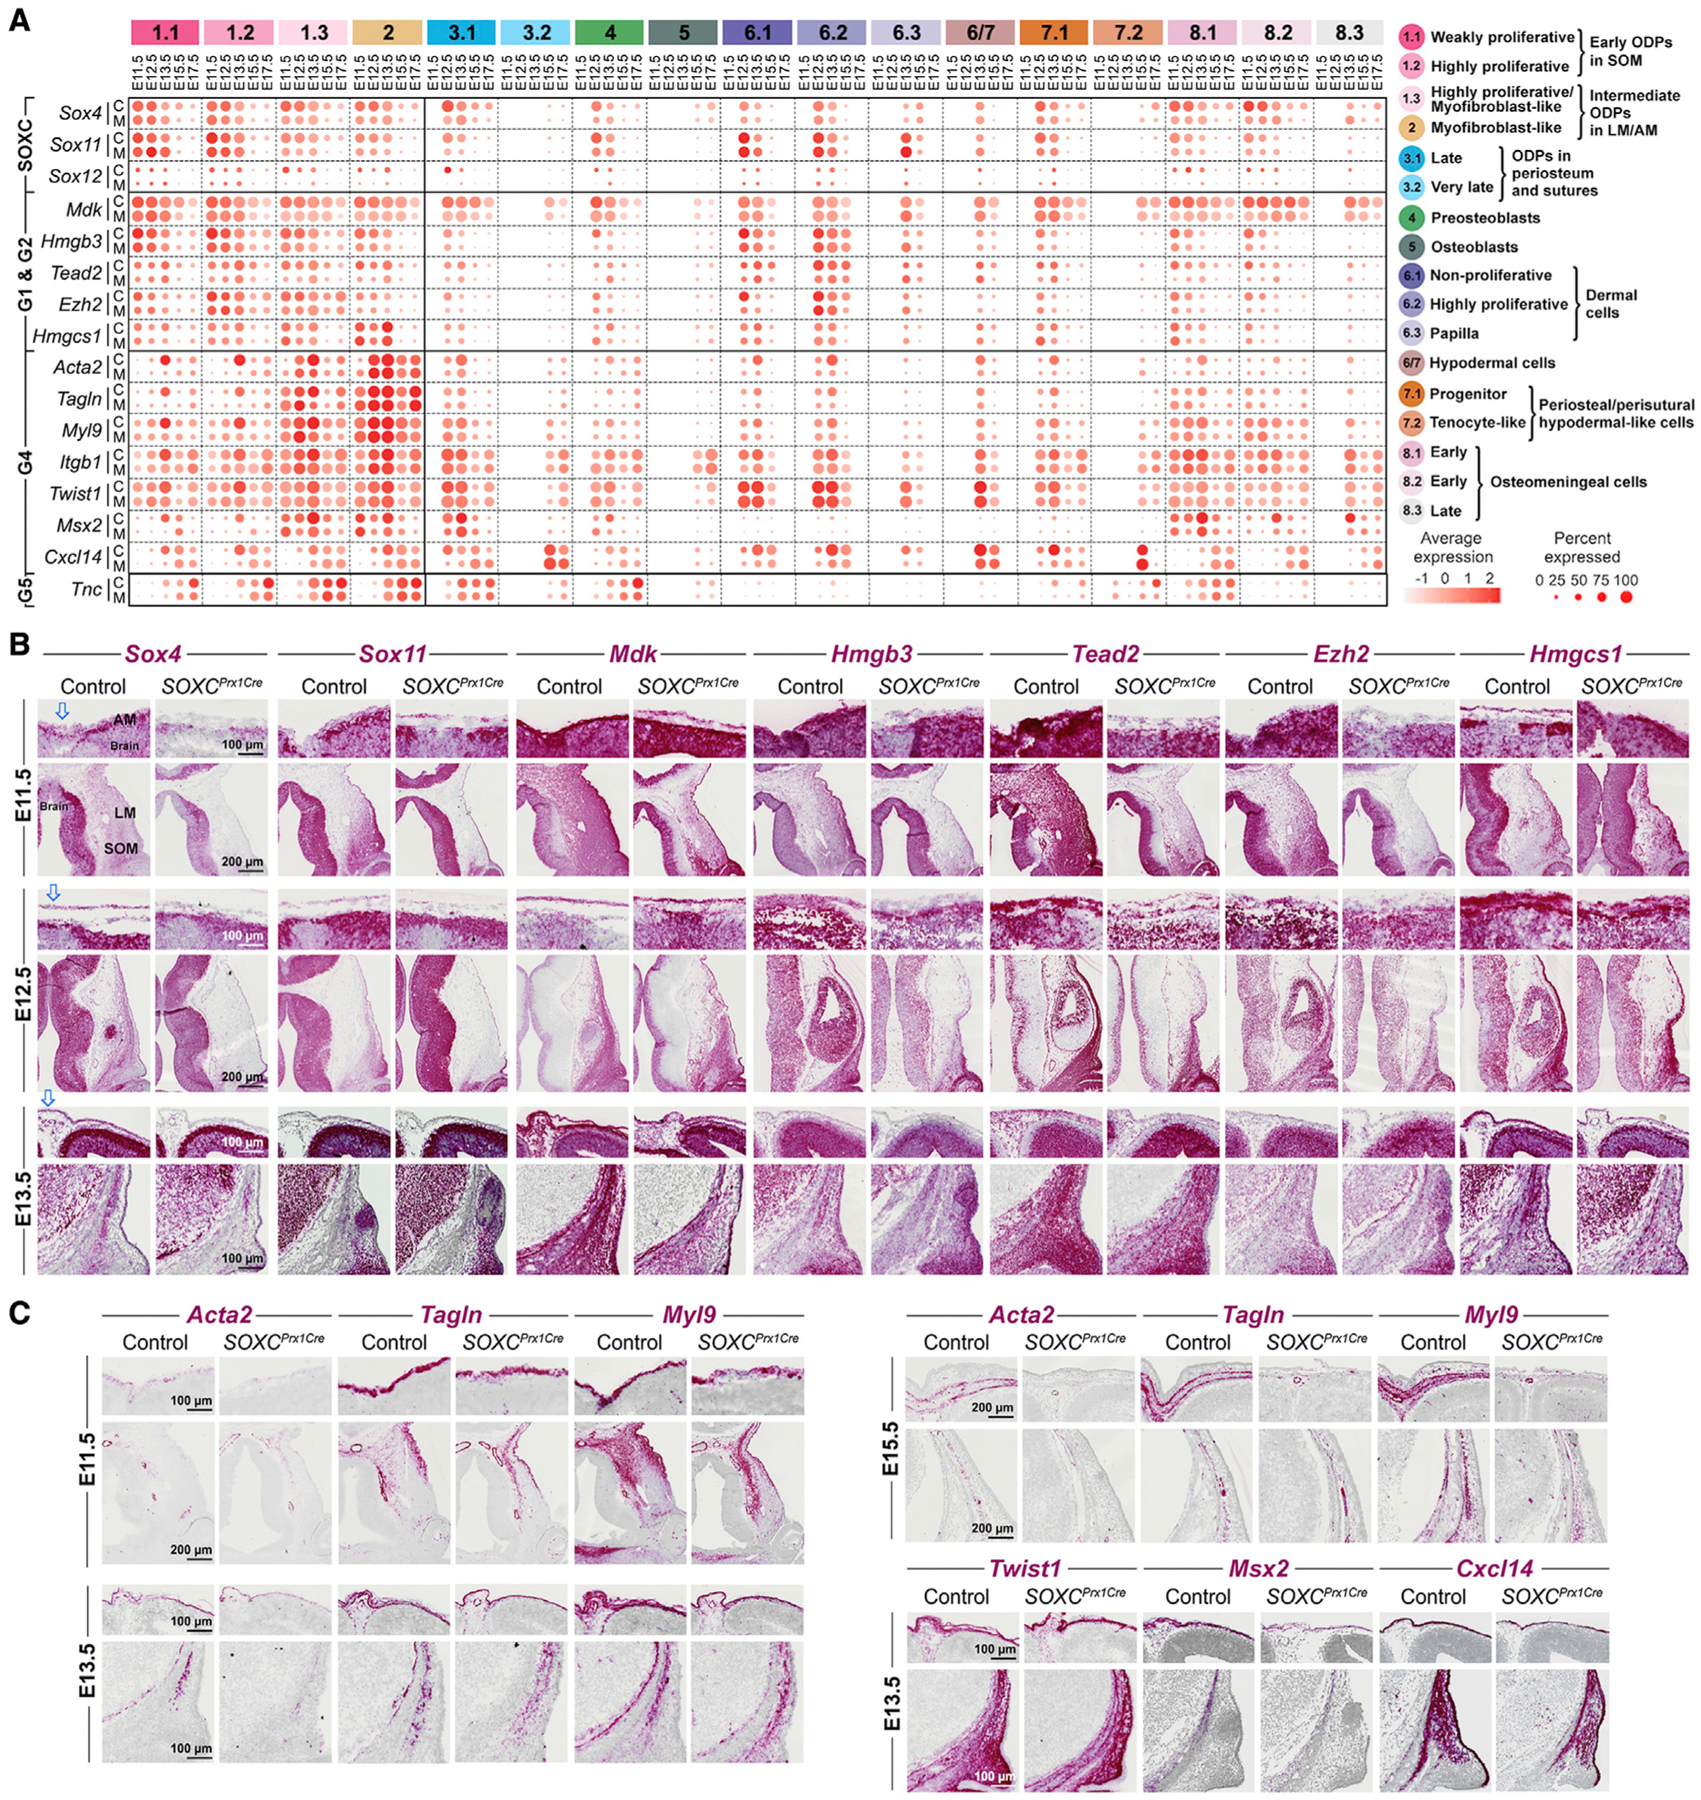
The mammalian skull vault is essential to shape the head and protect the brain, but the cellular and molecular events underlying its development remain incompletely understood. Single-cell transcriptomic profiling from early to late mouse embryonic stages provides a detailed atlas of cranial lineages. It distinguishes various populations of progenitors and reveals a high expression of SOXC genes (encoding the SOX4, SOX11, and SOX12 transcription factors) early in development in actively proliferating and myofibroblast-like osteodermal progenitors. SOXC inactivation in these cells causes severe skull and skin underdevelopment due to the limited expansion of cell populations before and upon lineage commitment. SOXC genes enhance the expression of gene signatures conferring dynamic cellular and molecular properties, including actin cytoskeleton assembly, chromatin remodeling, and signaling pathway induction and responsiveness. These findings shed light onto craniogenic mechanisms and SOXC functions and suggest that similar mechanisms could decisively control many developmental, adult, pathological, and regenerative processes.

Keywords: CP: Developmental biology; SOX11; SOX4; SOXC; craniogenesis; cytoskeleton; dermogenesis; intramembranous ossification; myofibroblast; osteogenesis; progenitor cell; skeletogenesis; skin; skull; suture; transcriptomics.


Conflict of interest statement

Declaration of interests The authors declare no competing interests.

Figures

Figure 1.
Figure 1.. SOXC are necessary for proper craniogenesis
(A) Skeletal preparations of E18.5 control and SOXCPrx1Cre littermate heads. Bone is stained with alizarin red and cartilage with Alcian blue. Asterisks, bone defects. EO, exoccipital; SO, supraoccipital; IP, interparietal; P, parietal; F, frontal; and N, nasal bones. LS, lambdoid; SS, sagittal; CS, coronal; and FS, frontal sutures. PF, posterior; and AF, anterior fontanelles. (B) Skeletal preparations of E18.5 control and single SOXCPrx1Cre littermate heads. (C) Skeletal preparations of newborn (P0) control and OsxCre littermate heads. Note the fenestration of OsxCre bones. (D) Skeletal preparations of P0 control and SOXCOsxCre littermate heads. Note that bone apex defects are milder in SOXCOsxCre than SOXCPrx1Cre heads. (E) Masson-Goldner trichrome staining of coronal sections through parietal bones of E18.5 control and SOXCPrx1Cre littermates. Top row, low-magnification images. Other rows, enlarged pictures of regions boxed in top row. Bo, bone; br, brain; C, temporal bone cartilage primordium; dc, dermal condensate; De, dermis; Ep, epidermis; Hd, hypodermis; M, meninges; Ss, sagittal suture. Red arrows, apical tip of mineralized bone. Green double arrows, cranium depth. (F) Same analysis as in (C), but for P0 control and OsxCre littermates. Note that OsxCre delayed bone mineralization at the apex. (G) Same analysis as in (C), but for P0 control and SOXCOsxCre littermates. See Figure S2 for complementary data.
Figure 2.
Figure 2.. Transcriptome profiling identifies distinct osteo/dermal populations in E11.5 to E17.5 crania
(A) UMAP plot of osteo/dermal clusters obtained by re-clustering the E11.5–E17.5 C1–C8 clusters of Prrx1med/high cells shown in Figure S3F. Clusters are numbered based on parental clusters and named based on marker expression (see D) and spatial location (see Figure 3). (B) UMAP plots of the same populations as in (A), but at individual developmental stages. (C) Percentages of cells from each developmental stage that contribute to cluster formation. (D) Dot plot showing expression of markers used to identify clusters. Dot color intensity reflects average gene expression per cell, and dot size reflects percentage of gene-expressing cells. Data for clusters with <20 cells are not reported. No data were obtained for E17.5 C6.1–C6/7 cells. (E) Dot plot of SOXC expression. (F) RNA velocity and pseudotime analyses of E11.5–E17.5 osteo/dermal cells. The red dot in the pseudotime graph shows the initial root. (G) Schematic of predicted cluster relationships. Full lines, major links. Dotted lines, minor links.
Figure 3.
Figure 3.. RISH spatially maps cranial cell populations identified by scRNA-seq
(A) Top right, UMAP plots showing E11.5 osteo/dermal cranial populations and expression of markers. Bottom right, RISH on coronal sections at the level of the SOM and presumptive parietal bone and sagittal suture. Asterisks mark the images in which RISH signals were amplified by saturating the magenta color using Adobe Photoshop. Left, schematic of an equivalent section mapping cranial populations. (B–D) Similar data and presentations as in (A), but for later stage samples. See Figure S4 for pictures of RISH in the entire head regions depicted in the schematics. See Figure S5 for additional RISH at E15.5 and for data at E17.5.
Figure 4.
Figure 4.. Cranial osteo/dermal clusters show differences between control and SOXCPrx1Cre embryos
(A) UMAP plots of osteo/dermal clusters in SOXCPrx1Cre and control embryos at all and individual developmental stages. (B) RNA velocity analysis of the same samples as in (A). See pseudotime analyses in Figure S6A. (C) Relative proportions of osteo/dermal clusters in control (C) and mutant (M) cranial populations at E11.5–E15.5. Double arrows indicate percentage values for selected clusters. Clusters are colored as in (A). (D) Same representation as in (C), but after exclusion of C6.1–C6/7 in E15.5 and E17.5 samples.
Figure 5.
Figure 5.. Global analysis reveals transcriptome changes in SOXCPrx1Cre ODPs
(A) Venn diagrams showing the numbers of genes downregulated in E11.5–E13.5 mutant C1/C2 (FC ≥ 1.28, p ≤ 0.05). (B) Heatmaps of the expression levels of downregulated genes. Genes fall into 5 groups according to temporal expression patterns in controls. A few genes of interest are marked. (C) Venn diagrams showing when genes in the 5 groups are downregulated in mutants. (D) GO analysis of all downregulated genes. See Figure S6B for analyses of selected groups. (E) Venn diagrams showing the numbers of genes upregulated in E11.5–E13.5 C1/C2 mutants (FC ≥ 1.28, p ≤ 0.05). (F) Heatmaps of the expression levels of upregulated genes. Genes fall into 3 groups according to temporal expression patterns in controls. A few genes of interest are identified. (G) Venn diagrams showing when genes in the 3 groups are upregulated in mutants. (H) GO analysis of all upregulated genes. See Figure S6C for analyses of selected groups.
Figure 6.
Figure 6.. RISH validates downregulation of selected genes in SOXCPrx1Cre ODPs
(A) Dot plot showing expression of SOXC and other genes downregulated in E11.5–E13.5. SOXCPrx1Cre ODPs. Genes are presented in groups (G) as identified in Figure 5B. Data for clusters of <20 cells are not reported. No data were obtained for E17.5 C6.1–C6/7 cells. Of note, SOXC do not look fully inactivated in mutants, likely because null alleles lack the coding sequence (~1.5 kb), but still contain untranslated sequences (3–7 kb). C, control. M, mutant. (B) RISH for Sox4, Sox11 and other downregulated genes from groups 1 and 2. Coronal sections of E11.5–E13.5 embryo heads were analyzed at the level of the supraorbital mesenchyme and presumptive parietal bone. For each stage, the top row shows the apical mesenchyme (AM) region, and the bottom row shows the supraorbital (SOM) and lateral mesenchyme (LM) region. Descending arrow, medial line where the sagittal suture will later form. (C) RISH at E11.5–E15.5 for group 4 downregulated genes. Data were generated and are presented as in (B). See Figure S7 for images of the entire sections.
Figure 7.
Figure 7.. SOXC promote cell proliferation but not lineage specification of embryonic crania
(A) Dot plot showing expression of SOXC and various markers in E11.5–E17.5 control (C) and SOXCPrx1Cre (M) populations. Data for clusters of <20 cells are not reported. No data were obtained for E17.5 C6.1–C6/7 cells. (B) RISH for various markers in E13.5–E17.5 control and SOXCPrx1Cre embryo sections at the level of the parietal bone. High-magnification pictures are shown for SOM/LM (left) and AM (right). Asterisks indicate that RISH signals were equally amplified in controls and mutants by saturating the magenta color using Adobe Photoshop. See Figure S8 for images of the entire sections. (C) Cell proliferation assays in E11.5–E15.5 control and SOXCPrx1Cre embryos. Left, representative images of EdU incorporation assays in sections generated as in (B). EdU signals are shown in red and DAPI signals (cell nuclei) in white. Right, box plots of the percentages of EdU+ cells detected in the SOM/LM and AM regions for 3 control (C) and mutant (M) littermate pairs per time point. p values from paired t tests are indicated. ns, not significant. See Figure S9 for complementary data.

Similar articles

Cited by

References

    1. Aldeiri B, Roostalu U, Albertini A, Wong J, Morabito A, and Cossu G (2017). Transgelin-expressing myofibroblasts orchestrate ventral midline closure through TGFβ signalling. Development 144, 3336–3348. 10.1242/dev.152843. - DOI - PMC - PubMed
    1. Angelozzi M, de Charleroy CR, and Lefebvre V (2021). EdU-based assay of cell proliferation and stem cell quiescence in skeletal tissue sections. Methods Mol. Biol 2230, 357–365. 10.1007/978-1-0716-1028-2_21. - DOI - PMC - PubMed
    1. Angelozzi M, Karvande A, Molin AN, Ritter AL, Leonard JMM, Savatt JM, Douglass K, Myers SM, Grippa M, Tolchin D, et al. (2022). Consolidation of the clinical and genetic definition of a SOX4-related neurodevelopmental syndrome. J. Med. Genet 10.1136/jmedgenet-2021-108375. - DOI - PMC - PubMed
    1. Angelozzi M, and Lefebvre V (2019). SOXopathies: growing family of developmental disorders due to SOX mutations. Trends Genet. 35, 658–671. 10.1016/j.tig.2019.06.003. - DOI - PMC - PubMed
    1. Bhattaram P, Muschler G, Wixler V, and Lefebvre V (2018). Inflammatory cytokines stabilize SOXC transcription factors to mediate the transformation of fibroblast-like synoviocytes in arthritic disease. Arthritis Rheumatol. 70, 371–382. 10.1002/art.40386. - DOI - PMC - PubMed

Publication types

MeSH terms

Substances