. 2022 Jul 25;32(14):3121-3136.e6.
doi: 10.1016/j.cub.2022.06.048. Epub 2022 Jul 12.

Establishment of centromere identity is dependent on nuclear spatial organization

Affiliations

Establishment of centromere identity is dependent on nuclear spatial organization

Weifang Wu et al. Curr Biol. .

Abstract

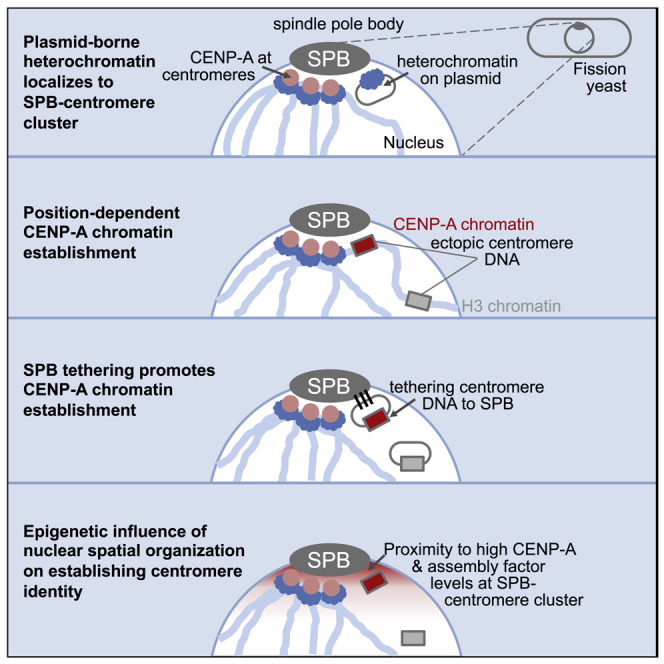
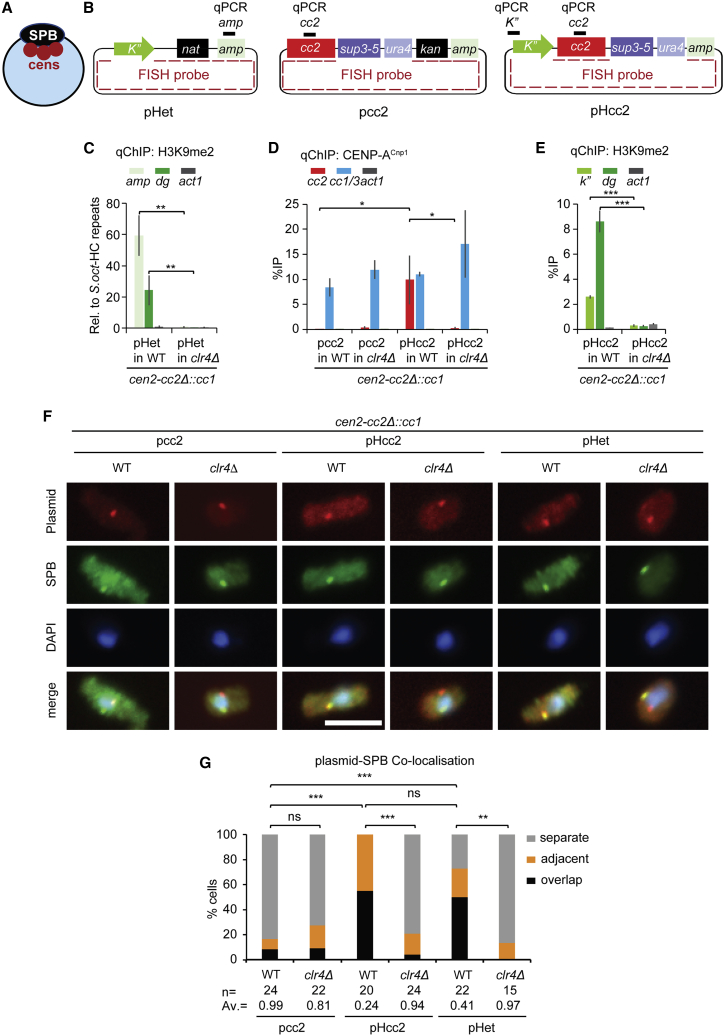
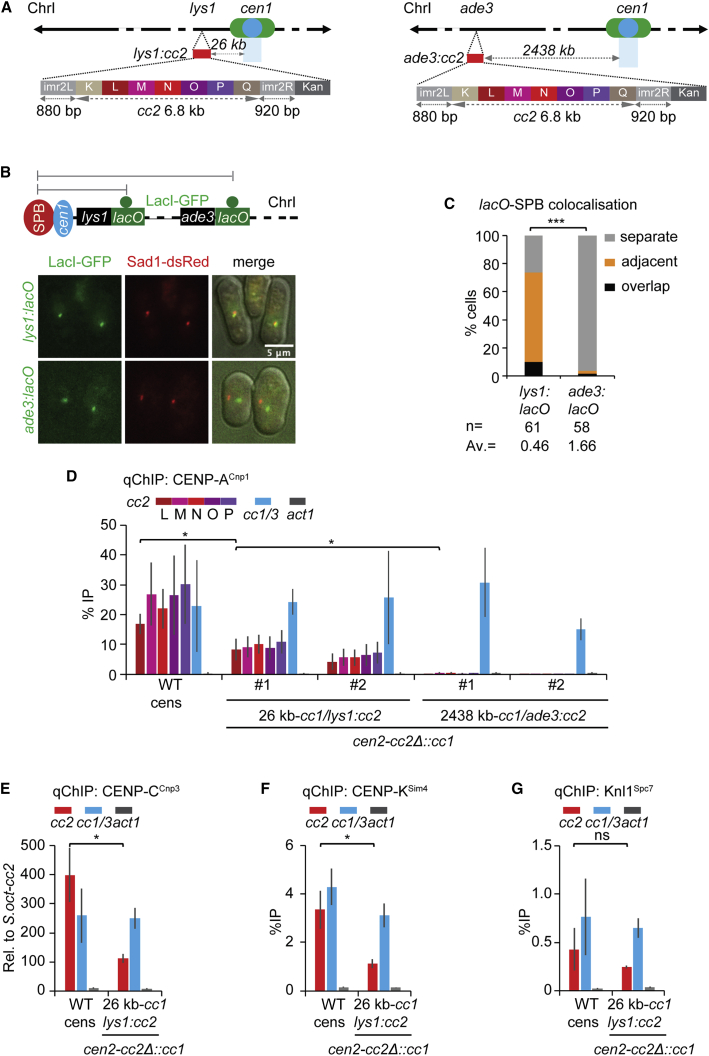
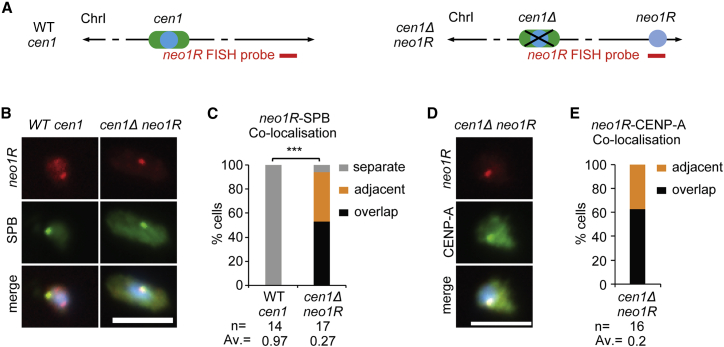
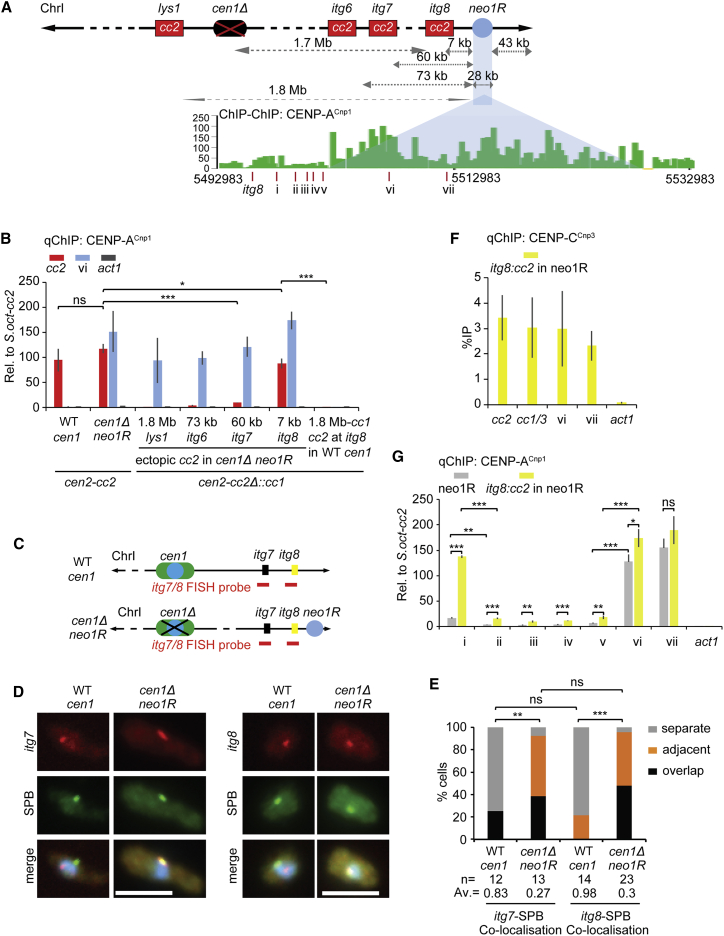
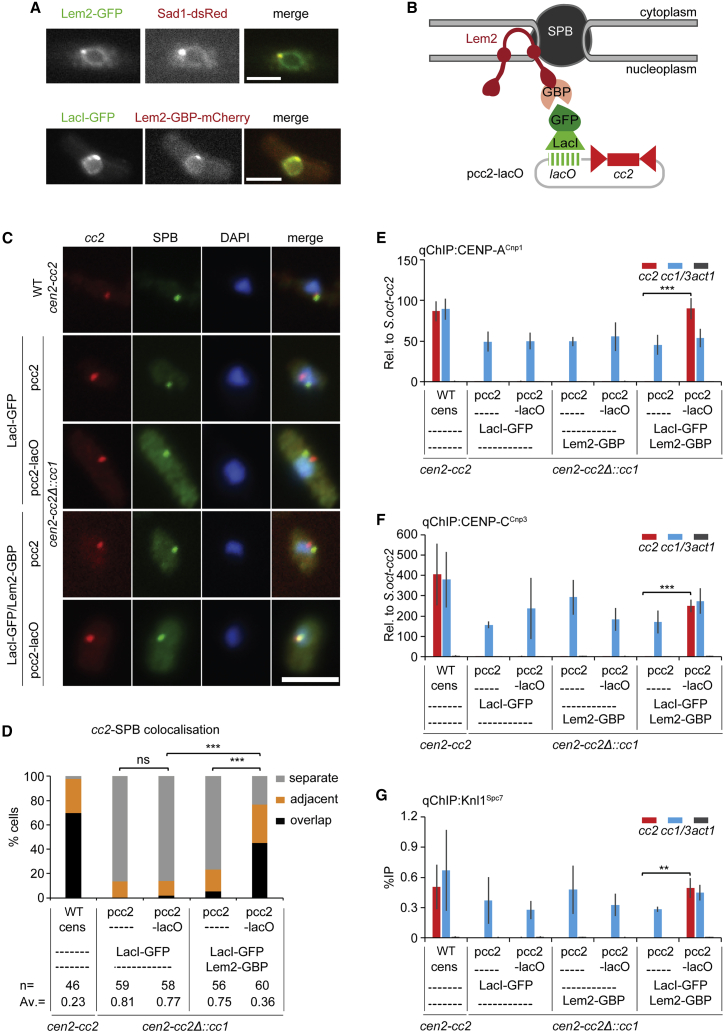
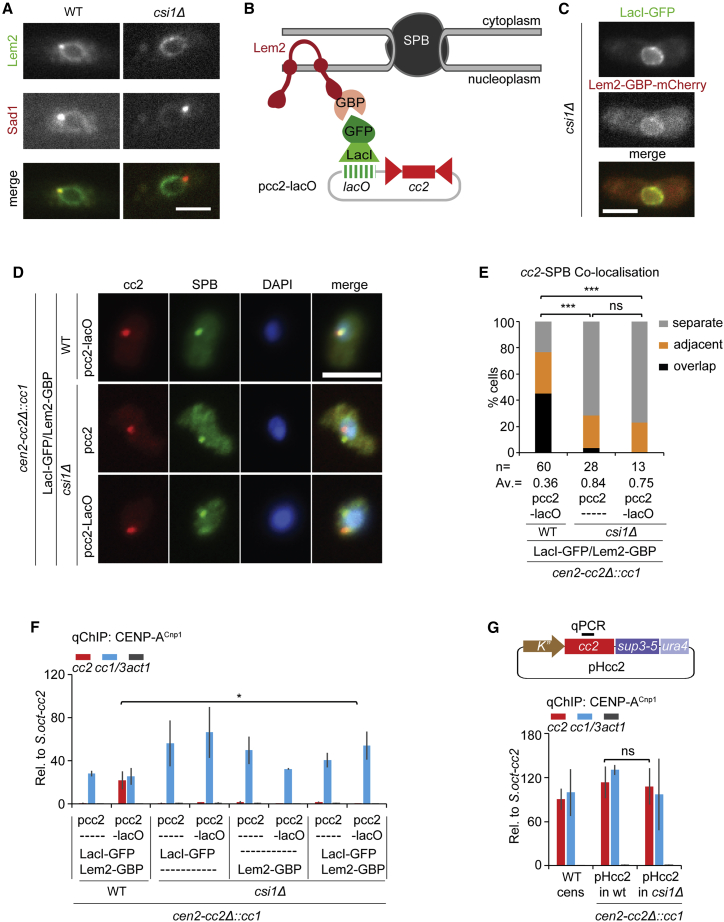
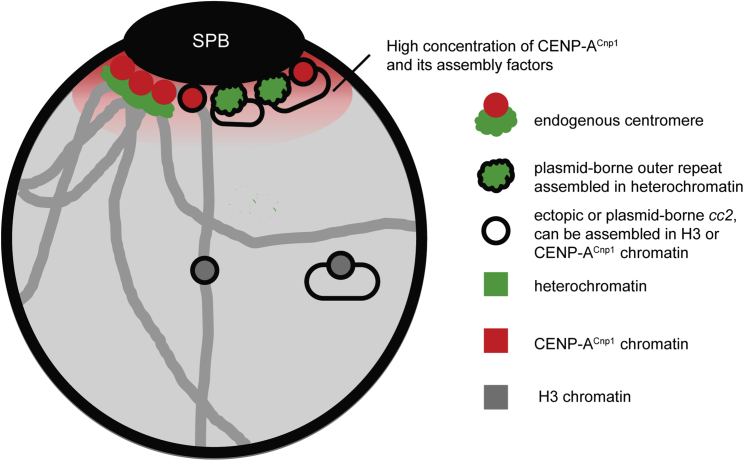
The establishment of centromere-specific CENP-A chromatin is influenced by epigenetic and genetic processes. Central domain sequences from fission yeast centromeres are preferred substrates for CENP-ACnp1 incorporation, but their use is context dependent, requiring adjacent heterochromatin. CENP-ACnp1 overexpression bypasses heterochromatin dependency, suggesting that heterochromatin ensures exposure to conditions or locations permissive for CENP-ACnp1 assembly. Centromeres cluster around spindle-pole bodies (SPBs). We show that heterochromatin-bearing minichromosomes localize close to SPBs, consistent with this location promoting CENP-ACnp1 incorporation. We demonstrate that heterochromatin-independent de novo CENP-ACnp1 chromatin assembly occurs when central domain DNA is placed near, but not far from, endogenous centromeres or neocentromeres. Moreover, direct tethering of central domain DNA at SPBs permits CENP-ACnp1 assembly, suggesting that the nuclear compartment surrounding SPBs is permissive for CENP-ACnp1 incorporation because target sequences are exposed to high levels of CENP-ACnp1 and associated assembly factors. Thus, nuclear spatial organization is a key epigenetic factor that influences centromere identity.

Keywords: CENP-A; S. pombe; centromere identity; fission yeast; heterochromatin; spatial organization; spindle-pole body.


Conflict of interest statement

Declaration of interests The authors declare no competing interests.

Figures

None
Graphical abstract
Figure 1
Figure 1
Centromeric heterochromatin colocalizes with the SPB-centromere cluster (A) Carton showing clustering of three endogenous centromeres (red circles) at the SPB (black oval) during interphase. (B) Diagram of pHet, pcc2, and pHcc2 minichromosomes. Black bars above each plasmid map represent qChIP primer sites on ampicillin gene (amp), cc2, and K″ repeats of plasmids, respectively. Dashed red line in plasmids indicates position of FISH probe. (C–E) qChIP analyses for H3K9me2 levels (C and E) on amp gene of pHet (C); K″ repeats of pHcc2 (E); dg repeats of centromeric HC and act1 gene; CENP-ACnp1 levels (D) on cc2, cc1/3 (indicates sequences common to cc1 and cc3), and act1 in WT and clr4Δ cells containing cc2Δ::cc1 at cen2 transformed with pHet (C), pcc2 (D), or pHcc2 (D and E). %IP levels in S. pombe were normalized to %IP of cen3 HC repeats from spiked-in S. octosporus chromatin in (C). qChIP results in (D) and (E) are reported as %IP. Data are mean ± SD (error bars) (n = 3–4 experimental replicates). p < 0.05, ∗∗p < 0.005, ∗∗∗p < 0.0005 (unpaired t test). (F) Representative images of plasmid DNA FISH (red; probe as indicated in A), SPB location (green; anti-Cdc11), and DNA staining (blue, DAPI) in WT and clr4Δ cells transformed with pcc2, pHcc2, or pHet. Images were scaled relative to the maximum values of histogram. Scale bars, 5 μm. (G) Cells were classified into three groups according to the 3D distances between plasmid and SPB (Cdc11): overlap (≤0.3 μm), adjacent (0.3–0.5 μm), or separate (0.5–3 μm). Percentage of interphase cells (n, number analyzed from 3 independent experiments) in each category. AV, average distance; ns, no significance; ∗∗p < 0.001, ∗∗∗p < 0.0001 (Mann-Whitney U test) (see also STAR Methods and Figures S1–S3).
Figure 2
Figure 2
CENP-ACnp1 chromatin is established on the centromere-adjacent lys1:cc2 central domain (A) Ectopic cc2, carrying 880 bp imr2L, 6.8 kb cc2 (subdivided into K-to-Q regions; 6 kb is unique), and 920 bp imr2R DNA, was inserted at lys1 (lys1:cc2; 26 kb from cc1) or ade3 (ade3:cc2; 2438 kb from cc1) on ChrI in cc2Δ::cc1 strain. (B) Representative images of live cells expressing Sad1-dsRed (SPB marker) and LacI-GFP bound to lys1:lacO or ade3:lacO. Images were scaled relative to the maximum intensity in the set of images. Scale bars, 5 μm. (C) 3D distances between lys1:lacO or ade3:lacO and SPBs (Sad1). Percentage of G2 cells (n, number analyzed from 3 independent experiments) in each category, classified as in Figure 1. AV, average distance. ∗∗∗p < 0.0001 (Mann-Whitney U test) (see also STAR Methods). (D) qChIP for CENP-ACnp1 at regions L-P of cc2, cc1/3 and act1 in WT cens strain carrying endogenous cen2-cc2 or cen2-cc2Δ::cc1 strain with lys1:cc2 or ade3:cc2 insertions. # number indicates individual isolates. (E–G) qChIP analyses for CENP-CCnp3 (E), CENP-KSim4 (F), and Knl1Spc7 (G) levels at cc2, cc1/3, and act1 genes in WT cens strain carrying endogenous cen2-cc2 or cen2-cc2Δ::cc1 strain with lys1:cc2. %IP levels in S. pombe were normalized to %IP of S. octosporus central core from spiked-in chromatin in (E). qChIP results in (D), (F), and (G) were reported as %IP. Data are mean ± SD (n = 3). ns, no significance; p < 0.05 (unpaired t test) (see also Figures S1, S4, and S5).
Figure 3
Figure 3
neo1R neocentromere clusters with endogenous centromeres at the SPB during interphase (A) Diagram represents strains with cen1 or lacking cen1 but carrying neo1R neocentromere (cen1Δ neo1R). Red line indicates position of neo1R DNA FISH probe (ChrI: 5,513,871–5,530,124). (B and D) Representative images of neo1R DNA FISH (red; probe as indicated in A), SPB location (green; anti-Cdc11; B) or centromere clusters (green; anti-CENPCnp1; D), and DNA staining (blue, DAPI) in WT cen1 (B) and cen1Δ neo1R cells. Images were scaled as in Figure 1. Scale bars, 5 μm. (C and E) 3D distances between neo1R DNA and SPBs (Cdc11; C) or centromere clusters (CENP-ACnp1; E). Percentage of interphase cells (n, number analyzed) in each distance category, classified as in Figure 1. AV, average distance. ∗∗∗p < 0.0001 (Mann-Whitney U test) (see also Figure S1).
Figure 4
Figure 4
CENP-ACnp1 chromatin can establish on central domain DNA inserted close to the neocentromere (A) Ectopic cc2 inserted at lys1, itg6 (ChrI: 5,435,010–5,435,237), itg7 (ChrI: 5,447,816–5,448,235), and itg8 (ChrI: 5,501,647–5,502,134), 1.8 Mb, 73, 60, and 7 kb from neo1R CENP-ACnp1 domain, respectively. ChIP-CHIP analysis for CENP-ACnp1 in cen1Δ neo1R (cd60) strain was obtained from Ishii et al. Red lines indicate itg8 and 7 qChIP primer sites (i–vii). (B) qChIP analyses of CENP-ACnp1 levels at cc2, cc1/3, and act1 in WT cen1 or cen1Δ neo1R strain with lys1:cc2, itg6:cc2, itg7:cc2, or itg8:cc2 insertions (genome positions as indicated in A). (C) Diagram represents WT-cen1 or cen1Δ neo1R strains. Red line indicates position of itg7 or itg8 DNA FISH probe (ChrI 5,438,081–5,453,142; ChrI 5,495,975–5,508,459), respectively. (D) Representative images of itg7 or itg8 DNA FISH (red; probe as indicated in C), SPB location (green, anti-Cdc11), and DNA staining (blue, DAPI) in WT cen1 and cen1Δ neo1R cells. Images scaled as in Figure 1. Scale bars, 5 μm. (E) 3D distances between itg7 or itg8 and SPBs (Cdc11), percentage of interphase cells (n, number analyzed) in each category, classified as in Figure 1. AV, average distance. ns, no significance; ∗∗p < 0.001, ∗∗∗p < 0.0001 (Mann-Whitney U test). (F) qChIP analyses for CENP-CCnp3 levels at cc1/3, cc2, act1, and site i and ii within neo1R in cen1Δ neo1R strain with itg8:cc2 insertion. qChIP results were reported as %IP. (G) qChIP analyses for CENP-ACnp1 levels at 7 loci (i–vii, positions as indicated in A) and act1 in cen1Δ neo1R strain, with or without itg8:cc2 insertion. ns, no significance; p < 0.05, ∗∗p < 0.005, ∗∗∗p < 0.0005 (unpaired t test). %IP levels in S. pombe were normalized to %IP of S. octosporus central core from spiked-in chromatin (B and G). Data are mean ± SD (n = 3) (see also Figure S1).
Figure 5
Figure 5
Tethering cc2 DNA to Lem2 allows CENP-ACnp1 incorporation and kinetochore protein recruitment (A) Representative images of live cells expressing Lem2-GFP and Sad1-dsRed or LacI-GFP and Lem2-GBP-mCherry. Images were scaled as in Figure 2. Scale bars, 5 μm. (B) Schematic representation of the tethering system used to force pcc2-lacO association with Lem2-GBP-mCherry at the NE and SPB. pcc2-lacO is bound by LacI-GFP and ultimately tethered to Lem2-GBP-mCherry via GFP/GBP interaction. (C) Representative images of cc2 DNA FISH (red), SPB location (green, anti-Cdc11), and DNA staining (blue, DAPI) in WT cens strain carrying endogenous cen2-cc2 or cen2-cc2Δ::cc1 strain expressing LacI-GFP or both LacI-GFP and Lem2-GBP-mCherry transformed with pcc2 or pcc2-lacO. Fluorescence of LacI-GFP and Lem2-GBP-mCherry was dissipated by the immunofluorescence/DNA FISH procedure and did not contribute punctate signal. Images were scaled as in Figure 1. Scale bars, 5 μm. (D) 3D distances between cc2 and SPBs (Cdc11), percentage of interphase cells (n, number analyzed) in each category, classified as in Figure 1. AV, average distance; ns, no significance; ∗∗∗p < 0.0001 (Mann-Whitney U test). (E–G) qChIP analyses for CENP-ACnp1 (E), CENP-CCnp3 (F), and Knl1Spc7 (G) levels at cc2, cc1/3, and act1 in WT cens strain carrying endogenous cen2-cc2 or cen2-cc2Δ::cc1 strain expressing LacI-GFP or Lem2-GBP-mCherry, or both of them transformed with pcc2 or pcc2-lacO. %IP levels in S. pombe were normalized to %IP of S. octosporus central core from spiked-in chromatin in (E) and (F). qChIP results in (G) reported as %IP. Data are mean ± SD (n = 3). ∗∗p < 0.005, ∗∗∗p < 0.0005 (unpaired t test) (see also Figures S1, S6, and S7).
Figure 6
Figure 6
Loss of Csi1 prevents CENP-ACnp1 chromatin establishment on Lem2-tethered pcc2-lacO (A and C) Representative images of live WT and csi1Δ cells expressing Lem2-GFP and Sad1-dsRed (A) or LacI-GFP and Lem2-GBP-mCherry (C). Images were scaled as in Figure 2. Scale bars, 5 μm. (B) Forced association of pcc2-lacO with Lem2-GBP-mCherry at NE in csi1Δ using same tethering system as in Figure 5. In csi1Δ, pcc2-lacO is expected to detach from the SPB due to loss of Lem2 from SPB. (D) Representative images of cc2 DNA FISH (red), SPB location (green, anti-Cdc11), and DNA staining (blue, DAPI) WT or csi1Δ strains expressing both LacI-GFP and Lem2-GBP-mCherry transformed with pcc2 or pcc2-lacO. Images were scaled as in Figure 1. Scale bars, 5 μm. (E) Percentage of interphase cells (n, number analyzed) displaying distinct degrees of cc2 DNA colocalization with SPBs (Cdc11). Cells were classified into three groups as in Figure 1. AV, average distance. ns, no significance; ∗∗∗p < 0.0001 (Mann-Whitney U test). (F and G) qChIP analyses for CENP-ACnp1 at cc2, cc1/3, and act1 in indicated strains transform with pcc2 or pcc2-lacO (F) or pHcc2 (G). qChIP primer site on pHcc2-borne cc2 is indicated as black bar above plasmid map (G). %IP levels in S. pombe were normalized to %IP of S. octosporus central core from spiked-in chromatin. Data are mean ± SD (n = 3). ns, no significance; p < 0.05 (unpaired t test) (see also Figure S1).
Figure 7
Figure 7
Model: Centromere identity is influenced by nuclear spatial organization Due to clustering of endogenous centromeres (CENP-ACnp1-assembled central domains, red circles; heterochromatic outer repeats, green) at SPBs and incorporation of CENP-ACnp1 at centromeres in G2, the zone around SPBs forms a nuclear sub-compartment rich in CENP-ACnp1 and its assembly factors (red-shaded cloud). Ectopic central domain (outlined circles) inserted at centromere-proximal sites exposed the high-CENP-ACnp1 SPB/centromere sub-compartment, promoting de novo incorporation of CENP-ACnp1, unlike centromere-distal locations. Similarly, only minichromosomes bearing heterochromatin, which mediates localization close to the SPB, exposes the adjacent central domain to the high-CENP-ACnp1 SPB/centromere sub-compartment, resulting in CENP-ACnp1 incorporation. Heterochromatin, green; CENP-ACnp1, red; neutral H3 chromatin, gray (see also Figure S1).

Comment in

Similar articles

Cited by

References

    1. Allshire R.C., Karpen G.H. Epigenetic regulation of centromeric chromatin: old dogs, new tricks? Nat. Rev. Genet. 2008;9:923–937. - PMC - PubMed
    1. Mellone B.G., Fachinetti D. Diverse mechanisms of centromere specification. Curr. Biol. 2021;31:R1491–R1504. - PMC - PubMed
    1. DeBose-Scarlett E.M., Sullivan B.A. Genomic and epigenetic foundations of neocentromere formation. Annu. Rev. Genet. 2021;55:331–348. - PubMed
    1. Ishii K., Ogiyama Y., Chikashige Y., Soejima S., Masuda F., Kakuma T., Hiraoka Y., Takahashi K. Heterochromatin integrity affects chromosome reorganization after centromere dysfunction. Science. 2008;321:1088–1091. - PubMed
    1. Mitra S., Srinivasan B., Jansen L.E.T. Stable inheritance of CENP-A chromatin: inner strength versus dynamic control. J. Cell Biol. 2020;219:e202005099. doi: 10.1083/jcb.202005099. - DOI - PMC - PubMed

Publication types

MeSH terms