. 2022 Sep;609(7926):416-423.
doi: 10.1038/s41586-022-05086-1. Epub 2022 Jul 13.

Structure of the MRAS-SHOC2-PP1C phosphatase complex

Affiliations

Structure of the MRAS-SHOC2-PP1C phosphatase complex

Zachary J Hauseman et al. Nature. 2022 Sep.

Abstract

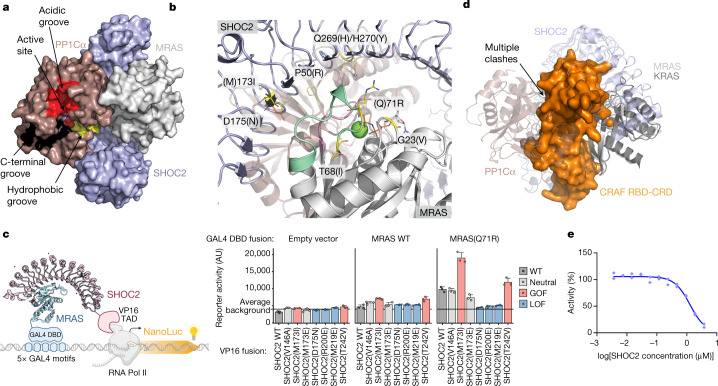
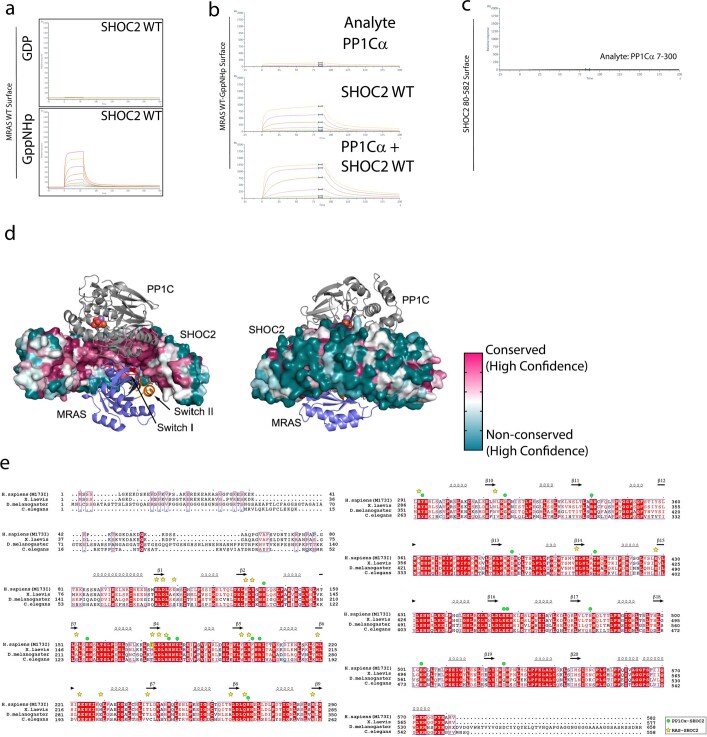
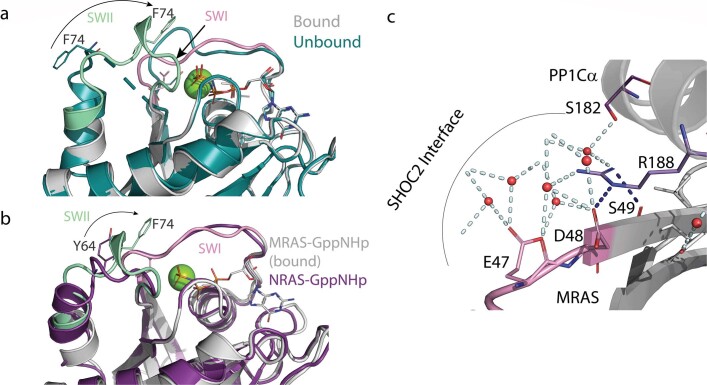
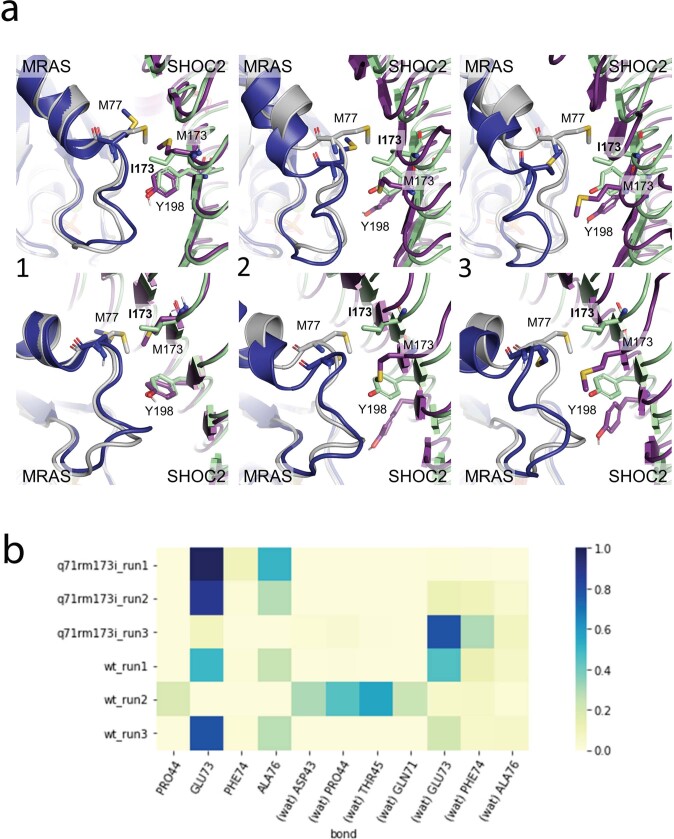
RAS-MAPK signalling is fundamental for cell proliferation and is altered in most human cancers1-3. However, our mechanistic understanding of how RAS signals through RAF is still incomplete. Although studies revealed snapshots for autoinhibited and active RAF-MEK1-14-3-3 complexes4, the intermediate steps that lead to RAF activation remain unclear. The MRAS-SHOC2-PP1C holophosphatase dephosphorylates RAF at serine 259, resulting in the partial displacement of 14-3-3 and RAF-RAS association3,5,6. MRAS, SHOC2 and PP1C are mutated in rasopathies-developmental syndromes caused by aberrant MAPK pathway activation6-14-and SHOC2 itself has emerged as potential target in receptor tyrosine kinase (RTK)-RAS-driven tumours15-18. Despite its importance, structural understanding of the SHOC2 holophosphatase is lacking. Here we determine, using X-ray crystallography, the structure of the MRAS-SHOC2-PP1C complex. SHOC2 bridges PP1C and MRAS through its concave surface and enables reciprocal interactions between all three subunits. Biophysical characterization indicates a cooperative assembly driven by the MRAS GTP-bound active state, an observation that is extendible to other RAS isoforms. Our findings support the concept of a RAS-driven and multi-molecular model for RAF activation in which individual RAS-GTP molecules recruit RAF-14-3-3 and SHOC2-PP1C to produce downstream pathway activation. Importantly, we find that rasopathy and cancer mutations reside at protein-protein interfaces within the holophosphatase, resulting in enhanced affinities and function. Collectively, our findings shed light on a fundamental mechanism of RAS biology and on mechanisms of clinically observed enhanced RAS-MAPK signalling, therefore providing the structural basis for therapeutic interventions.


Conflict of interest statement

Z.J.H., A.D., J.V., D.E., M.B., S.K., K.A.P., F.M., H.G., G.K., S.M., C.V.-V., K.S.B., G.G.G., S.-M.M., T.S., K.C., L.T., C.R.T. and D.A.K. are employees and shareholders of Novartis Pharma. M.F. is a former employee of Novartis. M.J.E. receives funding from Novartis Pharma.

Figures

Fig. 1
Fig. 1. Cooperative assembly of the SHOC2–MRAS–PP1Cα ternary complex.
a, The affinity (KD) and associated cooperativity (α) values derived from SPR sensorgrams with surface-immobilized MRAS–GppNHp (WT or Q71R) and the indicated analytes. Cooperativity is defined as the ratio of binary and ternary KD values, α = KDSHOC2/KDSHOC2–PP1C. The increase in response units (RU) signal is consistent with the saturation of MRAS with both proteins Rmax, SHOC2, ~800–1,000 RU; Rmax, SHOC2/PP1Cα, ~1,250–1,500 RU). b, Sedimentation coefficient distributions c(s) derived from sedimentation velocity profiles of MRAS(Q71R) (black); PP1Cα (bronze); SHOC2(80–582, M173I) (blue); mixture of MRAS(Q71R) and SHOC2(80–582, M173) (gold); mixture of SHOC2(80–582, M173I), MRAS(Q71R) and PP1Cα (red). The raw sedimentation signal was acquired over time by absorbance at 280 nm at a rotor speed of 42,000 rpm at 20 °C. All proteins were sedimented at equimolar concentrations of 10 μM. Data are representative of two independent experiments. c, Ultraviolet light absorbance at 280 nm traces from semi-preparative SEC (top). SDS–PAGE analysis of individual fractions corresponding to the ternary complex trace (bottom). The SEC experiment was independently repeated three times with similar results. d, Surface representation of the ternary complex of SHOC2 (pale blue), MRAS (grey) and PP1Cα (maroon). The phosphate group bound at the active site is shown as red spheres, and Mn2+ is shown as purple.
Fig. 2
Fig. 2. SHOC2–MRAS–PP1Cα interfaces include polar contacts and coordinated solvent.
a, Cartoon view of the complex of SHOC2 (pale blue), MRAS (grey) and PP1Cα (maroon), illustrating interactions mediated by the concave surface of SHOC2. SWI and SWII of MRAS are highlighted in pink and green, respectively; GppNHp is rendered in ball and stick; and Mg2+ is represented as a green sphere. The phosphate bound to the active site of PP1C is represented in red, and the Mn2+ metals are indicated as orange spheres. This colour scheme is maintained throughout all of the figures. b, Cooperative interface of SHOC2, PP1Cα and MRAS mediated by SWI (pale green) and SWII (pink) of MRAS. c, SHOC2 uses its β-sheet surface and descending loops from multiple LRRs to recruit MRAS while binding to PP1Cα through the ascending loops of numerous LRRs. One representative LRR (orange) is shown. MRAS and PP1Cα are shown in surface representation. d, Direct and water-mediated interactions at the cooperative interface highlighting MRAS SWI interactions with Arg188 of PP1Cα helix G. The indicated side chains are colour coded by subunit with representative water molecules indicated by red spheres and bonding networks highlighted by dashed lines. An MRAS-bound magnesium ion is shown as a green sphere. e, Direct and water-mediated interactions at the cooperative interface as in d, but highlighting MRAS SWI and SWII interactions with SHOC2.
Fig. 3
Fig. 3. Rasopathy mutations and RAF binding predicted to affect complex formation.
a, Surface representation of the SHOC2–PP1Cα–MRAS holoenzyme highlighting the active site and accessible acidic (red), C-terminal (black) and hydrophobic (yellow) substrate-binding grooves of PP1Cα. The RVXF and other regulatory surfaces of PP1Cα are not occupied in the SHOC2(80–582)–MRAS(Q71R, 1–178)–PP1Ca(7–300) ternary complex. b, GOF rasopathy mutations localize to PPI interfaces. The indicated GOF and LOF rasopathy mutations are shown as sticks highlighted in yellow and orange, respectively; SHOC2 and MRAS are shown in grey with SWI and SWII indicated. SHOC2 Ile173 (Met173 in WT SHOC2) fills a hydrophobic space produced by SWI, SWII and SHOC2 LRR domains. SHOC2 Gln269/His270 resides at the interface of all three subunits, whereas SHOC2 Asp175 coordinates a water to MRAS Tyr81. PP1Cα Pro50 sits at the PPI interface but cannot make substantial interactions owing to the limitations of the side chain. c, Schematic of the M2H system (left). The Nluc reporter signal resulting from concurrent expression and interaction between GAL4(DBD)–MRAS and SHOC2–VP16(TAD) of WT and mutant variants (right). Data are mean ± s.e.m. n = 3 independent biological replicates. The diagram was created with BioRender.com. d, Alignment of the MRAS–SHOC2–PP1C ternary holophosphatase structure with a structure of KRAS bound to the CRAF RBD-CRD domain (PDB: 6XHA). Note that the alignment (using RAS as the key object) results in multiple clashes between RBD-CRD and PP1C–SHOC2. e, Untagged full-length SHOC2 disrupts the interaction of MRAS(Q71R)–GppNHp and RBD as assessed in a TR-FRET assay (IC50 913nM), indicating that SHOC2 and RBD binding to RAS is incompatible. Technical replicates are shown as individual data points; one of three independent experiments is shown. Competition IC50 values for additional tested combinations are provided in Extended Data Table 3.
Fig. 4
Fig. 4. Canonical RAS isoforms can form active holophosphatases.
a, SPR-derived affinity and cooperativity immobilizing NRAS–GppNHp, NRAS(Q61R)–GTP, KRAS–GppNHp or KRAS(Q61R)–GTP with the indicated analytes. α = KDSHOC2/KDSHOC2–PP1C. Affinity values over 10,000 nM are highlighted in red. b, In vitro dephosphorylation of autoinhibited and active-state BRAF–MEK1–14-3-3 complexes by the SHOC2 holophosphatase. Purified full-length BRAF complexes in the autoinhibited state (left) or active dimeric state (right) were incubated with lambda phosphatase (PPase), PP1Cα or ternary SHOC2 complexes, and were blotted with phospho-specific antibodies for BRAF phosphorylated at Ser365 and Ser729. Equivalent loading of BRAF complexes is shown by Coomassie staining. Phosphorylated Ser365 is selectively dephosphorylated relative to Ser729 in the active dimer, whereas both are relatively protected in the autoinhibited (14-3-3-bound) state. Experiments were conducted twice with similar results. c, The relationship between the knockdown of SHOC2 and MRAS, HRAS, NRAS and KRAS. The dependency scores of each RAS gene and SHOC2 are shown on the x and y axes, respectively. Dashed lines indicate a dependency score of zero. A highly negative dependency score implies that a given cell line is highly dependent on that gene. Cell lines dependent on both SHOC2 and RAS are indicated at the bottom left. Right, the calculated Pearson correlation coefficient (y axis) applied to each mutation group (group of cell lines containing the associated mutation). A higher positive value indicates a stronger positive relationship: the dependency score of SHOC2 decreases/increases in the same lines as the dependency scores of the RAS genes. The n values above each bar show the number of cell lines in each mutation group. d, Immunoblot analysis of MiaPaca2 parental cells (Par), SHOC2-KO (KO) and stable cell lines reconstituted with SHOC2 mutants after 10 nM trametinib (Tram) treatment for 1 h or 24 h (+). Densitometry quantification (percentage variation) of pCRAF/CRAF and pERK/ERK levels from the immunoblot analysis normalized to untreated MiaPaca2 parental cells. The samples were derived from the same experiment and blots were processed in parallel. The images are representative of two independent experiments.
Extended Data Fig. 1
Extended Data Fig. 1. SHOC2 binds MRAS and PP1 through the highly conserved concave face.
a. Recombinant MRAS loaded with either GDP or non-hydrolysable GTP analogue GppNHp was immobilized on a streptavidin (SA) chip and recombinant SHOC2 80-582 was flowed over in dose response. Representative sensorgrams are shown, where only active GppNHp loaded MRAS could bind to SHOC2. b. Recombinant MRAS loaded with non-hydrolysable GTP analogue GppNHp was immobilized on a streptavidin (SA) chip and recombinant PP1Cα, SHOC2 80-582 or FL SHOC2 was flowed over in dose response in presence of excess PP1Cα. Representative sensorgrams are shown, where PP1Cαbinds to active GppNHp loaded MRAS only on the presence of SHOC2 80-582. c. Recombinant SHOC2 80-582 was immobilized on a streptavidin (SA) chip and recombinant PP1Cαwas flowed over in dose response. d. PP1C and MRAS bind a highly conserved surface on SHOC2. Front and back views of the ternary SHOC2/MRAS/PP1C complex. Note that SHOC2 engages PP1C and MRAS with a highly conserved region on its concave surface. By contrast, the outer, convex surface of SHOC2 is poorly conserved. The surface of SHOC2 is coloured according to conservation from magenta (most conserved) to teal (most variable) as analysed with the CONSURF server (PMID: 27166375). e. SHOC2 sequence alignment. Amino acid sequences of human, frog, fly and worm SHOC2 are aligned and identically conserved residues are shaded red. The site of the M173I mutation in the present structure is shaded yellow. Secondary structure elements of SHOC2 are indicated above the alignment. Symbols above the alignment indicate residues that in the holoenzyme complex lie in the interface with PP1Cα (green dots) or MRAS (yellow stars).
Extended Data Fig. 2
Extended Data Fig. 2. Crystal structure of SHOC2 80-582.
a. Crystal structure of recombinant SHOC2 80-582 reveals a folded domain of 20 leucine rich repeats in excellent agreement with structure predictions. Both N and C terminal capping motifs are resolved, without density for the portion of the unstructured N terminus retained. LRR repeats are numbered. b. Alignment of the SHOC2 apo structure (grey) and SHOC2 from the ternary complex structure (pale green). The SHOC2 overall fold is identical, and the curvature of the solenoid shows only minor change to accommodate binding of the other complex members. c. The hydrogen bond network characteristic of the beta sheet traversing the concave face is disrupted between LRR 9 and 10, which is a component of slightly atypical LRR fold in the mid-range repeats of SHOC2.
Extended Data Fig. 3
Extended Data Fig. 3. MRAS SWI/SWII loops adopt a closed conformation.
a. MRAS shifts towards a closed conformation in the ternary complex. Zoom in of SWI and SWII region of bound MRAS-GppNHp (grey) aligned with apo MRAS-GppNHp (teal pdb: 1x1s). Movement of SWII F74 from unbound open (teal) to closed bound (pale green) is illustrated. SWI of bound MRAS is shown in pink. b. Bound MRAS SWI (pink) exhibits a closed conformation similar to active NRAS (purple, pdb: 5uhv). MRAS SWII (pale green) is conformationally shifted relative to NRAS-GppNHp as well. Movement of SWII F74 from NRAS counterpart Y64 is shown. MRAS-GppNHp is shown in grey. c. Cutout view of the water network mediated by critical residues: PP1C R188 and MRAS SWI E47, D48 and S49 mediate a coordinated network that connects all subunits of the complex.
Extended Data Fig. 4
Extended Data Fig. 4. PP1C makes extended interactions with SHOC2 and the MRAS effector surface.
a. PP1Cα interacts with SHOC2 across an extended arc of residues that localize to the ascending loop of SHOC2 LRRs. These interactions are primarily hydrophilic and become more networked near the N-terminal SHOC2 LRRs. Selected residues with salt bridge and hydrogen bond interactions are labelled. b. Helix G of PP1 (purple) and SWI(pink)/Strand beta 2 (grey) are the primary interaction surfaces of the MRAS/PP1Cα PPI. Key interacting residues are labelled. c. PP1C sequence alignment. Amino acid sequences of human PP1Cα, PP1Cβ, and PP1Cγ are aligned with PP1C sequences from frog, fly and worm. Identically conserved residues are shaded in red. Secondary structure elements of PP1C are indicated above the alignment. Symbols above the alignment indicate residues that in the holoenzyme complex lie in the interface with SHOC2 (green dots) or MRAS (blue diamonds).
Extended Data Fig. 5
Extended Data Fig. 5. Effects of M173I mutation on the SHOC2-RAS-PP1C interface.
Three 1 μs trajectories were submitted starting from the crystal structure of SHOC2 M173I/MRAS Q71R/PP1Cα as a means of validating the crystal complex. To investigate the impact of the mutations in SHOC2 and MRAS, the WT complex was simulated by mutating SHOC2 and MRAS residues (I173, R71) to their wild type residues (M173, Q71) and submitting three additional 1 us trajectories. Frames from each of the three trajectories were pooled and clustered. Examining the cluster centres as representative structures revealed three distinct states of the MRAS WT and SHOC2 WT interface. Cluster populations approximate the frequency that each state is observed, revealing state 1 as occurring roughly 67% of the time, followed by state 2 at 29%, and state 3 at 4%. In the crystal complex and across the mutant trajectories, Y198 most frequently interacts with MRAS through hydrogen bonding to A76 and E73 backbone atoms. Y198, A76, and E73 contacts are conserved in WT runs 1 and 3. Conversely in WT run 2, in which states 2 and 3 of the MRAS WT/SHOC WT interface are most often sampled, the displacement of Y198 and MRAS switch II results in an altered hydrogen bonding network, where Y198 interfaces MRAS mostly through water-mediated interactions to D43, P44, T45, or Q71. a. Representative structures of the SHOC2-MRAS interface from simulated SHOC2 WT/MRAS WT/PP1Cα WT ternary complex. Three distinct states of the MRAS (dark blue) - SHOC2 (purple) interface are observed from the clustered MRAS WT/SHOC2 WT/PP1Cα WT trajectories and aligned to the crystal structure of the ternary SHOC2 M173I (pale green), MRAS Q71R (grey), PP1Cα (not shown) complex. (1) In state 1, SHOC2 M173 pushes the sidechain of MRAS M77 away from the interface, while leaving SHOC2 Y198 unperturbed. (2) In state 2, M173 is buried, resulting in the displacement of Y198, altering the hydrogen bonding network compared to that of the crystal structure. (3) In state 3, M173 directly pushes the MRAS switch II loop away from the SHOC2 interface. b. Frequency of observed contacts with SHOC2 Y198 across replicate MD simulations. Y198 hydrogen bonds between E73 and A76 are lost in the second SHOC2 WT/MRAS WT/PP1Cα WT trajectory. Replacement contacts between Y198 and MRAS residues are mostly water-mediated (indicated as ‘wat’).
Extended Data Fig. 6
Extended Data Fig. 6. SHOC2 mutations do not affect protein stability or localization in cells.
a. Flow cytometry analysis of SHOC2-EGFP-chy-mCherry transfected 293T cells to compare SHOC2-EGFP abundance/stability between the various GOF and LOF variants in cells. (i) Flow cytometry SHOC2-EGFP vs mCherry dot plot, overlay of SHOC WT and non-transfected control, mCherry+ gate is indicated. (ii) mCherry+ cells were selected to extract the ratio of EGFP vs mCherry signal per cell, and for both signals the respective median EGFP or mCherry signal from non-transfected cells (grey population) was subtracted as background (BG) (EGFP-BG)/(mCherry-BG) and plotted as histogram normalized to mode to account for various cell numbers between WT and R200E transfected cells. (iii) Bar graph representing rel. SHOC2-EGFP abundance of indicated mutants normalized to SHOC2 WT, data represents mean +/− SD of extracted median (EGFP-BG)/(mCherry-BG) values as described in ii from N = 4 independent transfections (individual values per repeat plotted on bar represent median from 1636 < mCherry+ cells < 40098, Avg 20460 cells). b. Representative immunofluorescence images of SHOC2-EGFP-chy-mCherry transfected 293T cells with WT and corresponding SHOC2 mutants. Overlay images of mCherry and EGFP channels (left) and EGFP channel only images (right) for SHOC2 variants are shown, size bar corresponds to 15 µm for all images. Results are representative of three independent transfections for each condition.
Extended Data Fig. 7
Extended Data Fig. 7. The RAS-PP1C interface favours MRAS while N/KRAS compensate for MRAS loss.
a. RAS and RAS-related proteins sequence alignment. Amino acid sequences of human RAS-related proteins MRAS Q71R, RRAS, RRAS2 and aligned with KRAS, NRAS and HRAS. Identically conserved residues are shaded red. The site of the Q71R mutation in the present structure is shaded yellow. Secondary structure elements of MRAS are indicated above the alignment. Symbols above the alignment indicate residues that in the holoenzyme complex lie in the interface with SHOC2 (yellow stars) or PP1Cα (blue diamonds). b. SHOC2, PP1Cα, and KRAS (GppNHp) were mixed in a 1:1:1.2 molar ratio and subjected to size-exclusion chromatography using a Superdex 200 Increase 10/300 GL column. In the absence of MRAS, the ternary complex formed with KRAS (left). SHOC2, PP1Cα, MRAS and KRAS were combined (right) in a 1:1:1.2:1.2 molar ratio, respectively, before SEC analysis. MRAS and KRAS were both charged with non-hydrolyzable GTP analogue GppNHp prior to combining with SHOC2 and PP1C. The resulting UV280 absorbance trace is shown in the top panel, and Coomassie-stained SDS-PAGE gel of the corresponding fractions is shown in the lower panel. Note that the ternary complex assembles with MRAS, while KRAS and excess MRAS elutes as expected for the unbound GTPases. The data are representative of two independent experiments. c. A scatter plot with the dependency score of RAF1 on the x axis and the dependency score of SHOC2 on the y axis. The dashed lines indicate a dependency score of zero (no dependency). A highly negative dependency score implies that a given cell line is highly dependent on that gene. Cell lines dependent on both SHOC2 and RAF1 are indicated in the lower left of the scatter plot. d. Western Blot analysis of MiaPaca2 parental cells or SHOC2 KO cells treated with trametinib (10 nM) for 24 h and siRNA targeting MRAS (100 nM) for 48 h. Densitometry quantification of pCRAF(S259)/CRAF and pERK/ERK levels from Western Blot analysis normalized to trametinib treated parental cells. Samples were derived from the same experiment and blots were processed in parallel. Representative images shown are from two independent experiments.

Comment in

References

    1. Simanshu DK, Nissley DV, McCormick F. RAS proteins and their regulators in human disease. Cell. 2017;170:17–33. - PMC - PubMed
    1. Hobbs GA, Der CJ, Rossman KL. RAS isoforms and mutations in cancer at a glance. J. Cell Sci. 2016;129:1287–1292. - PMC - PubMed
    1. Lavoie H, Therrien M. Regulation of RAF protein kinases in ERK signalling. Nat. Rev. Mol. Cell Biol. 2015;16:281–298. - PubMed
    1. Park E, et al. Architecture of autoinhibited and active BRAF–MEK1–14-3-3 complexes. Nature. 2019;575:545–550. - PMC - PubMed
    1. Rodriguez-Viciana P, et al. A phosphatase holoenzyme comprised of Shoc2/Sur8 and the catalytic subunit of PP1 functions as an M-Ras effector to modulate Raf activity. Mol. Cell. 2006;22:217–230. - PubMed

MeSH terms