

Declines in Pregnancies among U.S. Adolescents from 2007 to 2017: Behavioral Contributors to the Trend
- PMID: 35830926
- PMCID: PMC9701145
- DOI: 10.1016/j.jpag.2022.07.008
Declines in Pregnancies among U.S. Adolescents from 2007 to 2017: Behavioral Contributors to the Trend
Abstract
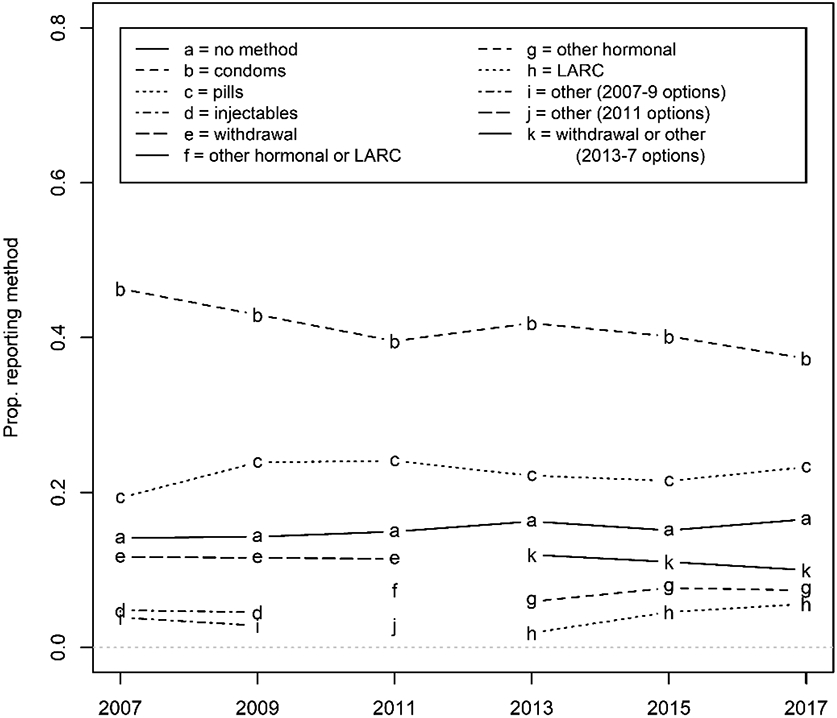
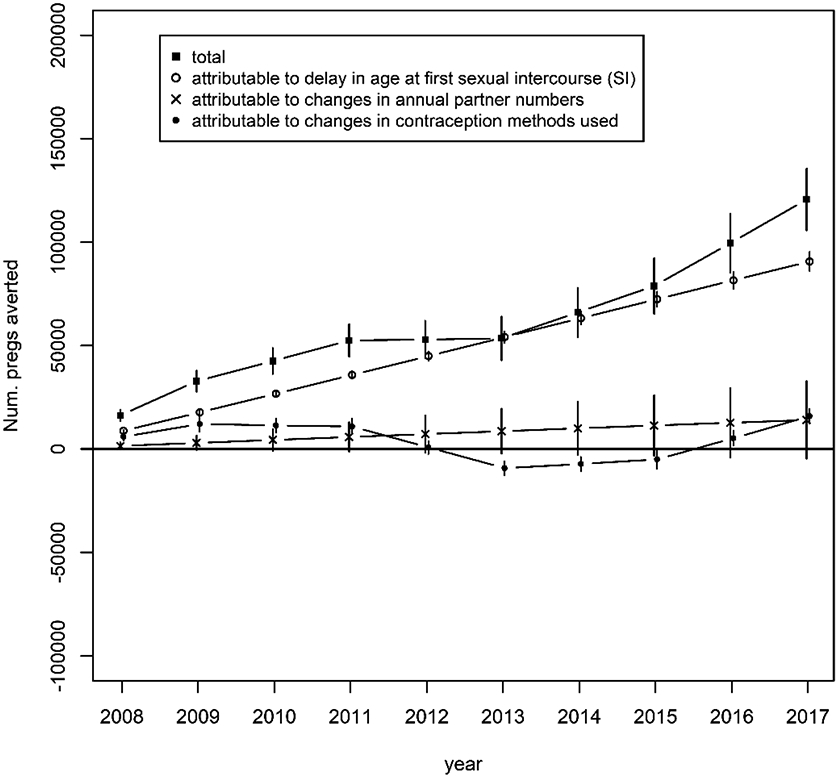
Study objectives: Adolescent pregnancies and births in the United States have undergone dramatic declines in recent decades. We aimed to estimate the contribution of changes in 3 proximal behaviors to these declines among 14- to 18-year-olds for 2007-2017: 1) delays in age at first sexual intercourse, 2) declines in number of sexual partners, and 3) changes in contraceptive use, particularly uptake of long-acting reversible contraception (LARC).
Design: We adapted an existing iterative dynamic population model and parameterized it using 6 waves of the Centers for Disease Control and Prevention's Youth Risk Behavior Survey. We compared pregnancies from observed behavioral trends with counterfactual scenarios that assumed constant behaviors over the decade. We calculated outcomes by cause, year, and age.
Results: We found that changes in these behaviors could explain pregnancy reductions of 496,200, 78,500, and 40,700 over the decade, respectively, with total medical and societal cost savings of $9.71 billion, $1.54 billion, and $796 million. LARC adoption, particularly among 18-year-olds, could explain much of the improvement from contraception use. The 3 factors together did not fully explain observed birth declines; adding a 50% decline in sex acts per partner did.
Conclusions: Delays in first sexual intercourse contributed the most to declining births over this decade, although all behaviors considered had major effects. Differences from earlier models could result from differences in years and ages covered. Evidence-based teen pregnancy prevention programs, including comprehensive sex education, youth-friendly reproductive health services, and parental and community support, can continue to address these drivers and reduce teen pregnancy.
Keywords: Adolescents; Contraception; Pregnancies; Sexual behavior; United States.
Copyright © 2022. Published by Elsevier Inc.
Conflict of interest statement
ROLE OF THE FUNDING SOURCE AND CONFLICTS OF INTEREST
As part of the cooperative agreement model, research scientists affiliated with the funder (the US Centers for Disease Control and Prevention) contributed to the design of the study through a series of collaborative meetings. They also approved the decision to submit the manuscript for publication, and CDC staff scientists reviewed and approved the final manuscript. Those individuals who played significant roles in the scientific development of the project are listed as co-authors. The corresponding author (Steven M. Goodreau) wrote the first draft of the manuscript. The authors report no real or perceived conflicts of interest.
Figures

Similar articles
-
School-based interventions for improving contraceptive use in adolescents.Cochrane Database Syst Rev. 2016 Jun 29;2016(6):CD012249. doi: 10.1002/14651858.CD012249. Cochrane Database Syst Rev. 2016. PMID: 27353385 Free PMC article.
-
Theory-based interventions for contraception.Cochrane Database Syst Rev. 2016 Nov 23;11(11):CD007249. doi: 10.1002/14651858.CD007249.pub5. Cochrane Database Syst Rev. 2016. PMID: 27879980 Free PMC article.
-
Brief educational strategies for improving contraception use in young people.Cochrane Database Syst Rev. 2016 Mar 30;3(3):CD012025. doi: 10.1002/14651858.CD012025.pub2. Cochrane Database Syst Rev. 2016. PMID: 27027480 Free PMC article.
-
Behavioral interventions for improving contraceptive use among women living with HIV.Cochrane Database Syst Rev. 2013 Jan 31;(1):CD010243. doi: 10.1002/14651858.CD010243.pub2. Cochrane Database Syst Rev. 2013. Update in: Cochrane Database Syst Rev. 2016 Aug 09;(8):CD010243. doi: 10.1002/14651858.CD010243.pub3. PMID: 23440846 Updated.
-
Behavioral interventions for improving contraceptive use among women living with HIV.Cochrane Database Syst Rev. 2016 Aug 9;2016(8):CD010243. doi: 10.1002/14651858.CD010243.pub3. Cochrane Database Syst Rev. 2016. PMID: 27505053 Free PMC article.
References
-
- Maddow-Zimet I, Kost K, Finn S. Pregnancies, births and abortions in the United States, 1973–2016: National and state trends by age. https://www.guttmacher.org/report/pregnancies-births-abortions-in-united.... New York: Guttmacher Institute, 2020.
MeSH terms
Grants and funding
LinkOut - more resources
Full Text Sources
Medical
