. 2022 Jul 13;13(1):4046.
doi: 10.1038/s41467-022-31519-6.

Single cell sequencing identifies clonally expanded synovial CD4+ TPH cells expressing GPR56 in rheumatoid arthritis

Affiliations

Single cell sequencing identifies clonally expanded synovial CD4+ TPH cells expressing GPR56 in rheumatoid arthritis

Alexandra Argyriou et al. Nat Commun. .

Abstract

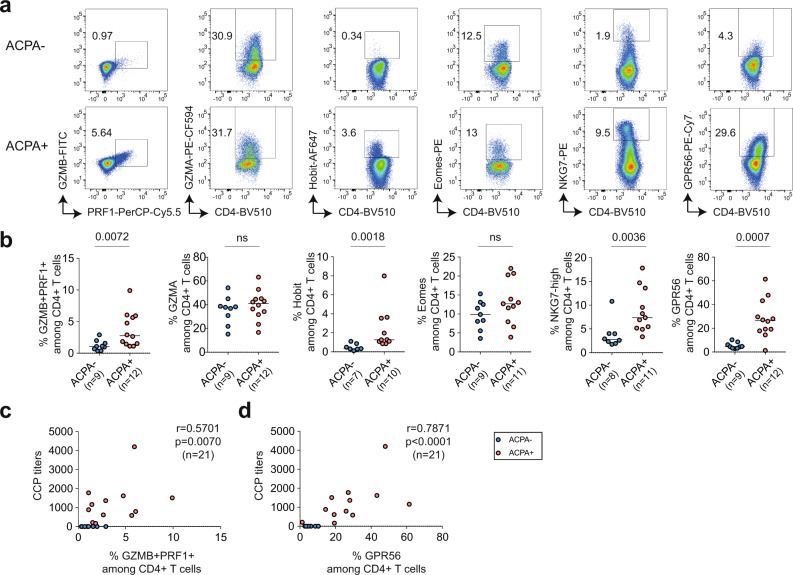
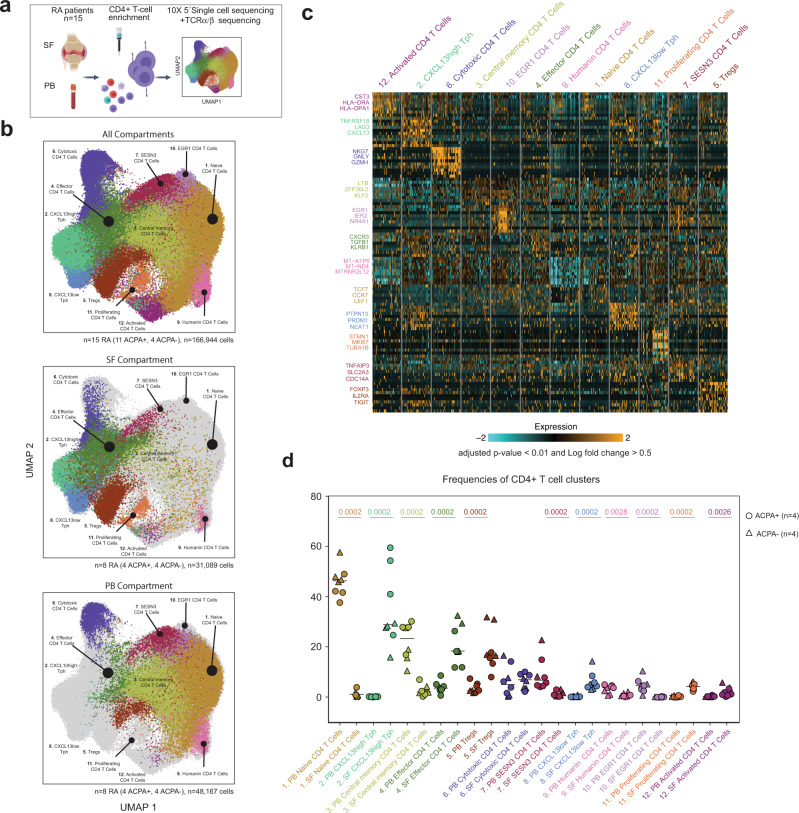
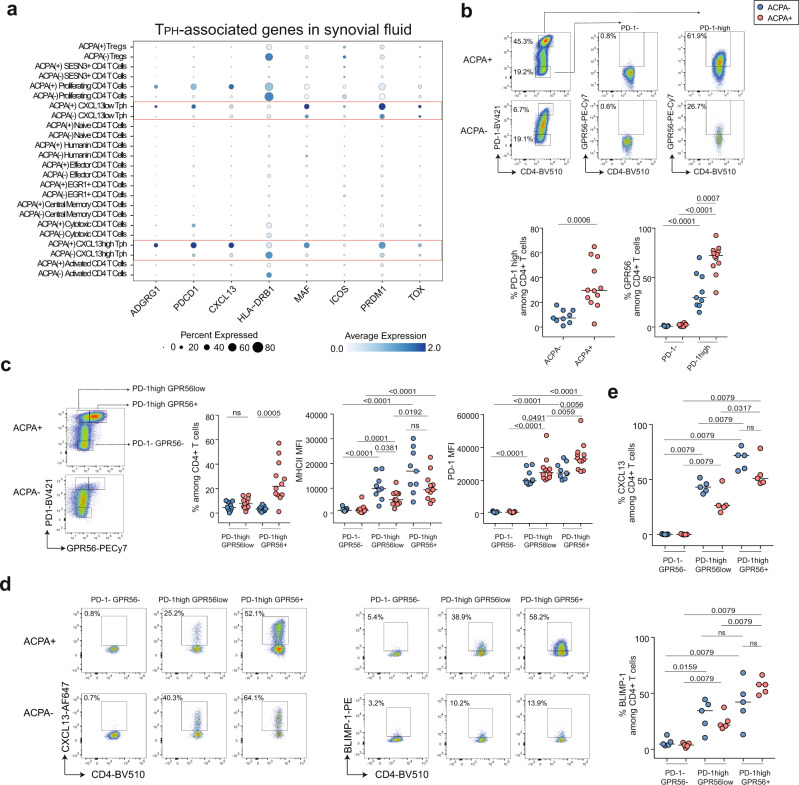
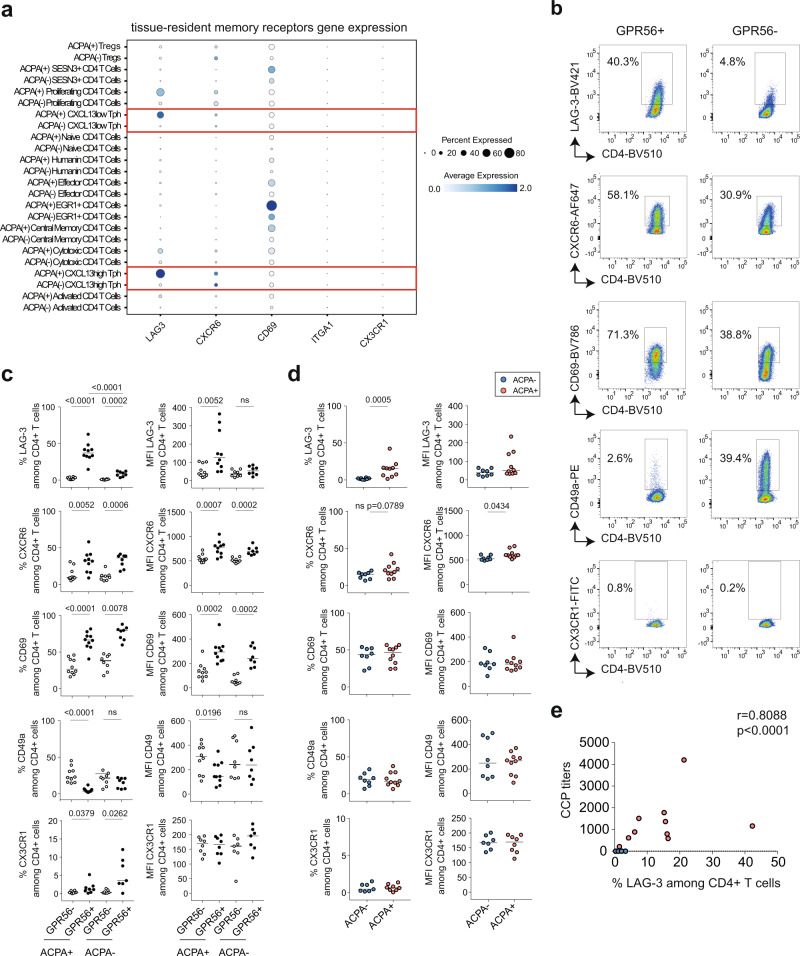
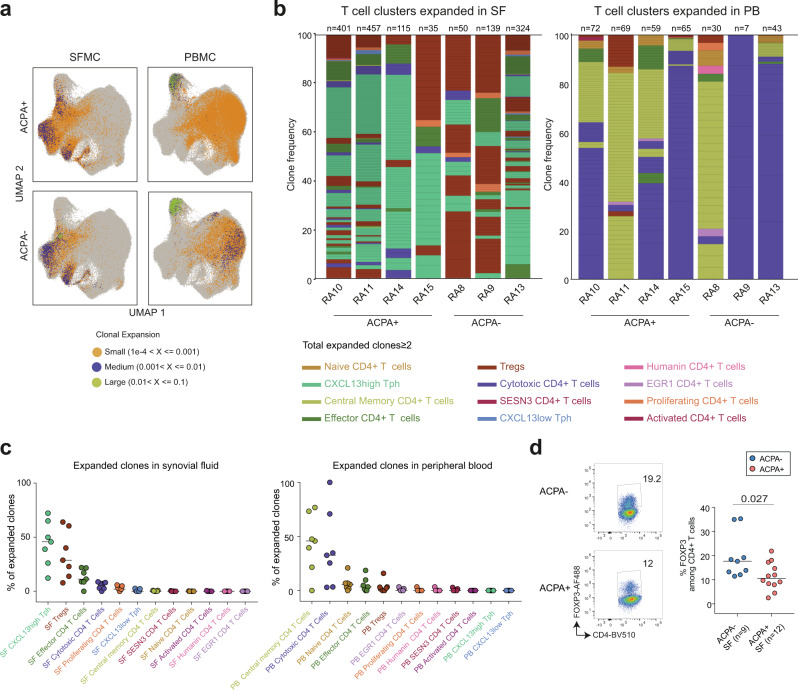
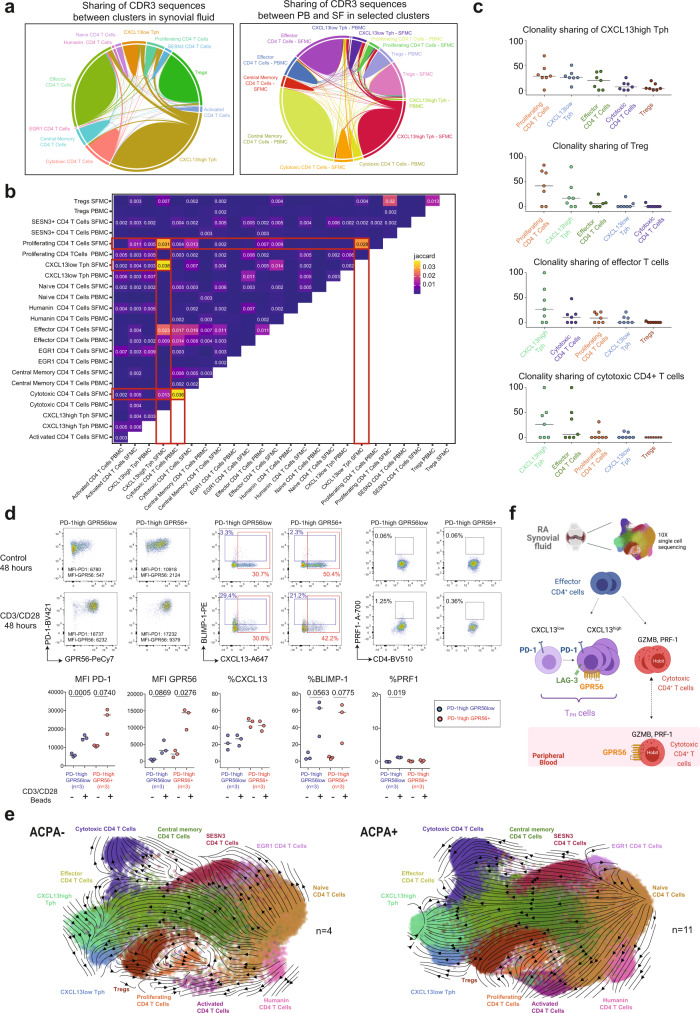
Rheumatoid arthritis (RA) is an autoimmune disease affecting synovial joints where different CD4+ T cell subsets may contribute to pathology. Here, we perform single cell sequencing on synovial CD4+ T cells from anti-citrullinated protein antibodies (ACPA)+ and ACPA- RA patients and identify two peripheral helper T cell (TPH) states and a cytotoxic CD4+ T cell subset. We show that the adhesion G-protein coupled receptor 56 (GPR56) delineates synovial CXCL13high TPH CD4+ T cells expressing LAG-3 and the tissue-resident memory receptors CXCR6 and CD69. In ACPA- SF, TPH cells display lower levels of GPR56 and LAG-3. Further, most expanded T cell clones in the joint are within CXCL13high TPH CD4+ T cells. Finally, RNA-velocity analyses suggest a common differentiation pathway between the two TPH clusters and effector CD4+ T cells. Our study provides comprehensive immunoprofiling of the synovial CD4+ T cell subsets in ACPA+ and ACPA- RA.


Conflict of interest statement

A.A., A.L., C.G., A.H.H., A.vV., V.M., and K.C. declare no competing interests. M.H.W., S.M.C., K.K., and A.W. are employees of Pfizer, Inc, Cambridge, MA 02139, United States.

Figures

Fig. 1
Fig. 1. Cytotoxic CD4+ T-cell frequency in synovial fluid of ACPA− and ACPA+ RA patients.
a Representative flow cytometry dot plot staining of effector molecules, receptors and transcription factors associated with cytotoxic functions in CD4+ T cells from synovial fluid (SF) from ACPA− (upper panel) and ACPA+ (lower panel) RA patients, quantified in b, (ACPA−, n = 7–9) (ACPA+ , n = 10–12). Line represents median, two-tailed Mann–Whitney U test, P = 0.0072 (%GZMB+PRF1+), ns (%GZMA), P = 0.0018 (%Hobit), ns (%Eomes), P = 0.0036 (%NKG7-high), P = 0.0007 (%GPR56), ns: not significant. c Correlation between the frequency of GZMB+ PRF1+ in CD4+ T cells in SF and the level of serum anti-CCP (cyclic citrullinated peptide) antibodies, n = 21, Spearman two-tailed test, P = 0.0070. d Correlation between the frequency of GPR56 in CD4+ T cells in SF and the level of anti-CCP (cyclic citrullinated peptide) antibodies, n = 21, Spearman two-tailed test, P < 0.0001. ad Data are from a pool of nine independent experiments where a circle is a single replicate. Blue dots indicate ACPA− RA SF and red dots indicate ACPA+ RA SF.
Fig. 2
Fig. 2. Single-cell RNA sequencing of CD4+ T cells from SF and PB of RA patients.
a Technical workflow including CD4+ T-cell enrichment and 10X 5′ single-cell sequencing coupled to TCRαβ sequencing on 15 paired PB and SF from RA patients (11 ACPA+, 4 ACPA−). b UMAP displaying 12 CD4+ T-cell clusters in combined SF and PB (upper panel, n = 15 RA (11 ACPA+, 4 ACPA−), n = 166,944 cells), SF (middle panel, n = 8 RA (4 ACPA+, 4 ACPA−), n = 31,089 cells) and PB (lower panel, n = 8 RA (4 ACPA+, 4 ACPA−), n = 48,167 cells). c Heatmap showing selected differentially-expressed genes (DEGs) in the different CD4+ T-cell clusters in combined PB and SF, P < 0.01, model-based analysis of single-cell transcriptomics (MAST). d Frequencies of CD4+ T-cell clusters in PB and SF from n = 8 RA patients (4 ACPA+, 4 ACPA−). Circle indicates ACPA+ RA patients, triangle indicates ACPA− patients. Line represents median, two-tailed Mann–Whitney U test.
Fig. 3
Fig. 3. GPR56 expression on peripheral helper CD4+ T cells in ACPA+ and ACPA− RA SF.
a 2-D dot plots showing the expression of selected genes in the different CD4+ T-cell clusters in ACPA+ and ACPA− SF (circle size indicates the percentage of cells expressing, color intensity indicates average expression) (n = 4 ACPA+, n = 4 ACPA− RA SF). b Representative flow cytometry dot plot of GPR56 expression within PD-1high (TPH) and PD-1 (non-TPH) CD4+ T cells in ACPA+ (upper panel) and ACPA− (lower panel) RA SF, quantified in n = 9 ACPA− SF and n = 12 ACPA+ SF, P = 0.0006 (%PD-1high), P < 0.0001 (%GPR56 in PD-1 versus PD-1high in ACPA+), P < 0.0001 (%GPR56 in PD-1 versus PD-1high in ACPA−), P = 0.0007 (%GPR56 in PD-1high in ACPA− versus ACPA+). c Left panel, representative flow cytometry dot plot of the two TPH states (PD-1highGPR56low and PD-1highGPR56+) and quantification of their frequency in SF, ns (%PD-1highGPR56low), P = 0.0005 (%PD-1highGPR56+) in ACPA+ versus ACPA−. Middle panel, MHC-II MFI: P < 0.0001 (PD-1GPR56 versus PD-1highGPR56low), P < 0.0001 (PD-1GPR56 versus PD-1highGPR56+) in ACPA− SF; P = 0.0001 (PD-1GPR56 versus PD-1highGPR56low), P < 0.0001 (PD-1GPR56 versus PD-1highGPR56+), P = 0.0192 (PD-1highGPR56low versus PD-1highGPR56+) in ACPA+ SF; P = 0.0381 (PD-1highGPR56low in ACPA− versus ACPA+), ns (PD-1highGPR56+ in ACPA− versus ACPA+). Right panel, PD-1 MFI: P < 0.0001 (PD-1GPR56 versus PD-1highGPR56low), P < 0.0001 (PD-1GPR56 versus PD-1highGPR56+) in ACPA− SF; P < 0.0001 (PD-1GPR56 versus PD-1highGPR56low), P < 0.0001 (PD-1GPR56 versus PD-1highGPR56+), P = 0.0059 (PD-1highGPR56low versus PD-1highGPR56+) in ACPA+ SF; P = 0.0491 (PD-1highGPR56low in ACPA− versus ACPA+), P = 0.0056 (PD-1highGPR56+ in ACPA− versus ACPA+). (n = 9 ACPA−, n = 11 ACPA+, MHC-II) (n = 9 ACPA−, n = 12 ACPA+, PD-1). d Representative flow cytometry dot plots of CXCL13 and BLIMP-1 expression within PD-1GPR56 (non-TPH) and PD-1highGPR56low and PD-1highGPR56+ (2 TPH states) in CD4+ T cells in ACPA+ and ACPA− RA SF, quantified in e in n = 5 ACPA− SF and n = 5 ACPA+ SF. Upper panel, %CXCL13: P = 0.0079 (PD-1GPR56 versus PD-1highGPR56low), P = 0.0079 (PD-1GPR56 versus PD-1highGPR56+), P = 0.0079 (PD-1highGPR56low versus PD-1highGPR56+) in ACPA− SF; P = 0.0079 (PD-1GPR56 versus PD-1highGPR56low), P = 0.0079 (PD-1GPR56 versus PD-1highGPR56+), P = 0.0317 (PD-1highGPR56low versus PD-1highGPR56+) in ACPA+ SF; ns (PD-1highGPR56+ in ACPA− versus ACPA+). Lower panel, %BLIMP-1: P = 0.0159 (PD-1GPR56 versus PD-1highGPR56low), P = 0.0079 (PD-1GPR56 versus PD-1highGPR56+), ns (PD-1highGPR56low versus PD-1highGPR56+) in ACPA− SF; P = 0.0079 (PD-1GPR56 versus PD-1highGPR56low), P = 0.0079 (PD-1GPR56 versus PD-1highGPR56+), P = 0.0079 (PD-1highGPR56low versus PD-1highGPR56+) in ACPA+ SF; ns (PD-1highGPR56+ in ACPA− versus ACPA+). b, c Data are from a pool of nine independent experiments where a circle is a single replicate. e Data are from a pool of five independent experiments where a circle is a single replicate. b, c, e Line represents median, two-tailed Mann–Whitney U test. Blue dots indicate ACPA− RA SF and red dots indicate ACPA+ RA SF. ns not significant, MFI mean fluorescence intensity.
Fig. 4
Fig. 4. Tissue-resident memory receptors on CD4+ T cells in ACPA+ and ACPA− RA SF.
a 2-D dot plots showing the expression of selected genes in the different CD4+ T-cell clusters in ACPA+ and ACPA− SF (circle size indicates the percentage of cells expressing, color intensity indicates average expression) (n = 4 ACPA+, n = 4 ACPA− RA SF). b Representative flow cytometry dot plots showing the expression of LAG-3, CXCR6, CD69, CD49a, and CX3CR1 on GPR56+ and GPR56 CD4+ T cells in ACPA+ RA, quantified in ACPA+ and ACPA− SF in c) P < 0.0001 (%LAG-3), P = 0.0052 (%CXCR6), P < 0.0001 (%CD69), P < 0.0001 (%CD49a), P = 0.0379 (%CX3CR1) in GPR56 versus GPR56+ in ACPA+ SF; P = 0.0002 (%LAG-3), P = 0.0006 (%CXCR6), P = 0.0078 (%CD69), ns (%CD49a), P = 0.0262 (%CX3CR1) in GPR56 versus GPR56+ in ACPA− SF; P < 0.0001 (%LAG-3) in GPR56+ in ACPA− versus ACPA+; P = 0.0052 (MFI LAG-3), P = 0.0007 (MFI CXCR6), P = 0.0002 (MFI CD69), P = 0.0196 (MFI CD49a) in GPR56 versus GPR56+ in ACPA+ SF; ns (MFI LAG-3), P = 0.0002 (MFI CXCR6), P = 0.0002 (MFI CD69), ns (MFI CD49a) in GPR56 versus GPR56+ in ACPA − SF; (n = 10 ACPA+, n = 8 ACPA−, LAG-3, CXCR6, CD69, CD49a) (n = 8 ACPA+, n = 7 ACPA−, CX3CR1). White dots indicate GPR56 CD4+ T cells and black dots indicate GPR56+ CD4+ T cells. d Expression of LAG-3, CXCR6, CD69, CD49a and CX3CR1 on CD4+ T cells in SF; P = 0.0005 (%LAG-3 in ACPA− versus ACPA+); (n = 8 ACPA−, n = 10 ACPA+, LAG-3, CXCR6, CD69, CD49a) and (n = 7 ACPA−, n = 8 ACPA+, CXC3CR1). Blue dots indicate ACPA− RA SF and red dots indicate ACPA+ RA SF. c, d Line represents median, two-tailed Mann–Whitney U test. Data are from a pool of eight independent experiments where a circle is a single replicate. e Correlation between the frequency of LAG-3 in CD4+ T cells in RA SF and the levels of anti-CCP (cyclic citrullinated peptide) antibodies (n = 18), P < 0.0001, Spearman two-tailed test. ns not significant.
Fig. 5
Fig. 5. Clonally expanded CD4+ T cells in RA.
a UMAP plots showing expanded clones in ACPA+ (n = 4) and ACPA− (n = 4) RA PB and SF, colored based on sample size. Orange dots indicate small clones (1e-4 < X ≤0.001), purple dots indicate medium size clones (0.001 < X ≤0.01), green dots indicate large size clones (0.01 < X ≤0.1). Each dot displays a cell. b Stacked barplots displaying the phenotype of the SF (left) and PB (right) expanded clones (n ≥ 2 cells) in each RA patient, quadrant represents an individual clone, total number of clones per patient are indicated above each column. c Frequency of expanded clones within each CD4+ T-cell cluster in SF (left panel) and PB (right panel) for each RA patient (n = 4 ACPA+, 3 ACPA−). d Frequency of FOXP3+ cells among CD4+ T cells in ACPA− (n = 9) and ACPA+ (n = 12) RA SF, P = 0.027. Data are from a pool of nine independent experiments where a circle is a single replicate. Blue dots indicate ACPA− RA SF and red dots indicate ACPA+ RA SF. Line represents median, two-tailed Mann–Whitney U test.
Fig. 6
Fig. 6. CD4+ T-cell subsets interconnectivity.
a Chord diagrams showing the interconnectivity between CD4+ T cells sharing the same CDR3 (paired TCRα, and TCRβ chains) amino acid sequences within CD4+ T-cell clusters in RA SF (left panel) and between compartments in selected clusters (right panel) (n = 4 ACPA−, n = 4 ACPA+). b Jaccard overlap quantifications for clonal overlap between cell clusters across compartments (n = 4 ACPA−, n = 4 ACPA+). c Percentage of shared expanded clones (n ≥ 2 cells) shared with selected subsets among total cell clones, n = 7 RA patients (n = 4 ACPA+, 3 ACPA−). d Representative flow cytometry dot plots showing the expression of PD-1, GPR56, CXCL13, BLIMP-1, and PRF1 in control (upper panel) or after 48 h CD3/CD28-beads activation of TPH cell states (lower panel) (PD-1highGPR56low and PD-1highGPR56+ from ACPA+ SF), quantified in n = 3 ACPA+ RA patients. d Data are from a pool of three independent experiments where a circle is a single replicate. Line indicates median, two-tailed Wilcoxon paired test, P = 0.0005 (MFI PD-1 on PD-1highGPR56low after activation), P = 0.0740 (MFI PD-1 on PD-1highGPR56+ after activation), P = 0.0869 (MFI GPR56 on PD-1highGPR56low after activation), P = 0.0276 (MFI GPR56 on PD-1highGPR56+ after activation), P = 0.0563 (% BLIMP-1 on PD-1highGPR56low after activation), P = 0.0775 (% BLIMP-1 on PD-1highGPR56+ after activation), P = 0.019 (% PRF1 on PD-1highGPR56low after activation). e Velocity plots showing the phenotype directionality between the different CD4+ T-cell clusters in RA split in ACPA− (left panel) and ACPA+ (right panel) (n = 4 ACPA−, n = 11 ACPA+, pool PB and SF). f Graphical summary showing the proposed developmental link between the two TPH subsets, effector and cytotoxic CD4+ T cells in SF as well as the identified receptors.

References

    1. Kroot EJ, et al. The prognostic value of anti-cyclic citrullinated peptide antibody in patients with recent-onset rheumatoid arthritis. Arthritis Rheum. 2000;43:1831–1835. doi: 10.1002/1529-0131(200008)43:8<1831::AID-ANR19>3.0.CO;2-6. - DOI - PubMed
    1. Malmstrom V, Catrina AI, Klareskog L. The immunopathogenesis of seropositive rheumatoid arthritis: from triggering to targeting. Nat. Rev. Immunol. 2017;17:60–75. doi: 10.1038/nri.2016.124. - DOI - PubMed
    1. Smolen JS, et al. Rheumatoid arthritis. Nat. Rev. Dis. Prim. 2018;4:18001. doi: 10.1038/nrdp.2018.1. - DOI - PubMed
    1. Padyukov L, et al. A genome-wide association study suggests contrasting associations in ACPA-positive versus ACPA-negative rheumatoid arthritis. Ann. Rheum. Dis. 2011;70:259–265. doi: 10.1136/ard.2009.126821. - DOI - PMC - PubMed
    1. Musters A, et al. In rheumatoid arthritis, synovitis at different inflammatory sites is dominated by shared but patient-specific T cell clones. J. Immunol. 2018;201:417–422. doi: 10.4049/jimmunol.1800421. - DOI - PubMed

Publication types

MeSH terms

Substances