. 2022 Jul 13;13(1):3906.
doi: 10.1038/s41467-022-31119-4.

Central tropical Pacific convection drives extreme high temperatures and surface melt on the Larsen C Ice Shelf, Antarctic Peninsula

Affiliations

Central tropical Pacific convection drives extreme high temperatures and surface melt on the Larsen C Ice Shelf, Antarctic Peninsula

Kyle R Clem et al. Nat Commun. .

Abstract

Northern sections of the Larsen Ice Shelf, eastern Antarctic Peninsula (AP) have experienced dramatic break-up and collapse since the early 1990s due to strong summertime surface melt, linked to strengthened circumpolar westerly winds. Here we show that extreme summertime surface melt and record-high temperature events over the eastern AP and Larsen C Ice Shelf are triggered by deep convection in the central tropical Pacific (CPAC), which produces an elongated cyclonic anomaly across the South Pacific coupled with a strong high pressure anomaly over Drake Passage. Together these atmospheric circulation anomalies transport very warm and moist air to the southwest AP, often in the form of "atmospheric rivers", producing strong foehn warming and surface melt on the eastern AP and Larsen C Ice Shelf. Therefore, variability in CPAC convection, in addition to the circumpolar westerlies, is a key driver of AP surface mass balance and the occurrence of extreme high temperatures.


Conflict of interest statement

The authors declare no competing interests.

Figures
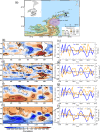
Fig. 1
Fig. 1. Study area and interannual climate variability governing Larsen C surface melt.
a Map of the AP region showing the northeast AP weather stations, ETOPO1 topography, locations of the former Larsen A and Larsen B Ice Shelves and the remaining Larsen C Ice Shelf, and the region used to calculate Larsen C surface melt (pink polygon). (left) The DJFM detrended correlations (shaded), 1991–2015, of Larsen C surface melt with b SST, d OLR, f 250 hPa streamfunction, h 500 hPa geopotential height. (right) The DJFM timeseries of (blue) Larsen C surface melt with (orange) c the SOI, e CPAC OLR anomalies, g Marshall (2003) SAM index, and i Drake Z500 anomalies. The bold black contours in (b, d, f, h) denote correlations statistically significant at p < 0.10. The CPAC OLR and Drake Z500 regions are denoted by green dashed boxes in (d) and (h), respectively. The linear trend lines of each time series in (c, e, g, i) are shown as a dashed line.
Fig. 2
Fig. 2. The atmospheric circulation anomalies associated with CPAC convection compared to Larsen C surface melt.
The DJFM detrended correlation (shaded), 1991–2015, of (left; (a, c, e) Larsen C surface melt and (right; (b, d, f) CPAC OLR with a, b 250 hPa streamfunction, c, d 500 hPa geopotential height, and e, f vertically integrated moisture flux divergence. Correlations significant at p < 0.10 are denoted by bold black contours. CPAC OLR correlations are multiplied by −1 to reflect anomalies associated with enhanced CPAC convection. Dashed black arrows in a, b schematically show the path of Rossby wave propagation. Solid black arrows in c, d schematically show anomalous winds across the AP associated with the Drake Passage anticyclonic circulation anomaly.
Fig. 3
Fig. 3. The CPAC-forced circulation anomalies driving extreme high temperatures on the eastern Antarctic Peninsula.
(top) The 24 March 2015 and (bottom) 6 February 2020 record-high temperature events. a The OLR (shaded), 200 hPa streamfunction (contoured) and 200 hPa stationary wave flux (vectors) anomalies and b surface air temperature (T2m, shaded), MSLP (contoured), and 10 m wind (vectors) anomalies for 22–26 March 2015, and c the vertically integrated moisture flux (IVT; shaded, vectors), MSLP (contours), and outline of the landfalling AR (green contour; IVT exceeding 85th percentile) and AR axis (yellow line; a pathway of maximum IVT) (Methods) at 06 UTC 24 March 2015. d, e are as in a, b except for 4–8 February 2020 and d is for the 850 hPa level, and (f) is as in (c) except for 06 UTC 6 February 2020. The CPAC OLR region is denoted with a black box in the upper left corner of (a, d), and the location of the high and low-pressure centers is given as an “H” and “L”, respectively, in (b, e).
Fig. 4
Fig. 4. The simulated atmospheric response to CPAC convection.
The difference in CPAC perturbation minus control simulated 30-year climatologies for DJF. The difference in a total precipitation (color shaded), 200 hPa streamfunction (contour), and 200 hPa wave flux (vectors); b 500 hPa geopotential height (shaded) and 200 hPa divergent wind (vectors); c total precipitation, and d surface air temperature. In a, the 30-year climatological 300 hPa zonal wind from the control run is shaded in gray and the black circles schematically show the two regions of divergence in the exit region of the Indo-Atlantic jet streak and entrance region of the Pacific jet streak. In a, b, schematic arrows are drawn in black showing the two wave train paths. In bd, bold black contours denote differences that are statistically significant at p < 0.10, and vectors in (b) are drawn only if at least one component of the divergent wind is significant at p < 0.10.
Fig. 5
Fig. 5. The local synoptic conditions governing CPAC convection.
The detrended DJFM (left) CPAC OLR correlations and (right) standardized CPAC OLR regressions with a, b OLR, c, d MSLP, e, f 925 hPa temperature advection, and g, h SST during 1991–2015. Also shown on the right are regressions with 10 m wind for (b, d, h) and 925 hPa wind for (f). The correlations/regressions are multiplied by −1 to show conditions associated with enhanced CPAC convection. The bold contours denote correlations and regressions significant at p < 0.10, and wind vectors are shown only if at least one regression component is significant at p < 0.10. The CPAC area (10–15°S, 170–165°W) is denoted by the black box, and the position of the surface low-pressure center and its cold front are denoted by an “L” and curved black line, respectively.
Fig. 6
Fig. 6. CPAC convection a key driver of extreme atmospheric rivers on the Antarctic Peninsula.
ac Timeseries of (blue) the total number of DJFM extreme landfalling ARs alongside the (orange) DJFM a Larsen C total surface melt, b Drake Z500, and c CPAC OLR. Inset is the correlation coefficient between the two timeseries. d Composite anomaly of AR frequency for anomalous CPAC convection days (daily CPAC OLR ≤ −0.5σ) showing the percentage difference relative to the DJFM AR frequency climatology. Stippling in (d) denotes anomalies significant at p < 0.10.

References

    1. Vaughan DG, Doake CSM. Recent atmospheric warming and retreat of ice shelves on the Antarctic Peninsula. Nature. 1996;379:328–331. doi: 10.1038/379328a0. - DOI
    1. Scambos, T., Hulbe, C. & Fahnestock, M. in Antarctic Research Series (eds Domack, E. et al.) (American Geophysical Union, 2003).
    1. Ingels, J. et al. Antarctic ecosystem responses following ice‐shelf collapse and iceberg calving: Science review and future research. WIREs Clim. Change12, e682 (2021).
    1. Rott H, Skvarca P, Nagler T. Rapid collapse of Northern Larsen ice shelf, Antarctica. Science. 1996;271:788–792. doi: 10.1126/science.271.5250.788. - DOI
    1. Shepherd A. Larsen ice shelf has progressively thinned. Science. 2003;302:856–859. doi: 10.1126/science.1089768. - DOI - PubMed

Publication types