Review
. 2022 Jul 13;11(1):222.
doi: 10.1038/s41377-022-00871-z.

Nanocomposites based on lanthanide-doped upconversion nanoparticles: diverse designs and applications

Affiliations
Review

Nanocomposites based on lanthanide-doped upconversion nanoparticles: diverse designs and applications

Kaimin Du et al. Light Sci Appl. .

Abstract

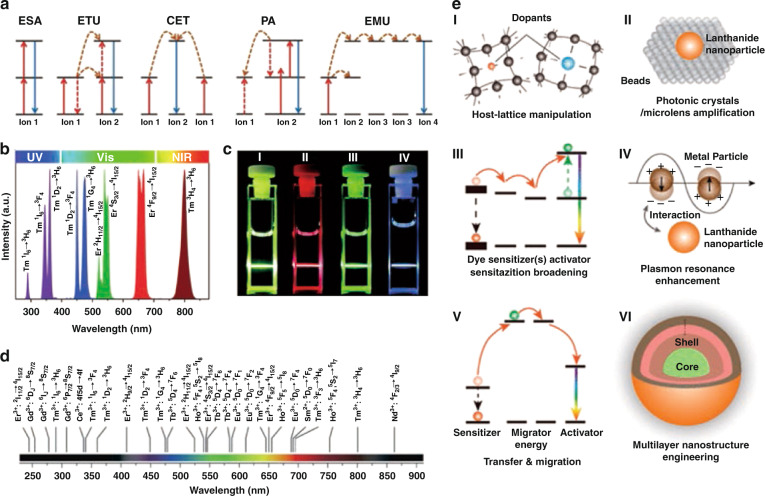
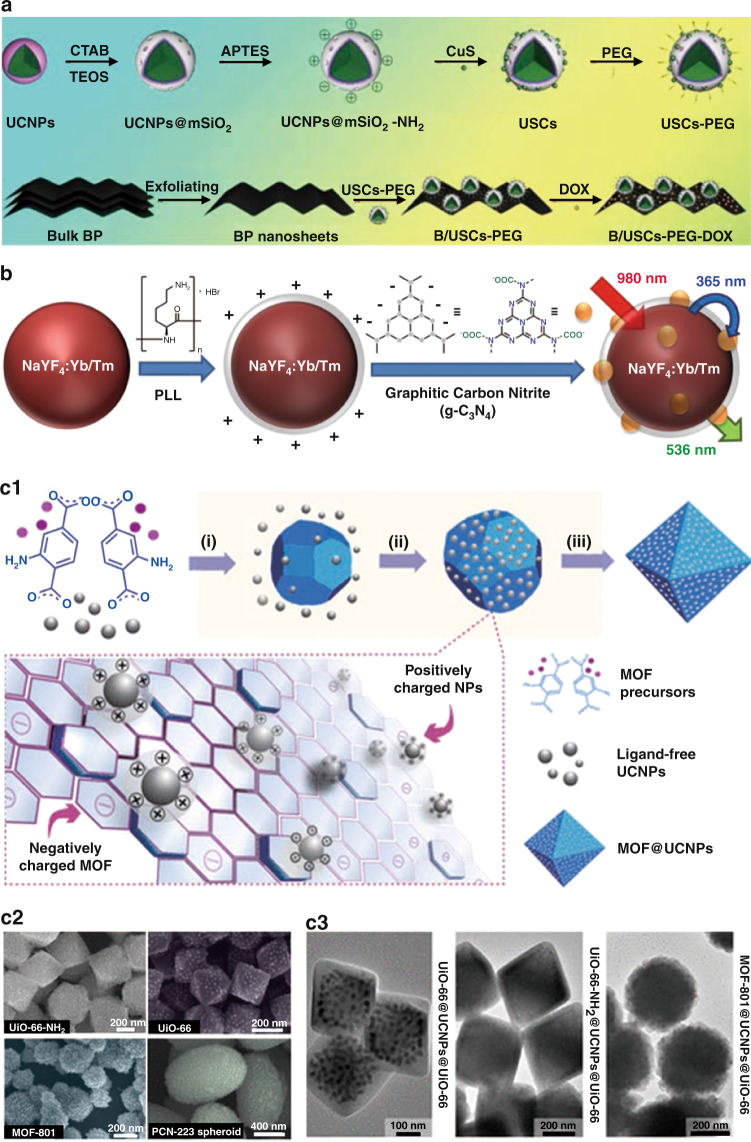
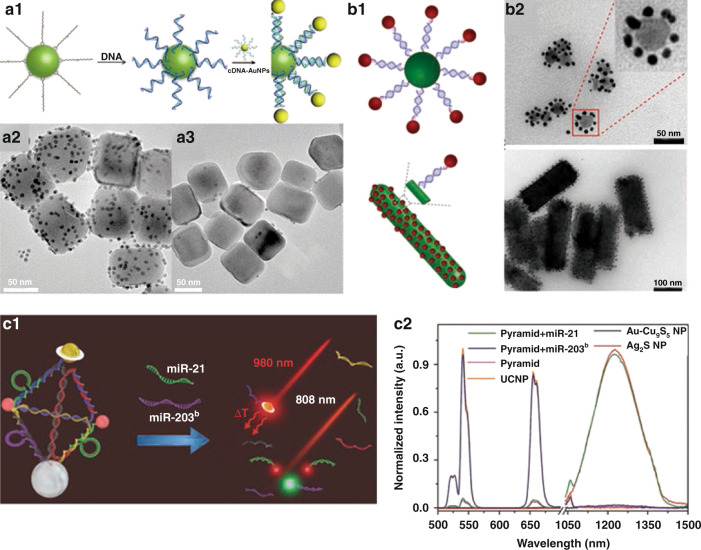
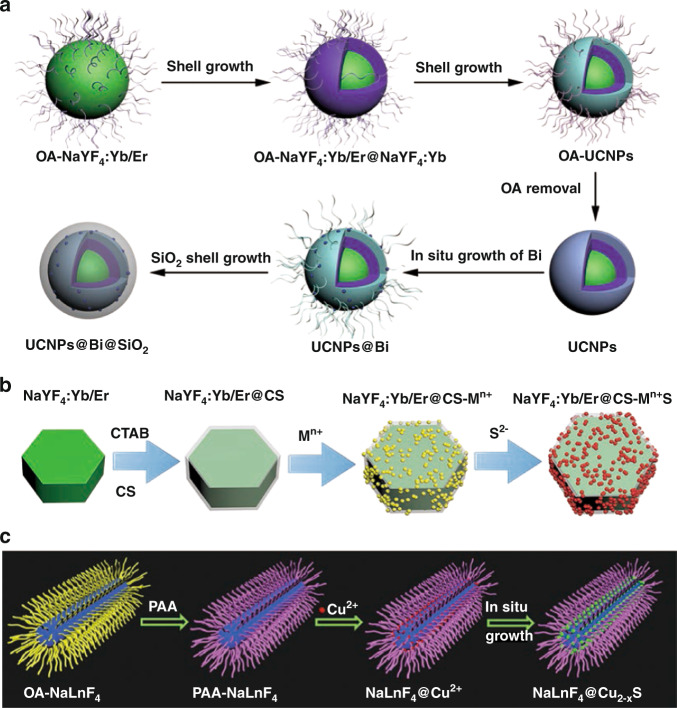
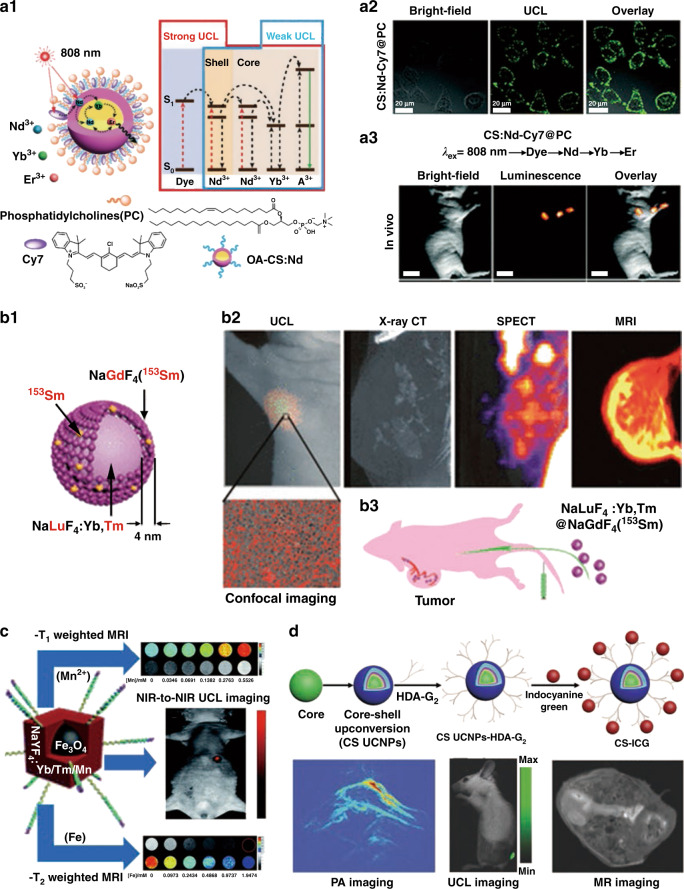
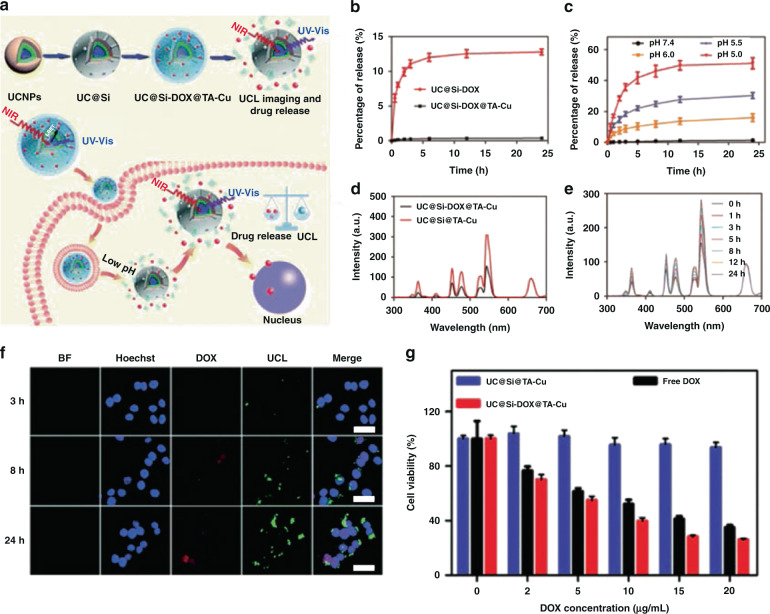
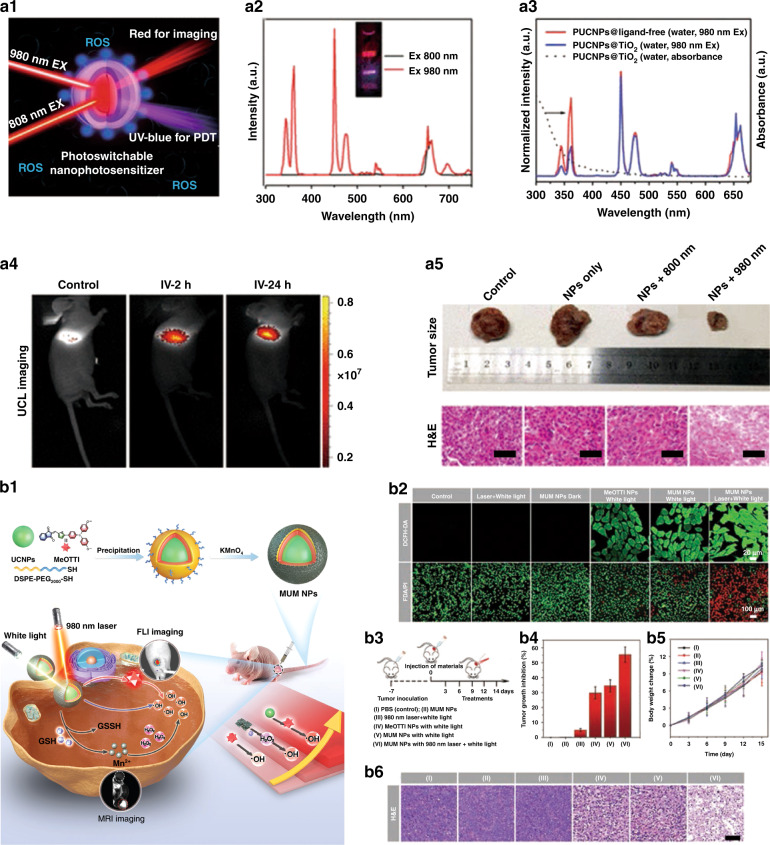
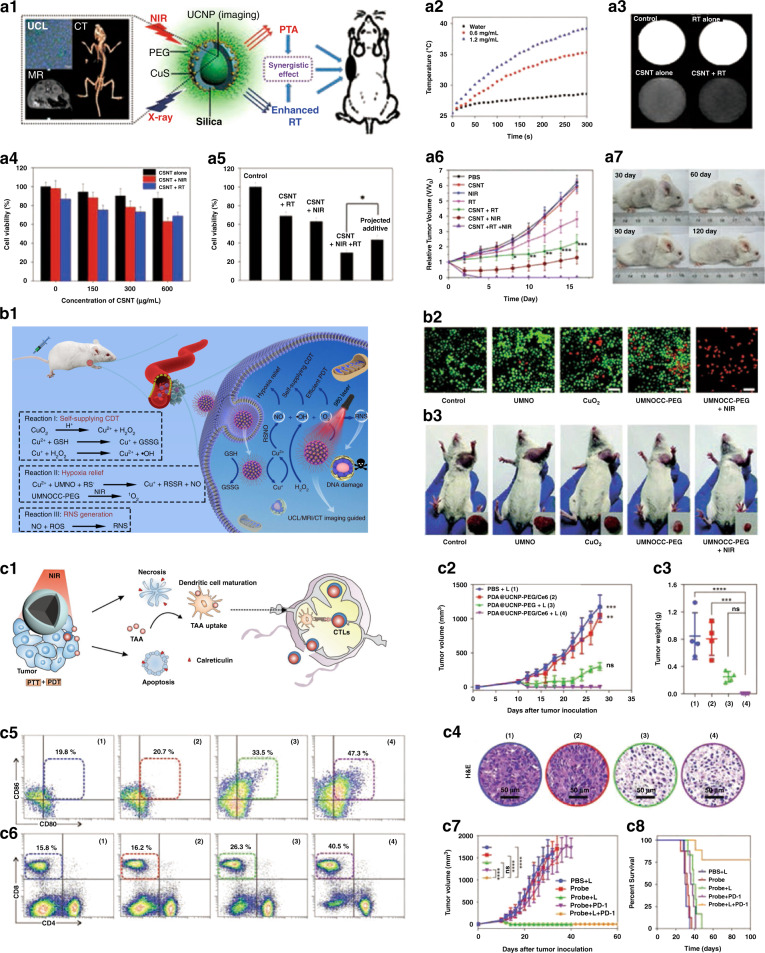
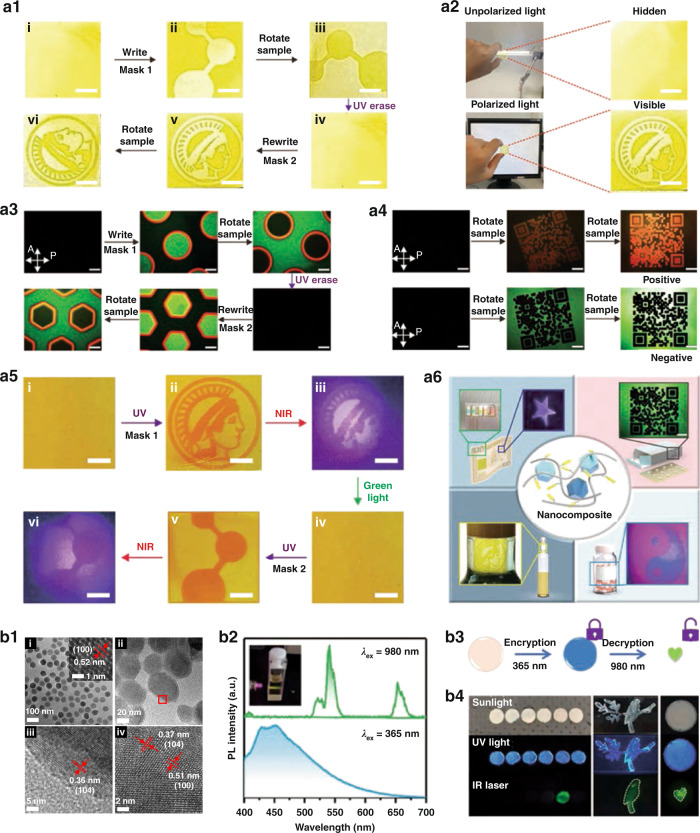
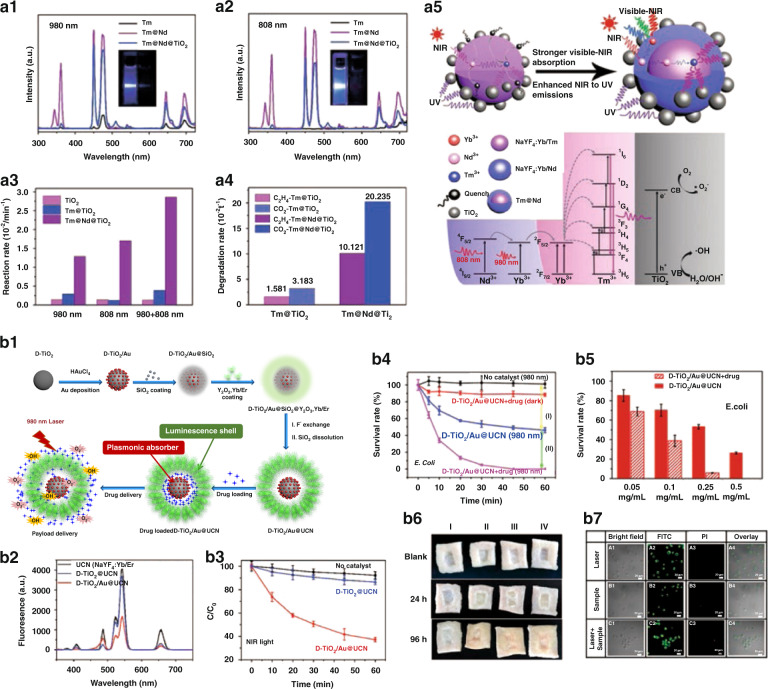
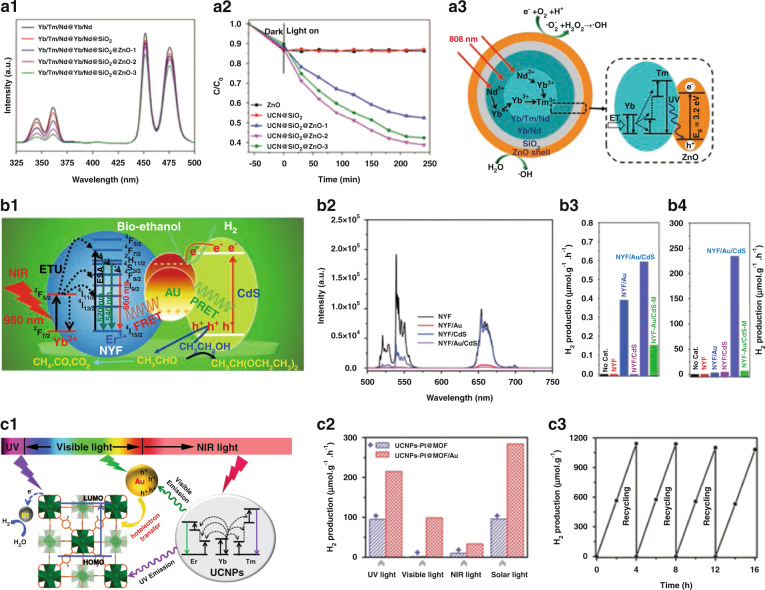
Lanthanide-doped upconversion nanoparticles (UCNPs) have aroused extraordinary interest due to the unique physical and chemical properties. Combining UCNPs with other functional materials to construct nanocomposites and achieve synergistic effect abound recently, and the resulting nanocomposites have shown great potentials in various fields based on the specific design and components. This review presents a summary of diverse designs and synthesis strategies of UCNPs-based nanocomposites, including self-assembly, in-situ growth and epitaxial growth, as well as the emerging applications in bioimaging, cancer treatments, anti-counterfeiting, and photocatalytic fields. We then discuss the challenges, opportunities, and development tendency for developing UCNPs-based nanocomposites.


Conflict of interest statement

The authors declare no competing interests.

Figures

Fig. 1
Fig. 1. Upconversion processes and optical modulation.
a Schematic diagrams of five upconversion processes. b Representative UCL emissions of UCNPs doped with Yb–Er and Yb–Tm ranging from UV to NIR region under irradiation at 980 nm. c Photographs of UCL of UCNPs in colloidal solution. (I) Total UCL of NaYF4:Yb,Er sample. (II, III) The UCL of NaYF4:Yb,Er sample through red and green filters, respectively. (IV) Total UCL of NaYF4:Yb,Tm sample. d By selecting the proper type of doping Ln3+ within UCNPs, a broad range of emission wavelengths from UV to NIR spectral region that could be modulated. e Several photoluminescence enhancement strategies in Ln3+-doped UCNPs. (I) host lattice modulation, (II) photonic crystal and microlens magnification, (III) molecular sensitization, (IV) plasmon resonance enhancement, (V) energy transfer/transfer manipulation, (VI) core–shell engineering. a Reprinted with permission from ref. Copyright 2020, Elsevier. b, c Reprinted with permission from ref. Copyright 2015, The Royal Society of Chemistry. d Reprinted with permission from ref. Copyright 2019, Elsevier. e Reprinted with permission from ref. Copyright 2020, American Chemical Society.
Fig. 2
Fig. 2. Electrostatic adsorption technique.
a Schematic diagram of the synthetic process of B/USCs-PEG-DOX. b Schematic illustration of the preparation of NaYF4:Yb/Tm-PLL@g-C3N4. c1 Schematic of the synthetic process of UCNPs and MOF nanocomposites. c2 SEM images of UiO-66-NH2@NaYF4:Yb/Er, UiO-66@NaYF4:Yb/Er, MOF-801@NaYF4:Yb/Er, PCN-223@NaYF4:Yb/Er nanocomposites. c3 TEM images of MOF@UCNPs@MOF sandwiched nanocomposites. a Reprinted with permission from ref. Copyright 2020, Elsevier. b Reprinted with permission from ref. Copyright 2016, American Chemical Society. c1–c3 Reprinted with permission from ref. Copyright 2018, American Chemical Society
Fig. 3
Fig. 3. Specific recognition reaction.
a1 Schematic illustration of DNA-directed assembly of UCNPs and AuNPs. TEM images of the assembly of T30-UCNPs with AuNPs containing complementary DNA (a2) and non-complementary DNA (a3). b1 Schematic illustrations of the DNA-mediated assemblies of UCNPs and AuNPs (5 nm). b2 TEM images of DNA-mediated assemblies UCNPs (NaYF4:Yb/Er nanospheres and NaYF4:Gd/Yb/Er nanorods) with AuNPs. c1 Nanopyramids for dual miRs detection. c2 Luminescence spectra of Ag2S NPs, Au-Cu9S5 NPs, UCNPs, pyramids, pyramids with miR-21, and pyramids with miR-203b excited by 808 nm laser. a1–a3 Reprinted with permission from ref. Copyright 2013, American Chemical Society. b1, b2 Reprinted with permission from ref. Copyright 2020, John Wiley and Sons. c1, c2 Reprinted with permission from ref. Copyright 2017, John Wiley and Sons
Fig. 4
Fig. 4. In-situ growth strategy.
a Schematic diagram of synthetic process of UCNPs@Bi@SiO2 nanocomposites. b Schematic illustration of preparation of NaYF4:Yb/Er@CS@Mn+S nanocomposites. c Schematic illustration of designing NaLnF4@Cu2-xS theranostic nanoplatform. a Reprinted with permission from ref. Copyright 2019, American Chemical Society. b Reprinted with permission from ref. Copyright 2020, The Royal Society of Chemistry. c Reprinted with permission from ref. Copyright 2019, John Wiley and Sons
Fig. 5
Fig. 5. Bioimaging.
a1 Schematic diagram and energy level diagram of PC modified dye-sensitized UCNPs-based nanocomposite for photon upconversion upon 808 nm irradiation. a2 UCL images of HeLa cells incubated with CS:Nd-Cy7@PC. a3 UCL lymphatic imaging 30 min after injection of CS:Nd-Cy7@PC under 808 nm excitation. b1 Composition of NaLuF4:Yb,Tm@NaGdF4(153Sm). b2 Four-modal imaging of the tumor-bearing nude mouse at 1 h post intravenous injection of NaLuF4:Yb,Tm@NaGdF4(153Sm). b3 Schematic diagram of tumor angiogenesis imaging using NaLuF4:Yb,Tm@NaGdF4 (153Sm) as the probe. c T1/T2-weighted MR and NIR-to-NIR UCL imaging of Fe3O4@NaYF4:Yb/Tm/Mn nanoplatform. d Schematic of the synthesis of ICG modified UCNPs (CS-ICG) and the PAI, UCL imaging, and MRI of CS-ICG nanocomposites in vivo. a1–a3 Reprinted with permission from ref. Copyright 2016, The Royal Society of Chemistry. b1–b3 Reprinted with permission from ref. Copyright 2013, American Chemical Society. c Reprinted with permission from ref. Copyright 2017, The Royal Society of Chemistry. d Reprinted with permission from ref. Copyright 2016, John Wiley and Sons
Fig. 6
Fig. 6. Chemotherapy.
a Schematic illustration of the fabrication of UC@Si-DOX@TA–Cu and pH-responsive drug release monitored by UCL imaging in real time. b Drug release profiles for UC@Si-DOX@TA–Cu and UC@Si-DOX in phosphate buffer saline (PBS) at pH 7.4. c Drug release profiles for UC@Si-DOX@TA–Cu in PBS at pH 7.4, 6.0, 5.5 and 5.0. d The UCL spectra of UC@Si@TA–Cu and UC@Si-DOX@TA–Cu. e Time-dependent UCL spectra of UC@Si-DOX@TA–Cu after immersing in PBS solution (pH = 5.5). f Confocal fluorescence images of HeLa cells after incubation with UC@Si-DOX@TA–Cu for 3, 8 and 24 h. Scale bar: 40 μm. g Viability of HeLa cells incubated with UC@Si@TA–Cu, DOX and UC@Si-DOX@TA–Cu at varying concentrations. Reprinted with permission from ref. Copyright 2019, The Royal Society of Chemistry
Fig. 7
Fig. 7. Photodynamic therapy.
a1 Schematic of PUCNPs@TiO2 nanocomposites for imaging guided PDT. a2 Upconversion emission spectra of PUCNPs excited by 800 or 980 nm laser (5 W cm−2). Inset: luminescence photograph of PUCNPs in cyclohexane under irradiation by two laser beams (0.8 W cm−2). a3 UCL spectra of PUCNPs@ligand-free (red line) and PUCNPs@TiO2 (blue line), the absorbance spectra of PUCNPs@TiO2 (dotted line). a4 UCL imaging in LLC tumor-bearing mouse after intravenous injection of PUCNPs@TiO2 for 2 and 24 h (800 nm irradiation). a5 The digital photographs of excised tumors after various treatments and H&E-stained slices of tumor tissues collected from different groups. The scale bars stand for 50 μm. b1 Schematic illustration of fabrication of MUM NPs and dual-modal imaging guided triple-jump PDT. b2 DCFH-DA assay for intracellular ROS level (upper row) and FDA/PI assay for live/dead cell staining (lower row) of 4T1 cells after different treatments. b3 Schematic diagram of the operation process of antitumor therapy. b4 Tumor inhibition ratios of different groups after various treatments on day 14. b5 Body weight profiles of mice under different treatments. b6 H&E staining analysis of tumor tissues collected from different groups. a1–a5 Reprinted with permission from ref. Copyright 2018, American Chemical Society. b1–b6 Reprinted with permission from ref. Copyright 2021, John Wiley and Sons
Fig. 8
Fig. 8. Synergistic cancer therapeutics.
a1 Schematic illustration of CSNT for imaging-guided RT/PTA synergistic therapy. a2 Temperature variation of CSNT solutions irradiated by a 980 nm NIR laser (1.5 W cm−2, 5 min). a3 The impact of CSNT on the X-ray radiation dose. a4 Viability of HeLa cells incubated with CSNTs at different concentrations with or without 980 nm laser irradiation and RT. a5 Viability of HeLa cells that have taken up CSNTs treated with RT, PTA, and RT/PTA. a6 Relative tumor growth curves of different groups. a7 Digital photographs of mice from group 7 after 30, 60, 90, and 120 days of treatment. b1 Schematic illustration of UMNOCC-PEG for imaging-guided tumor therapy. b2 CLSM images of HeLa cells co-stained with calcein AM (live cells, green) and PI (dead cells, red) after different treatments (0.5 W cm−2, 500 μg mL−1). b3 Photographs of the representative mice and excised tumors. c1 Schematic illustration of synergistic phototherapy to enhance antitumor immunity. Tumor growth curve (c2), tumor weight (c3), and representative H&E staining (c4) of 4T1 tumor-bearing mice after different treatments. Detection of DC maturity (CD80+CD86+ gated on CD11c+) in tumor-draining lymph nodes (c5) and CTLs (CD4CD8+ gated on CD3+) in the spleen (c6) by flow cytometry. Mean tumor growth kinetics (c7) and corresponding survival rates (c8) of mice after different treatments. a1–a7 Reprinted with permission from ref. Copyright 2013, American Chemical Society. b1–b7 Reprinted with permission from ref. Copyright 2020, The Royal Society of Chemistry. c1–c8 Reprinted with permission from ref. Copyright 2019, John Wiley and Sons
Fig. 9
Fig. 9. Anti-counterfeiting applications.
a1 Photographs of erasable and rewritable macropolarization-related patterns of nanocomposite film. Scale bars stand for 0.5 mm. a2 Photographs of macroscopic polarization-dependent patterns under unpolarized and polarized light. Scale bars stand for 0.5 mm. a3 Polarization microscope photographs of microscopic polarization correlation patterns. Scale bars: 200 μm. a4 QR code pattern on different backgrounds under polarized light microscope. Scale bars: 200 μm. a5 Photographs of photochromic UCL patterns of PAzo/UCNPs under NIR light. Scale bars stand for 5 mm. a6 PAzo/UCNPs nanocomposite for different anti-counterfeiting applications. b1 (i) TEM image of NaYF4:Yb3+,Er3+ UCNPs. (ii) TEM image of UCNP@CsMnCl3 nanocomposites. (iii) The magnified TEM images enclosed by the red frame in (ii). (iv) High-resolution image of UCNP@CsMnCl3 recorded by spherical aberration electron microscopy. b2 Photoluminescence spectra of UCNP@CsMnCl3 excited by 980 nm laser and 365 nm UV light. Inset: luminescence photograph of UCNP@CsMnCl3 under irradiation by 980 nm laser. b3 Dual-modal light-emitting anticounterfeiting principle diagram. b4 Images of security patterns made of pure CsMnCl3 and UCNP@CsMnCl3 under diverse excitation modes (sunlight, UV light, NIR laser). a1–a6 Reprinted with permission from ref. Copyright 2021, John Wiley and Sons. b1–b4 Reprinted with permission from ref. Copyright 2021, John Wiley and Sons
Fig. 10
Fig. 10. Photocatalysis.
UCL spectra of NaYF4:Yb3+,Tm3+ (Tm), Tm@Nd, and Tm@Nd@TiO2 under 980 nm excitation (a1) and 808 nm excitation (a2). The insets of a1 and a2 are luminescence photographs of Tm@Nd (left) and NaYF4:Yb3+,Tm3+ (right) with the same concentration dispersed in cyclohexane under 980 and 808 nm excitation, respectively. Insets of a1 and a2: UCL photographs of Tm@Nd (left) and NaYF4:Yb3+,Tm3+ (right) under 980 and 808 nm laser excitation, respectively. a3 The degradation rates of Rhodamine B by different samples under excitation at 980, 808, and 980 + 808 nm. a4 Degradation rates of C2H4 by Tm@TiO2 and Tm@Nd@TiO2 photocatalysts. a5 Schematic diagram of enhanced photocatalytic activity and upconversion photocatalytic mechanism. b1 Schematic diagram of preparation of drug-loaded D-TiO2/Au@UCN nanocomposites and NIR light-controlled drug release. b2 UCL spectra of UCN, D-TiO2@UCN, and D-TiO2/Au@UCN. b3 The time-dependent ratios of C/C0 in the presence of D-TiO2@UCN and D-TiO2/Au@UCN or without photocatalyst for rhodamine 6G degradation under NIR light irradiation. b4 E. coli viability treated with D-TiO2/Au@UCN and AMP-loaded D-TiO2/Au@UCN in the dark or under 980 nm irradiation. b5 Survival rate of E. coli under different sample concentrations under NIR light irradiation for 30 min. b6 Photographs of the bacterial contamination for pig skin in 96 h. Grouping of infected skin (I) drug-loaded D-TiO2/Au@UCN + NIR light, (II) drug-loaded D-TiO2/Au@UCN in the dark; (III) NIR light irradiation, and (IV) in the dark. b7 Confocal fluorescence images of HaCaT cells co-stained with V-fluorescein isothiocyanate and propidium iodide after different treatments. a1–a5 Reprinted with permission from ref. Copyright 2019, Elsevier. b1–b7 Reprinted with permission from ref. . Copyright 2020, American Chemical Society
Fig. 11
Fig. 11. Photocatalysis.
a1 UCL spectra of different samples. a2 Time-dependent ratios of C/C0 for Rhodamine B with different samples as photocatalysts. a3 ET process in UCNPs and the proposed photocatalytic mechanism for UCN@SiO2@ZnO. b1 ET processes between NYF, Au, and CdS, and evolution process of bio-ethanol photoreformed H2 under NIR irradiation. b2 UCL spectra of NYF, NYF/Au, NYF/CdS and NYF/Au/CdS. Photocatalytic H2 evolution rates of different samples under NIR (b3) and simulated sunlight (b4). c1 Schematic diagram of photocatalytic H2 production mechanism of UCNPs-Pt@MOF/Au. c2 H2 production rates of UCNPs-Pt@MOF and UCNPs-Pt@MOF/Au under excitation by UV, Vis, NIR, and solar light. c3 Recycling test for H2 production of UCNPs-Pt@MOF/Au under simulated solar light. a1–a3 Reprinted with permission from ref. Copyright 2020, American Chemical Society. b1–b4 Reprinted with permission from ref. Copyright 2017, The Royal Society of Chemistry. c1–c8 Reprinted with permission from ref. Copyright 2018, John Wiley and Sons

Similar articles

Cited by

References

    1. Wang F, Liu XG. Recent advances in the chemistry of lanthanide-doped upconversion nanocrystals. Chem. Soc. Rev. 2009;38:976–989. doi: 10.1039/b809132n. - DOI - PubMed
    1. Chen G, et al. Light upconverting core–shell nanostructures: nanophotonic control for emerging applications. Chem. Soc. Rev. 2015;44:1680–1713. doi: 10.1039/C4CS00170B. - DOI - PubMed
    1. Dong H, Sun LD, Yan CH. Energy transfer in lanthanide upconversion studies for extended optical applications. Chem. Soc. Rev. 2015;44:1608–1634. doi: 10.1039/C4CS00188E. - DOI - PubMed
    1. Lei PP, Feng J, Zhang HJ. Emerging biomaterials: taking full advantage of the intrinsic properties of rare earth elements. Nano Today. 2020;35:100952. doi: 10.1016/j.nantod.2020.100952. - DOI
    1. Zheng KZ, et al. Recent advances in upconversion nanocrystals: expanding the kaleidoscopic toolbox for emerging applications. Nano Today. 2019;29:100797. doi: 10.1016/j.nantod.2019.100797. - DOI