. 2022 Jul 13;13(1):4061.
doi: 10.1038/s41467-022-31574-z.

The HHIP-AS1 lncRNA promotes tumorigenicity through stabilization of dynein complex 1 in human SHH-driven tumors

Affiliations

The HHIP-AS1 lncRNA promotes tumorigenicity through stabilization of dynein complex 1 in human SHH-driven tumors

Jasmin Bartl et al. Nat Commun. .

Abstract

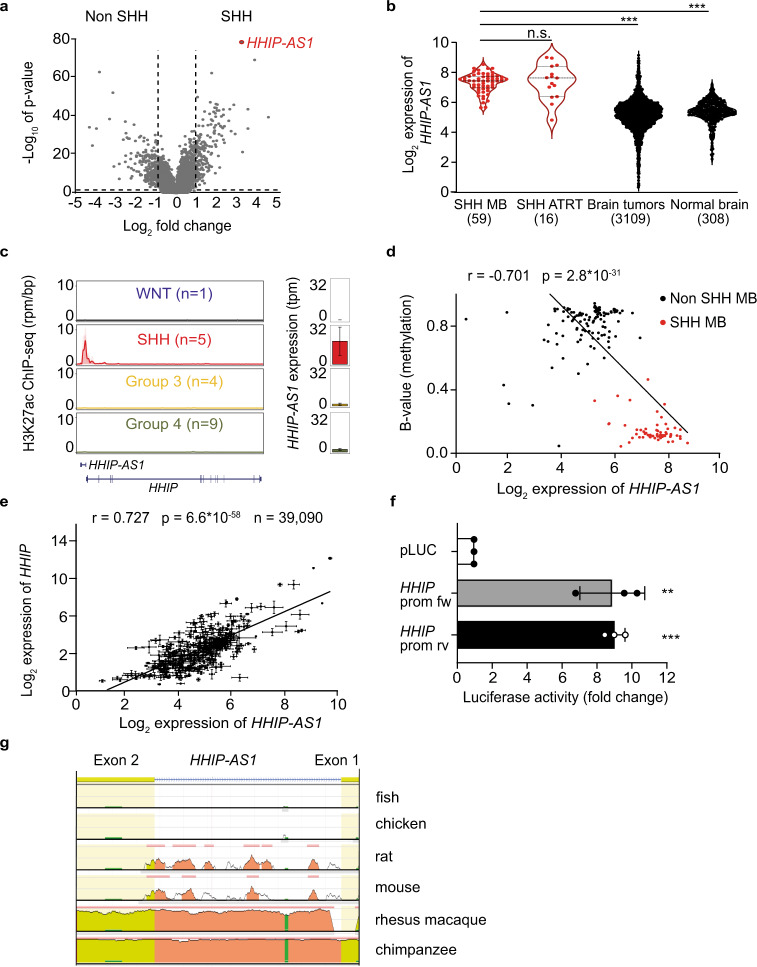
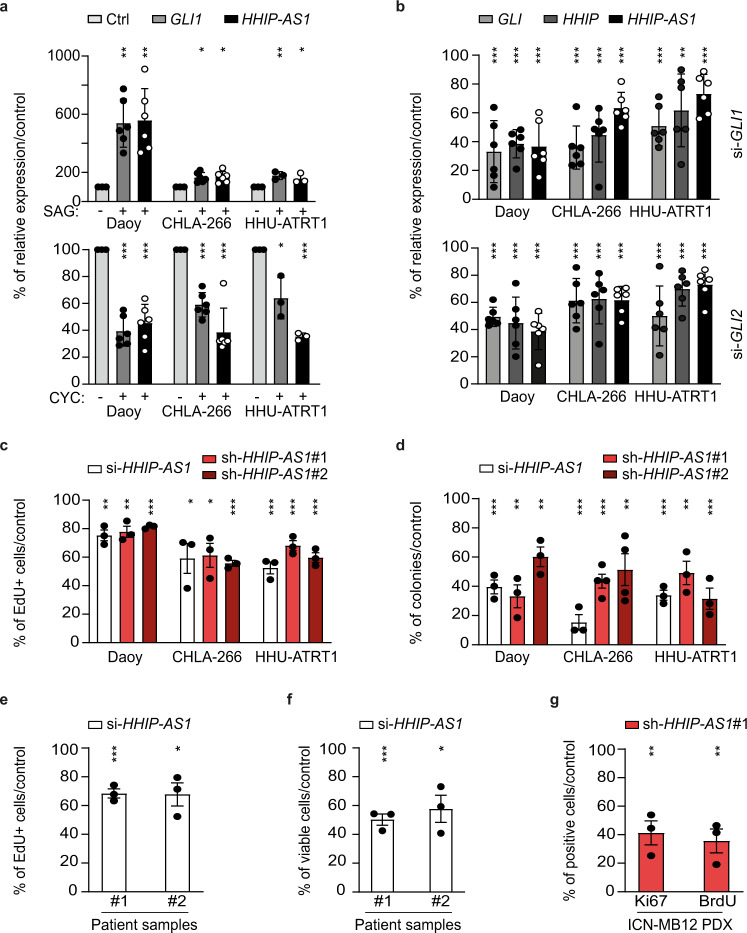
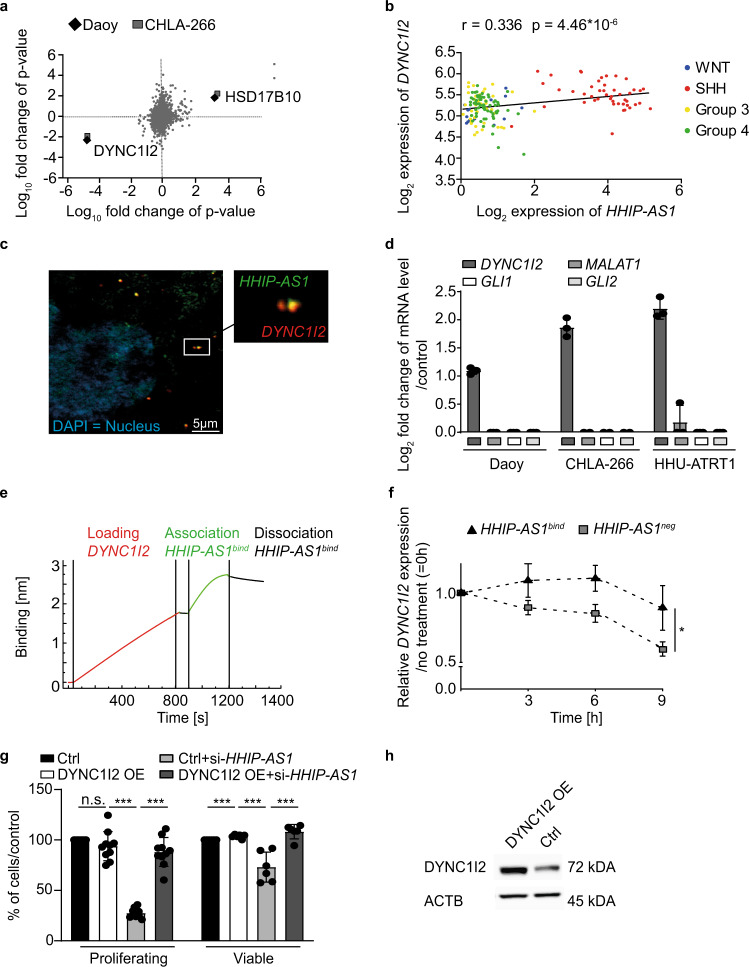
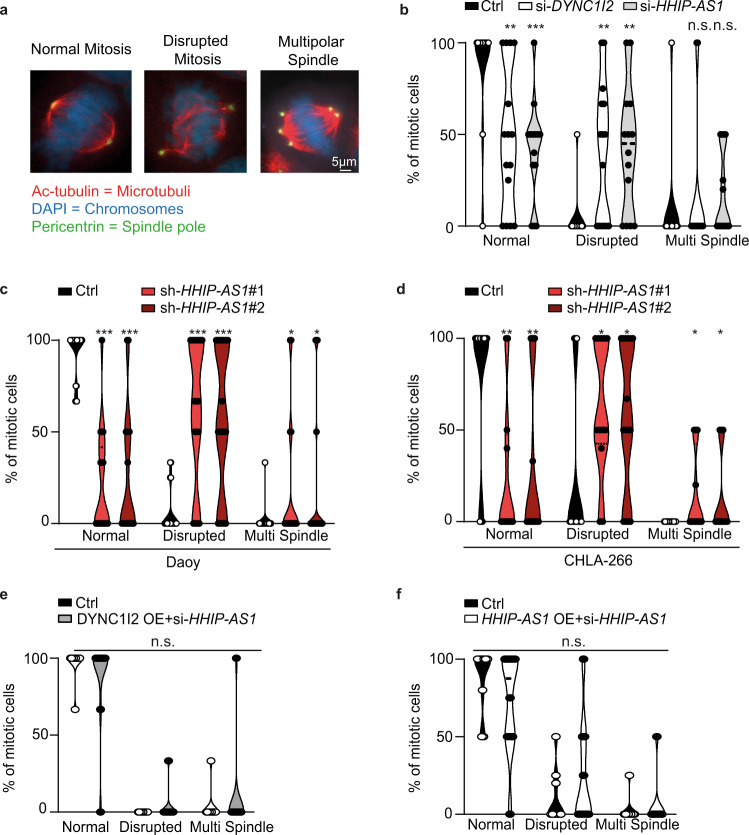
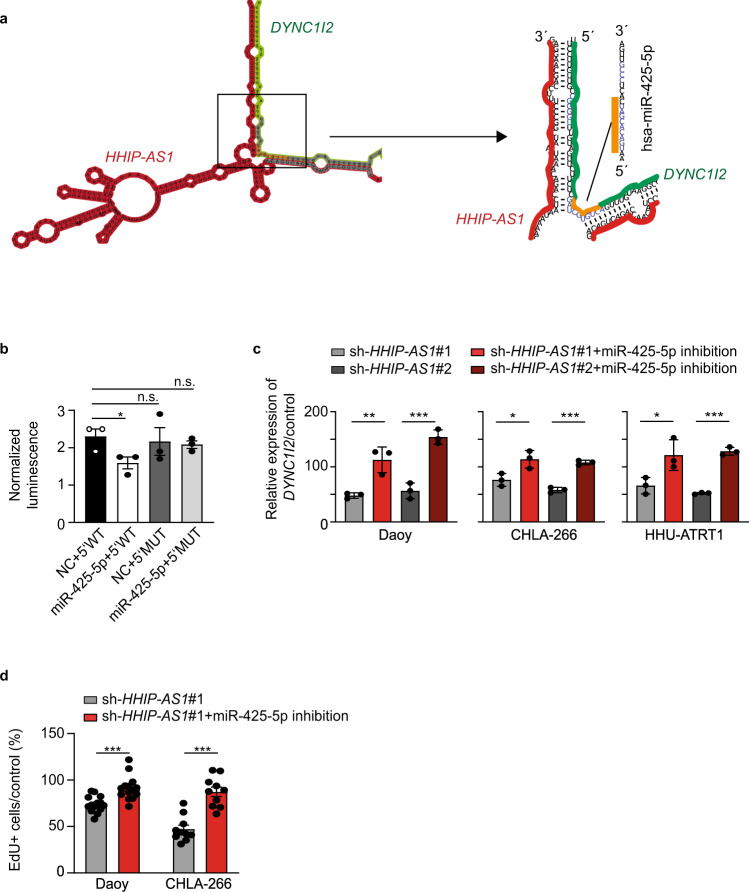
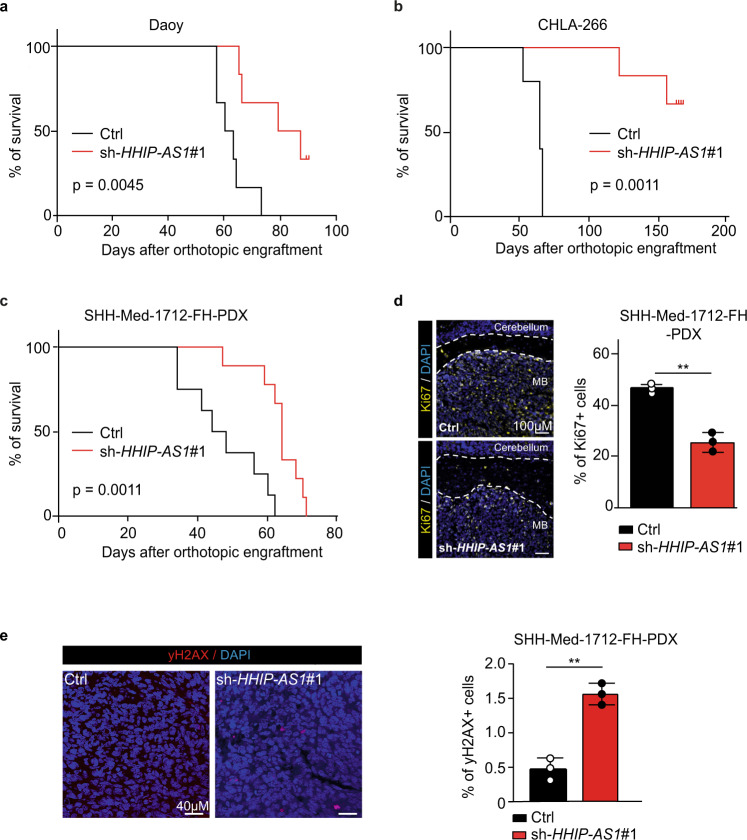
Most lncRNAs display species-specific expression patterns suggesting that animal models of cancer may only incompletely recapitulate the regulatory crosstalk between lncRNAs and oncogenic pathways in humans. Among these pathways, Sonic Hedgehog (SHH) signaling is aberrantly activated in several human cancer entities. We unravel that aberrant expression of the primate-specific lncRNA HedgeHog Interacting Protein-AntiSense 1 (HHIP-AS1) is a hallmark of SHH-driven tumors including medulloblastoma and atypical teratoid/rhabdoid tumors. HHIP-AS1 is actively transcribed from a bidirectional promoter shared with SHH regulator HHIP. Knockdown of HHIP-AS1 induces mitotic spindle deregulation impairing tumorigenicity in vitro and in vivo. Mechanistically, HHIP-AS1 binds directly to the mRNA of cytoplasmic dynein 1 intermediate chain 2 (DYNC1I2) and attenuates its degradation by hsa-miR-425-5p. We uncover that neither HHIP-AS1 nor the corresponding regulatory element in DYNC1I2 are evolutionary conserved in mice. Taken together, we discover an lncRNA-mediated mechanism that enables the pro-mitotic effects of SHH pathway activation in human tumors.


Conflict of interest statement

Guido Reifenberger received honoraria for advisory boards from Abbvie and Sven Diederichs is co-owner of siTOOLs Biotech, Martinsried, Germany. The remaining authors declare no competing interest.

Figures

Fig. 1
Fig. 1. The long non-coding RNA HHIP-AS1 is a hallmark of human SHH-driven tumors.
a Long non-coding RNA (lncRNA) expression profiles in SHH-driven medulloblastoma (MB; right side) versus non SHH-driven MB (left side). The volcano plot illustrates the distribution of statistical significance (y-axis) and relative expression level (x-axis) for the lncRNAs profile. The red dot indicates HHIP-AS1 (HedgeHog Interacting Protein-Anti-Sense 1). Statistical analysis was performed using one-way ANOVA with post-hoc Tukey HSD; ***p < 0.001. b Violin plots display the expression level of HHIP-AS1 according to an integrative transcriptomic analysis of 3492 samples from neoplastic brain tissues with SHH activation (SHH MB and atypical teratoid/rhabdoid tumors (ATRT)) or without commonly reported SHH activation (brain tumors) and normal brain without tumor. Statistical analysis was performed using Kruskal–Wallis Test with Dunn’s Multiple Comparison Test; ***p < 0.001. Red dots = SHH-driven entities; black dots = non SHH-driven tumors and control tissue. c H3K27ac ChIP-sequencing profile on HHIP-AS1 and HHIP loci in the four MB subgroups. Bar graph indicates the expression level of HHIP-AS1 in the corresponding MB subgroups. Error bars represent ± SEM. d Scatter plot representing the degree of DNA methylation (B value) of the potential promoter region in relation to HHIP-AS1 expression levels in SHH MB (red dots) and other MB subgroups (black dots). Statistics were done by Pearson correlation. e Scatter plot displaying expression correlation of HHIP and HHIP-AS1 across datasets (n = 351). Mean expressions of both transcripts from 39,090 samples were analyzed in their respective datasets and plotted with error bars representing the SEM for both genes. Statistics were done by Pearson correlation. f The bar graph indicates the relative luciferase activity of empty luciferase vector (pLUC) or pLUC containing the cloned HHIP promoter sequence orientation (fw = forward, rv = reversed). The results are presented as the mean ± SD of three independent experiments. Student´s two-sided t-test; **p < 0.01, ***p < 0.001. g Identification of evolutionarily conserved regions corresponding to critical regulatory elements in large (>1 Mb), highly conserved gene desert regions flanking the human HHIP-AS1 gene located at chromosome 4q31.21 with two exons. Source data and exact p-values are provided as a “Source Data file”.
Fig. 2
Fig. 2. The long non-coding RNA HHIP-AS1 is functionally required in human SHH-driven brain tumors.
a The relative gene expression levels of HHIP-AS1 and the SHH target gene GLI1 were tested in tumor cell lines (Daoy and CHLA-266) and in primary tumor cell cultures (HHU-ATRT1) upon pharmacological activation (SAG, Smoothened agonist) or inhibition (CYC, cyclopamine) of the SHH pathway. b Relative gene expression levels of indicated genes as measured by qRT-PCR upon transient knockdown of GLI1 and GLI2 in the depicted cell models normalized to control (si-negative-POOL; gene expression of target genes were normalized to housekeeping genes: HPRT, GUSB and PPIA). c Proliferation rate of Daoy, CHLA-266 and HHU-ATRT1 was measured by EdU incorporation upon transient (si-HHIP-AS1) or stable HHIP-AS1 knockdown normalized to control. d Self-renewal capacity of Daoy, CHLA-266 and HHU-ATRT1 was measured by colony formation assay upon transient (si-HHIP-AS1) or stable (sh-HHIP-AS1#1 and sh-HHIP-AS1#2) HHIP-AS1 knockdown normalized to control. In panel c + d corresponding controls (either with si-negative-POOL or sh-scr transfected Daoy, CHLA-266 and HHU-ATRT1 cells) were set to 100% and levels of knockdowns were calculated accordingly. e Proliferation rate of primary SHH MB cultures derived from freshly resected tumors (n = 2 patients) measured by EdU incorporation upon transient knockdown of HHIP-AS1 (si-HHIP-AS1) normalized to control (si-negative-POOL). f Cell viability of these primary SHH MB cultures derived from freshly resected tumors (n = 2 patients) measured by CellTiter-Glo upon transient knockdown of HHIP-AS1 (si-HHIP-AS1) normalized to control (si-negative-POOL). g Proliferation rate of SHH MB PDX cells (ICN-MB12) determined by BrdU incorporation and Ki67 immunostaining after transient knockdown of HHIP-AS1 (sh-HHIP-AS1#1) normalized to control. Bar graphs of panels a + b are presented as the mean ± SD, panels cg are presented as the mean ± SEM of at least three independent experiments and corresponding controls were set to 100%. Student’s two-sided t-test; ***p < 0.001; **p < 0.01; *p < 0.05. Source data and exact p-values are provided as a “Source Data file”.
Fig. 3
Fig. 3. Identification and functional validation of HHIP-AS1 downstream targets reveals that HHIP-AS1 binds to mRNA of DYNC1I2.
a Scatter plot indicates the correlation analysis of RNA sequencing (x-axis) and protein mass spectrometry (y-axis) data in two different cell models (Daoy and CHLA-266) upon HHIP-AS1 knockdown (using sh-HHIP-AS1#1 and sh-HHIP-AS1#2) versus control cells (sh-scr, n = 3 independent samples per condition and cell model). b Scatter plot displaying expression correlation of DYNC1I2 and HHIP-AS1 sequencing data comparing FPKM expression values in 167 MB patient samples. Samples are color coded for MB subgroups. Statistics were done by Pearson correlation. c Representative image of co-localization of HHIP-AS1 and DYNC1I2 mRNA in Daoy obtained through two-color fluorescence in situ hybridization (FISH). White frame indicates the location of the zoom out picture at the right side. Green: HHIP-AS1 lncRNA, red: DYNC1I2 mRNA, blue: DAPI, Nucleus. Scale bar: 5 µm. This experiment was repeated twice with similar results. d Enrichment of DYNC1I2 mRNA upon HHIP-AS1 raPOOL pulldown in Daoy and CHLA-266 cell lines and HHU-ATRT1 primary cells. Bar graphs are presented as the mean ± SD of three independent experiments. e Bio-Layer interferometry was used for detecting direct interaction between DYNC1I2 mRNA and HHIP-AS1. f DYNC1I2 mRNA stability upon transfection of a control (HHIP-AS1neg) or the HHIP-AS1 interacting sequence (HHIP-AS1bind). Calculation was done in comparison to the mRNA level at time point “0 h” in each condition. Data are presented as the mean ± SEM of five independent experiments; Student´s two-sided t-test; *p < 0.05. g Bar graph indicating the proliferation rate or viability of Daoy cells in control condition (Ctrl), upon overexpression of DYNC1I2 (DYNC1I2 OE) and upon transient HHIP-AS1-knockdown (si-HHIP-AS1) in DYNC1I2 overexpression (DYNC1I2 OE + si-HHIP-AS1). Data are represented as the mean ± SD of at least six independent experiments normalized to the control condition. Student’s two-sided t-test; ***p < 0.001; n.s. not significant. h The immunoblot shows a representative blot of DYNC1I2 protein expression in control (Ctrl) or DYNC1I2-overexpressing (DYNC1I2 OE) cells. ACTB immunoblotting was used as loading control. This experiment was done twice with similar result. Source data and exact p-values are provided as a “Source Data file”.
Fig. 4
Fig. 4. The interaction between HHIP-AS1 and DYNC1I2 promotes mitosis.
a Representative images of immunofluorescence analysis show spindle assembly in mitotic cells by immunostaining for acetylated tubulin (Ac-tubulin, red) and pericentrin (green). Chromosomes are visualized with DAPI (blue). White scale bar: 5 μm. bd Bar graphs display the percentage of dividing cells displaying normal, disrupted or multipolar spindle mitosis under control (Ctrl = si-negative-POOL or sh-scr) condition and DYNC1I2- or HHIP-AS1-knockdown using siRNAs for transient knockdown in Daoy (b) or two independent shRNAs (sh-HHIP-AS1#1 and sh-HHIP-AS1#2) for stable HHIP-AS1 knockdown in Daoy (c) and in CHLA-266 (d). e Bar graphs showing the percentage of dividing cells displaying normal, disrupted or multipolar spindle mitosis under control (Ctrl) condition or upon rescue of DYNC1I2 expression by endogenous gene transcriptional activation through CRISPR-Cas9 technology in the context of transient HHIP-AS1 knockdown (DYNC1I2 OE + si-HHIP-AS1) in Daoy cells. f Bar graphs showing the percentage of dividing cells displaying normal, disrupted or multipolar spindle mitosis under control (Ctrl) condition or upon rescue of HHIP-AS1 expression by endogenous gene transcriptional activation through CRISPR-Cas9 technology in the context of transient HHIP-AS1 knockdown (HHIP-AS1 OE + si-HHIP-AS1) in Daoy cells. All bar graph values are representative of n  at least  ten independent experiments (with a total n > 50 counted mitotic cells) and data are shown as mean ± SEM. Student’s two-sided t-test; ***p < 0.001; **p < 0.01; *p < 0.05; n.s. not significant. Source data and exact p-values are provided as a “Source Data file”.
Fig. 5
Fig. 5. HHIP-AS1 blocks endogenous hsa-miR-425-5p function to maintain DYNC1I2 levels.
a Schematic view of the complex structure generated by the predicted base-pairing interaction between HHIP-AS1 (red) and the 5'UTR of DYNC1I2 mRNA (green). The sequence of hsa-miR-425-5p is also shown and the inferred binding site of this miRNA on DYNC1I2 mRNA 5'UTR is depicted in orange. The scheme highlights how this miRNA-mRNA interaction is predicted to be blocked by HHIP-AS1 association to DYNC1I2 mRNA. Black frame indicates position for zoom out image on the right side. b The wild type 5'UTR of DYNC1I2 mRNA (5'WT) or a mutated version (5'MUT) were cloned in front of a luciferase coding sequence and co-transfected in combination with hsa-miR-425-5p mimics (mir-425) or negative controls (NC) into Daoy cells. Bar graphs indicate the measured relative luciferase activity for each combination ± SEM in three independent experiments. Student’s one-sided t-test; *p < 0.05. n.s. not significant. c DYNC1I2 expression level was measured via qRT-PCR in Daoy, CHLA-266 and HHU-ATRT1 cells upon stable HHIP-AS1 knockdown using two independent stable shRNAs (sh-HHIP-AS1#1 and sh-HHIP-AS1#2), in combination with or without transient inhibition of hsa-miR-425-5p. Bar graphs are presented as the mean ± SD of three independent experiments. d Proliferation rate of Daoy and CHLA-266 with stable knockdown of HHIP-AS1 (sh-HHIP-AS1#1) measured by EdU incorporation in combination with or without transient inhibition of hsa-miR-425-5p. Bar graphs are presented as the mean ± SEM of at least ten independent experiments and corresponding controls were set to 100%. Student’s two-sided t-test; ***p < 0.001; **p < 0.01; *p < 0.05; n.s. not significant. Source data and exact p-values are provided as a “Source Data file”.
Fig. 6
Fig. 6. Loss of HHIP-AS1 extends survival in SHH-driven brain tumor models in vivo.
a,b Kaplan–Meier estimates of nude mice orthotopically engrafted with stably HHIP-AS1-silenced (sh-HHIP-AS1#1) Daoy (a, n = 13 mice) and CHLA-266 (b, n = 13 mice) cells compared to corresponding controls (sh-scr), respectively. c Survival curves of nude mice orthotopically engrafted with transiently HHIP-AS1-silenced (sh-HHIP-AS1#1) SHH-Med-1712-FH cells (n = 17mice). For panels a, b, and c, the median survivals were compared using Mantel–Cox test. d,e Three controls and three HHIP-AS1-depleted SHH-Med-1712-FH tumors were immunostained for Ki67 (yellow, d, white scale bar: 100 µm), γH2AX (red, e, white scale bar: 40 µm) and the percentage of positive stained tumor cells is plotted in the bar graphs as mean ± SD. Nuclei are stained with DAPI (blue). Both, control (ctrl = sh-scr) and sh-HHIP-AS1#1 tumor tissue, are shown in the two representative images. Student’s two-sided t-test, **p < 0.01. Source data and exact p-values are provided as a “Source Data file”.

References

    1. Tan IL, et al. Lateral cerebellum is preferentially sensitive to high sonic hedgehog signaling and medulloblastoma formation. Proc. Natl Acad. Sci. USA. 2018;115:3392–3397. doi: 10.1073/pnas.1717815115. - DOI - PMC - PubMed
    1. Reifenberger J, et al. Somatic mutations in the PTCH, SMOH, SUFUH and TP53 genes in sporadic basal cell carcinomas. Br. J. Dermatol. 2005;152:43–51. doi: 10.1111/j.1365-2133.2005.06353.x. - DOI - PubMed
    1. Stewart E, et al. Identification of therapeutic targets in rhabdomyosarcoma through integrated genomic, epigenomic, and proteomic analyses. Cancer Cell. 2018;34:411–426.e419. doi: 10.1016/j.ccell.2018.07.012. - DOI - PMC - PubMed
    1. Johann PD, et al. Atypical teratoid/rhabdoid tumors are comprised of three epigenetic subgroups with distinct enhancer landscapes. Cancer Cell. 2016;29:379–393. doi: 10.1016/j.ccell.2016.02.001. - DOI - PubMed
    1. Liu, K. W., Pajtler, K. W., Worst, B. C., Pfister, S. M. & Wechsler-Reya, R. J. Molecular mechanisms and therapeutic targets in pediatric brain tumors. Sci. Signal.10.1126/scisignal.aaf7593 (2017). - PubMed

Publication types