. 2022 Jul 13;12(1):11933.
doi: 10.1038/s41598-022-16106-5.

Deficiency of protocadherin 9 leads to reduction in positive emotional behaviour

Affiliations

Deficiency of protocadherin 9 leads to reduction in positive emotional behaviour

Masato Uemura et al. Sci Rep. .

Abstract

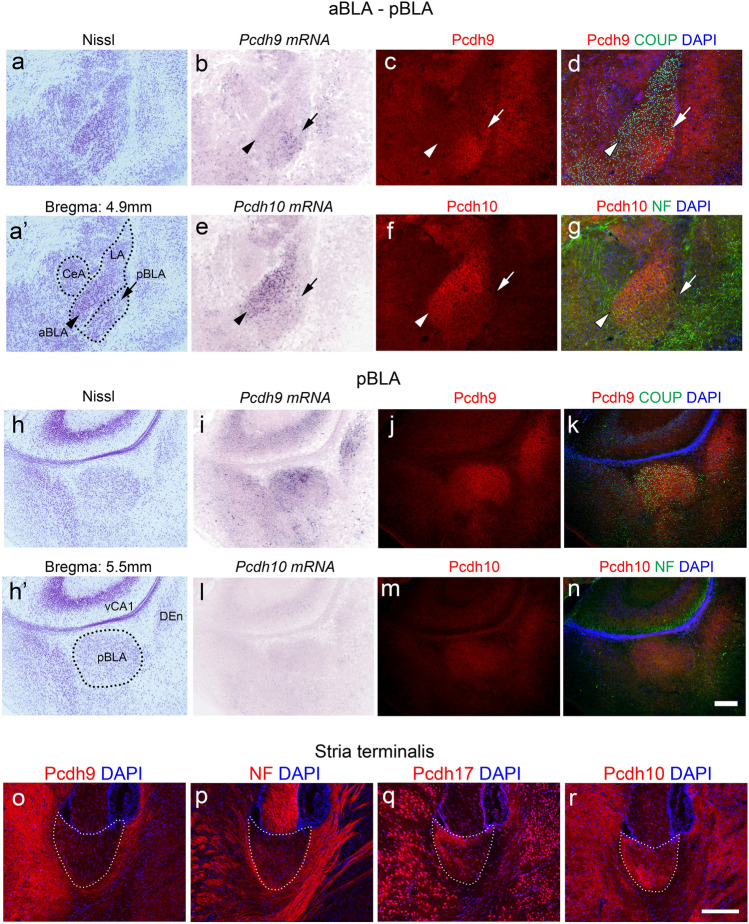
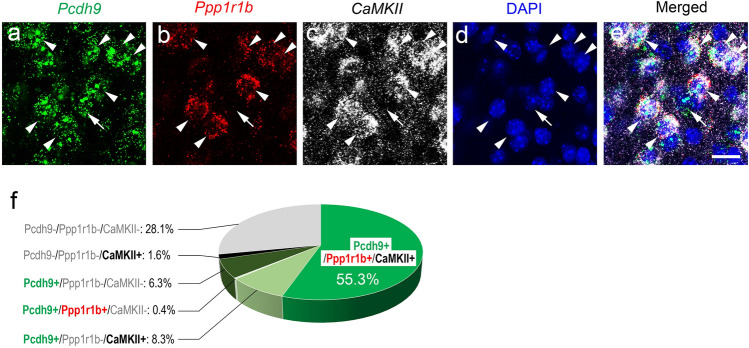
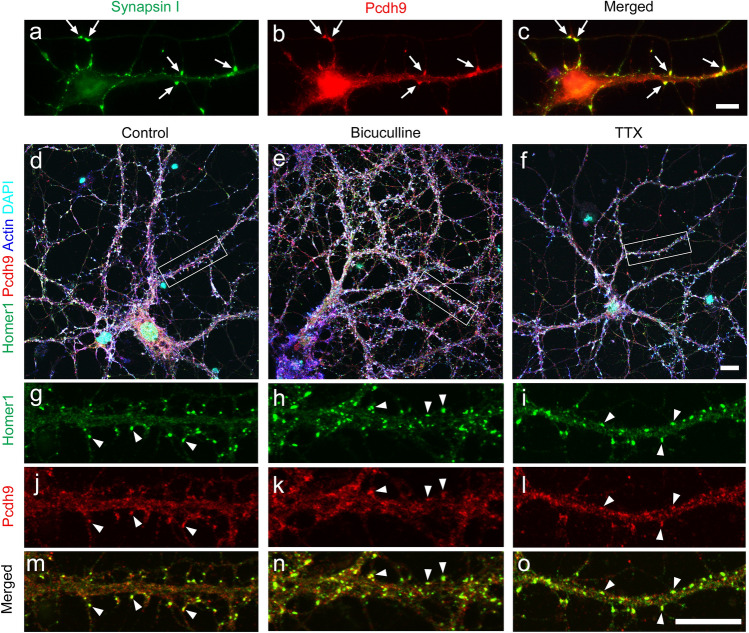
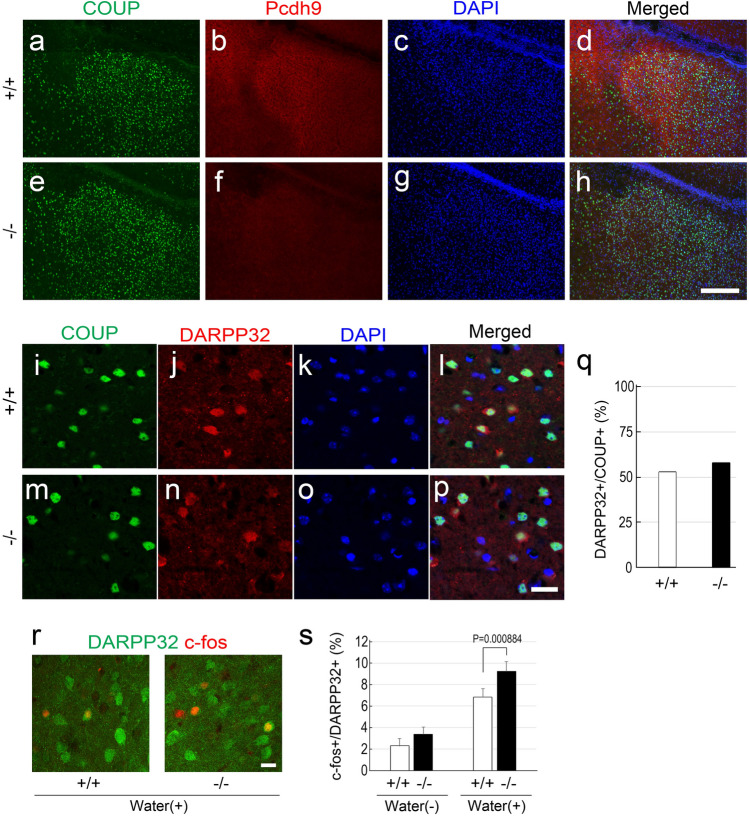
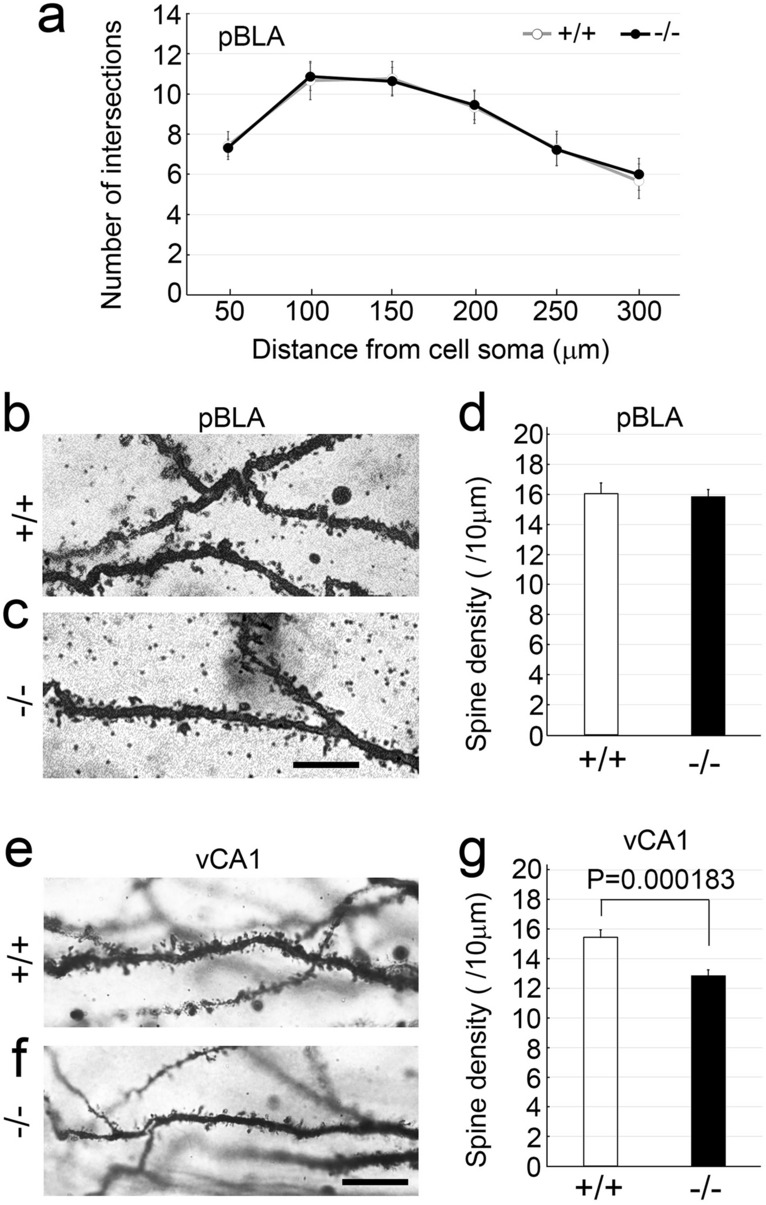
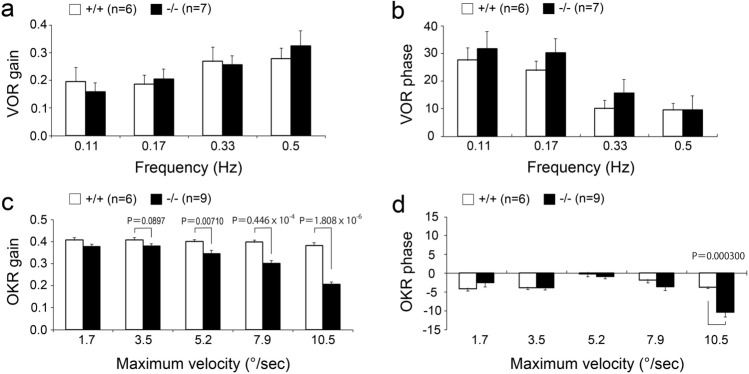
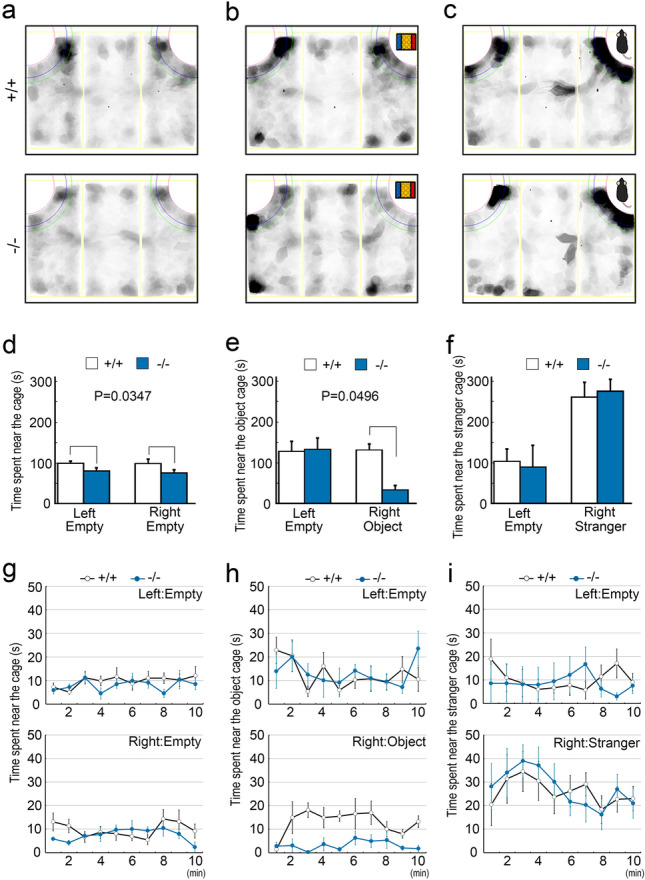
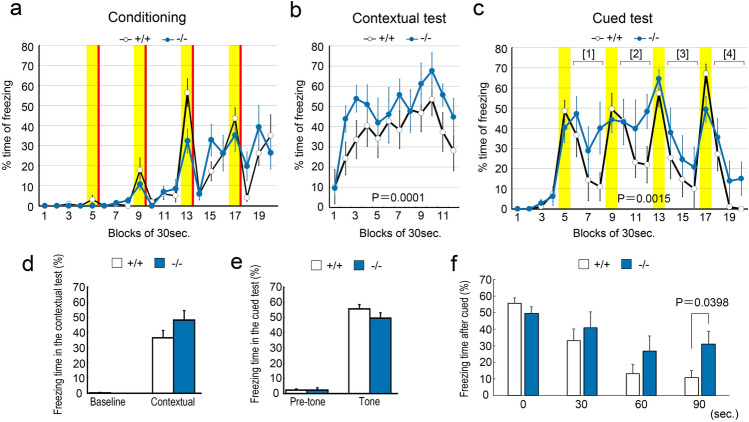
Protocadherin 9 (Pcdh9) is a member of the cadherin superfamily and is uniquely expressed in the vestibular and limbic systems; however, its physiological role remains unclear. Here, we studied the expression of Pcdh9 in the limbic system and phenotypes of Pcdh9-knock-out mice (Pcdh9 KO mice). Pcdh9 mRNA was expressed in the fear extinction neurons that express protein phosphatase 1 regulatory subunit 1 B (Ppp1r1b) in the posterior part of the basolateral amygdala (pBLA), as well as in the Cornu Ammonis (CA) and Dentate Gyrus (DG) neurons of the hippocampus. We show that the Pcdh9 protein was often localised at synapses. Phenotypic analysis of Pcdh9 KO mice revealed no apparent morphological abnormalities in the pBLA but a decrease in the spine number of CA neurons. Further, the Pcdh9 KO mice were related to features such as the abnormal optokinetic response, less approach to novel objects, and reduced fear extinction during recovery from the fear. These results suggest that Pcdh9 is involved in eliciting positive emotional behaviours, possibly via fear extinction neurons in the pBLA and/or synaptic activity in the hippocampal neurons, and normal optokinetic eye movement in brainstem optokinetic system-related neurons.


Conflict of interest statement

The authors declare no competing interests.

Figures

Figure 1
Figure 1
Expression and distribution of Pcdh9 gene products in the amygdala and stria terminalis. (an) Expression and distribution of the Pcdh9 gene products in the amygdala region in comparison to that of the Pcdh10. (bd) and (i–k) Show the Pcdh9 gene products in the aBLA and pBLA regions, respectively. Similarly, (eg) and (ln) Show the Pcdh10 gene product in the aBLA and pBLA regions, respectively. (or) Staining of the stria terminalis with various anti-protocadherin antibodies. Most of the fibres in the stria terminalis were Pcdh9 negative, whereas Pcdh10 and Pcdh17 were positive in the subsets of fibres. Abbreviation: NF, neurofilament. Scale bars, 200 μm in (an) and 100 μm in (or).
Figure 2
Figure 2
Identification of Pcdh9-expressing neurons. (ae) Expression of Pcdh9 mRNA; Pcdh9 (a) was compared with Ppp1r1b (b) and CamKII (c) using multi-color in situ hybridization. Arrowheads indicate Pcdh9+ neurons that also expressed Ppp1r1bmRNA, whereas arrows indicate Pcdh9+ neurons that did not express Ppp1r1b mRNA. (f) Composition of pBLA neurons that expressed Pcdh9, Ppp1r1b, and/or CamKII in different combinations. Scale bar, 20 μm in (ae).
Figure 3
Figure 3
Localization of Pcdh9 proteins in cultured hippocampal neurons. (a–c) In 5-days in vitro (5-DIV) cultures, Pcdh9 protein was often localized at contact sites between neurites (arrows). (do) In 20-DIV cultures, Pcdh9 protein was often localized at synapses (arrowheads) in addition to other regions of neurites. Synaptic localization was not changed in normal medium (d, g, j, m), medium containing bicuculline (e, h, k, n), and TTX (f, i, l, o). Scale bars, 10 μm in (ac), 10 μm in (d–f) and 10 μm in (g–o).
Figure 4
Figure 4
pBLA in the Pcdh9 KO mice. (ah) The size of pBLA, visualized with a marker of BLA neurons (COUP-TFII), was not affected in the KO mice. (ip) Double staining of COUP-TFII and DARPP-32 (Ppp1r1b), a marker of fear extinction neurons. (q) The number of DARPP-32+ neurons was not changed in the pBLA of the KO mice. (r) Double staining of c-fos (red) and DARPP32 (green) after a water reward. (s) c-fos expression in the DARPP-32+ neurons was not different between the wt mice and the Pcdh9 KO mice without a water reward, whereas it was significantly higher in the Pcdh9 KO mice than that of the wt mice after a water reward. In the case without water reward, the numbers of c-fos+ and DARPP-32+ were counted with 10 sections from two wt mice and 12 sections from two Pcdh9 KO mice, whereas in the case with water reward, the numbers of c-fos+ and DARPP-32+ were counted with 28 sections from five wt mice and 30 sections from six Pcdh9 KO mice. Scale bars, 200 μm in (ah) and 20 μm in (ip, r).
Figure 5
Figure 5
Morphological analyses of neurons in the Pcdh9 KO mice with Golgi staining. (a) Statistics of dendritic arborisation of neurons in the pBLA. The number of branches from the primary dendrite was counted with 21 neurons from two wt mice and 22 neurons from four Pcdh9 KO mice. Two-way ANOVA p = 0.76832. (bd) The spine density of neurons in the pBLA was not changed in the Pcdh9 KO mice. The number of spines was counted with 31 neurons from two wt mice and 65 dendrites from four Pcdh9 KO mice. (eg) Spine density in the vCA1 was significantly reduced in the Pcdh9 KO mice. The number of spines was counted with 38 neurons from two wt mice and 94 neurons from four Pcdh9 KO mice. Scale bars, 10 μm in (b, c) and 100 μm in (e, f).
Figure 6
Figure 6
Abnormal optokinetic response (OKR) in the Pcdh9 KO mice. (a, b) Vestibulo-ocular reflex (VOR) gain and VOR phase were not changed in the Pcdh9 KO mice. (c, d) OKR gain and OKR phase were reduced at the higher maximum velocities in the Pcdh9 KO mice. Scale bar, 2 mm.
Figure 7
Figure 7
The reduced approach of the Pcdh9 KO mice to a novel object. (ac) Schematic diagrams of the three-chamber cages. The mouse behaviours were traced with shadows in each experiment. (a) Mice were habituated in the case with two empty chambers at the corners for 10 min before experiments. (df) Statistics (Two-way ANOVA) of the results in each experiment. (d) During habituation, the Pcdh9 KO mice showed a tendency not to approach the empty chambers. (e) With a novel object in one side of the chambers, the approach of the Pcdh9 KO mice to a novel object was significantly reduced. (f) In contrast, with a novel mouse in one side of the chambers, the Pcdh9 KO mice behaved normally. (gi) Time courses of staying time at each chamber. (h) Pcdh9 KO mice tended to stay away from a novel object for all time. Scale bars, 100 μm in (a, b) and 10 μm in (c, d).
Figure 8
Figure 8
Reduced fear extinction of the Pcdh9 KO mice. (ac) Time course of freezing during conditioning, contextual, and cued tests in the conventional fear-conditioned memory test. The yellow shadows indicate the periods with tone stimulations whereas the red bars indicate the points of electric shocks. In both contextual and cued tests, a fear memory was established. In the recovery phases (Period [1]–[4]), freezing time of the Pcdh9 KO mice was significantly longer than that of the wt mice (2-way ANOVA). (d, e) In both contextual and cued tests, the total freezing time of the Pcdh9 KO mice was not different from that of the wt mice. However, during the time course, the freezing time of the Pcdh9 KO mice was longer than that of the wt mice in the contextual test with 2-way ANOVA analysis (b). (f) Comparison of the freezing time during the recovery phase of the cued test. The sum of the freezing times of each bin during four recovery phases (Period [1]–[4]) in the cued test is shown. The degree of freezing of the Pcdh9 KO mice was significantly larger than that of the wt mice during the recovery from fear.

References

    1. Hirano S, Takeichi M. Cadherins in brain morphogenesis and wiring. Physiol. Rev. 2012;92:597–634. doi: 10.1152/physrev.00014.2011. - DOI - PubMed
    1. Weiner KMMJA. In: The cadherin superfamily. Suzuki ST, Hirano S, editors. Springer; 2016. pp. 195–221.
    1. Jontes JD. In: The cadherin superfamily. Suzuki ST, Hirano S, editors. Springer; 2016. pp. 223–249.
    1. Asahina H, Masuba A, Hirano S, Yuri K. Distribution of protocadherin 9 protein in the developing mouse nervous system. Neuroscience. 2012;225:88–104. doi: 10.1016/j.neuroscience.2012.09.006. - DOI - PubMed
    1. Hirano S, Imai-Okano K. In: The cadherin superfamily. Suzuki ST, Hirano S, editors. Springer; 2016. pp. 399–421.

Publication types