. 2022 Jul 12;13(1):4041.
doi: 10.1038/s41467-022-31692-8.

CD8 lymphocytes mitigate HIV-1 persistence in lymph node follicular helper T cells during hyperacute-treated infection

Affiliations

CD8 lymphocytes mitigate HIV-1 persistence in lymph node follicular helper T cells during hyperacute-treated infection

Omolara O Baiyegunhi et al. Nat Commun. .

Abstract

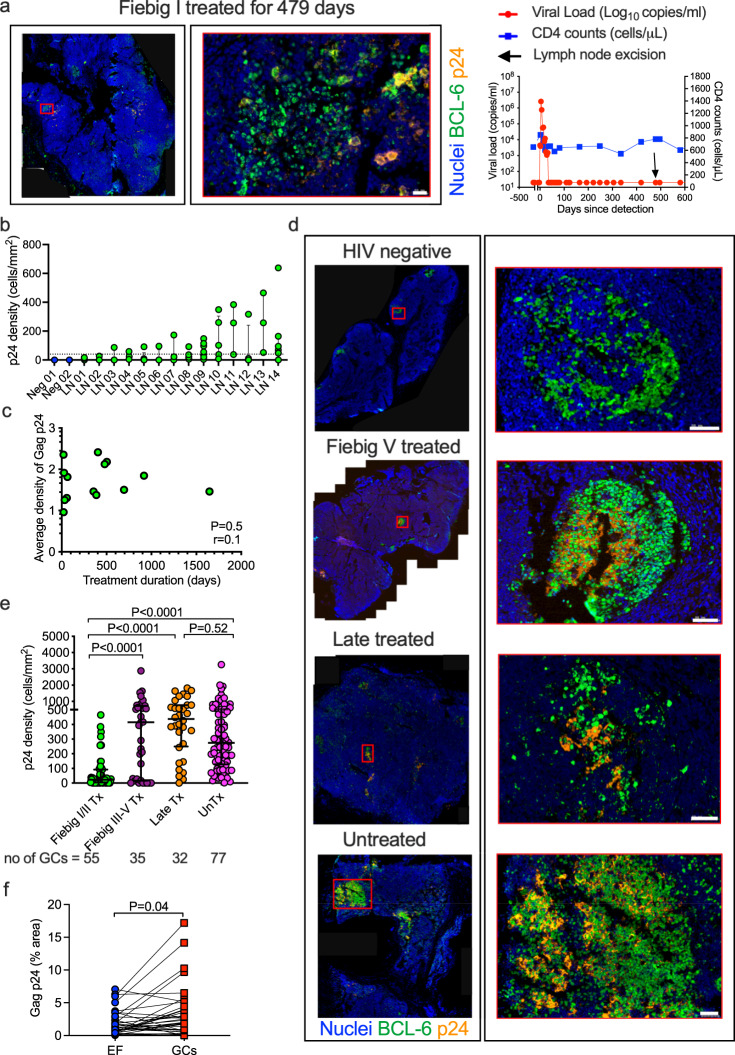
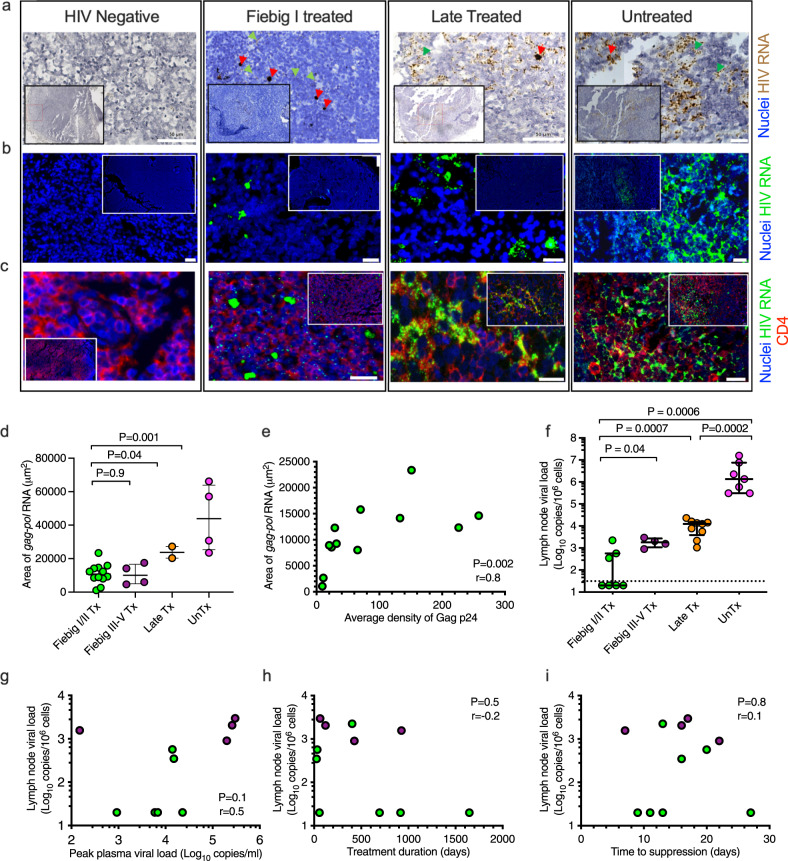
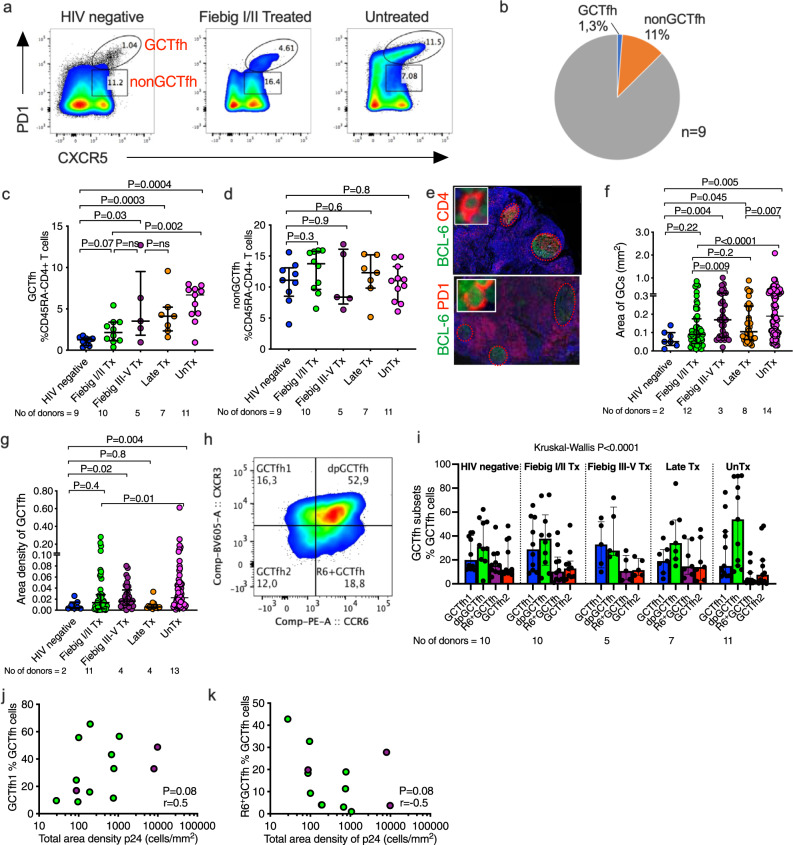
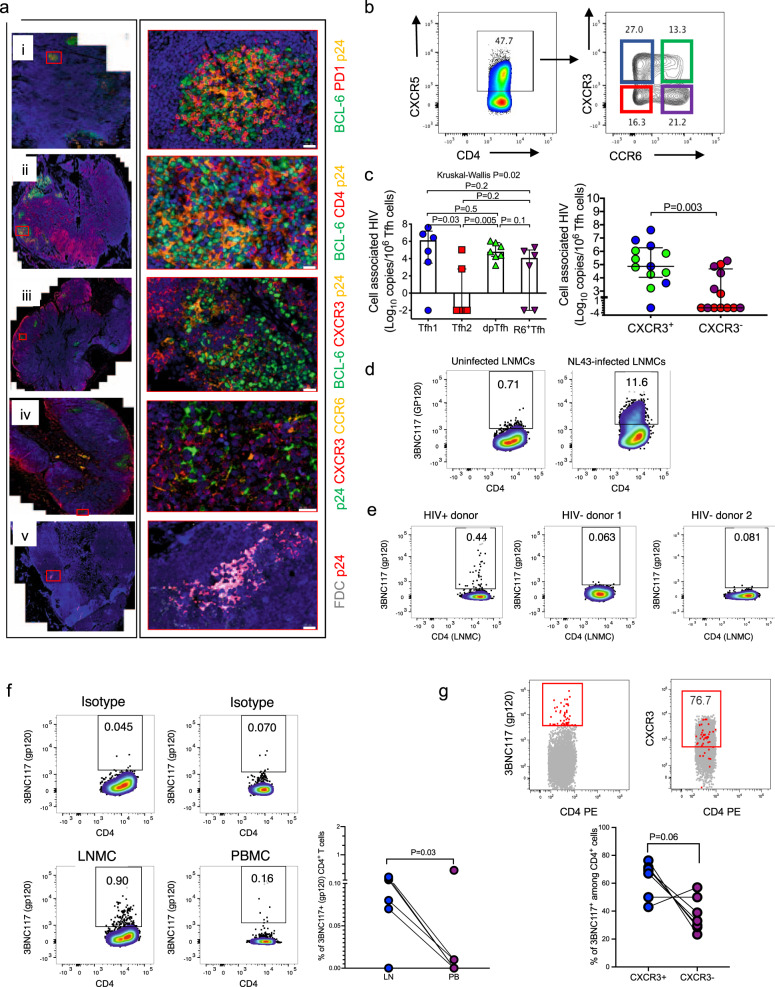
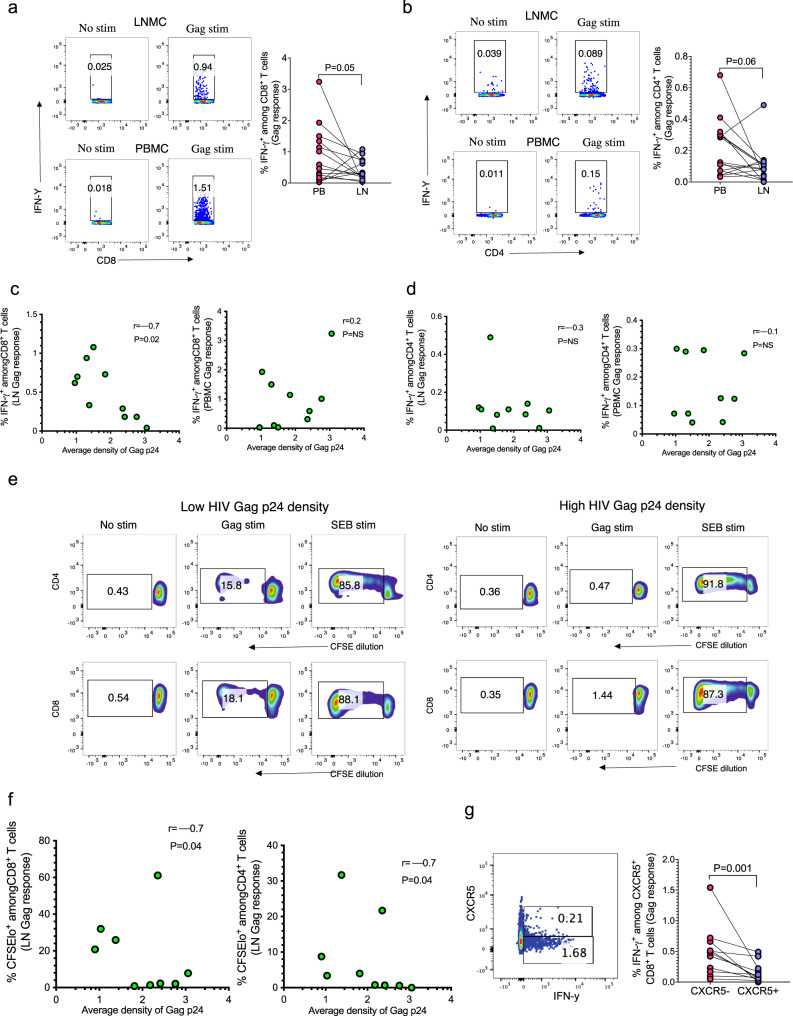
HIV persistence in tissue sites despite ART is a major barrier to HIV cure. Detailed studies of HIV-infected cells and immune responses in native lymph node tissue environment is critical for gaining insight into immune mechanisms impacting HIV persistence and clearance in tissue sanctuary sites. We compared HIV persistence and HIV-specific T cell responses in lymph node biopsies obtained from 14 individuals who initiated therapy in Fiebig stages I/II, 5 persons treated in Fiebig stages III-V and 17 late treated individuals who initiated ART in Fiebig VI and beyond. Using multicolor immunofluorescence staining and in situ hybridization, we detect HIV RNA and/or protein in 12 of 14 Fiebig I/II treated persons on suppressive therapy for 1 to 55 months, and in late treated persons with persistent antigens. CXCR3+ T follicular helper cells harbor the greatest amounts of gag mRNA transcripts. Notably, HIV-specific CD8+ T cells responses are associated with lower HIV antigen burden, suggesting that these responses may contribute to HIV suppression in lymph nodes during therapy. These results reveal HIV persistence despite the initiation of ART in hyperacute infection and highlight the contribution of virus-specific responses to HIV suppression in tissue sanctuaries during suppressive ART.


Conflict of interest statement

The authors declare no competing interests.

Figures

Fig. 1
Fig. 1. HIV Gag p24 persists in germinal centers (GCs) despite early ART initiated in Fiebig stages I/II.
a IF images of Gag p24 antigen (yellow) and BCL-6 (green) staining in lymph node (LN) sections and a scatter plot showing CD4+ T cell counts, plasma viral loads and the time of LN excision for a Fiebig I treated (Tx) participant. Nuclei are counterstained with DAPI (blue) and scale bar is 20 μm. b Gag p24 density per GC computed from TissueQuest (TissueGnostics, Vienna) analysis of IF LN sections (HIV negative, n = 2; Fiebig I/II Tx, n = 14), and c correlation analyses of average density of Gag p24 per donor and the treatment duration prior to LN excision. d Representative IF images of Gag p24 antigen (yellow) and BCL-6 (green) staining (scale bar is 50 μm) and e aggregate data from TissueQuest (TissueGnostics, Vienna) analysis of IF LN sections (Fiebig I/II Tx, n = 14; Fiebig III–V Tx, n = 3; late Tx, n = 8; and untreated (unTx), n = 13). Each dot represents the density of Gag p24 per GC and the total number of GCs analyzed per group is displayed. f Comparison of the total percentage area staining for Gag p24 within GCs and outside the GCs (EF) for all donors (n = 36). Three independent experiments were conducted with similar results. Error bars represent interquartile range. Data are presented as median ± interquartile range. All statistical tests are two-sided. Two-tailed p values from Mann–Whitney U test (f) or adjusted p values from Dunn’s multiple comparison’s test (e) are shown. Spearman rho (r) values and p values are reported for correlation analyses (c). Dotted line denotes threshold of detection (b). Source data are provided as a source data file.
Fig. 2
Fig. 2. HIV-RNA persistence in lymph nodes of Fiebig I/II treated individuals.
HIV-RNA detection in lymph nodes (LN) of Fiebig I/II treated individuals using RNAscope (ae) and Cobas® AmpliPrep HIV-1 test (fi). a RNAscope hybridization for HIV gag-pol RNA was detected using 3, 3’-diaminobenzidene (DAB, brown) or b, c fluorescent Opal polymers (green). Representative images for HIV negative, Fiebig I/II treated (Tx), late Tx and untreated (unTx) HIV-infected LN sections are shown. Single RNA transcripts are seen as punctate dots; clusters of transcripts are also observed. Red arrowheads identify HIV RNA+ cells and green arrowheads identify virions on follicular dendritic cells. c Images showing multiplexed RNAscope gag-pol hybridization (green) coupled with IF staining for CD4+ cells (red). Three independent experiments were conducted with similar results. Scale bars are 50 μm (a) or 20 μm (b, c). d RNA signals quantified in micrographs using Fiji [(ImageJ software, Fiebig I/II Tx, n = 12; Fiebig III–V Tx, n = 4; late Tx, n = 2; and unTx, n = 4). Five fields of view are analyzed per sample and averaged. e A correlation analysis of area staining of gag-pol RNA and Gag p24 density for Fiebig I/II Tx LNs. f Viral RNA loads are quantified in lymph node mononuclear cells (LNMCs) (Fiebig I/II Tx, n = 7; Fiebig III–V Tx, n = 4; late Tx, n = 9; and unTx, n = 7). Viral loads below the limits of detection of the assay are assigned a value of 20. Correlation analysis of LNMCs’ viral loads with g peak plasma viral loads, h treatment duration, and i time to suppression for Fiebig I/II Tx, n = 7; and Fiebig III–V, n = 4; donors. All statistical tests are two-sided and p values are from the Mann–Whitney U test (d, f). Spearman rho (r) values and p values are reported for correlation analyses (e, gi). Dotted line denotes threshold of viral load detection. Error bars represent interquartile range (d, f). Data are presented as median and interquartile range (d, f). Source data are provided as a source data file.
Fig. 3
Fig. 3. Expansion of Germinal center T follicular helper (GCTfh) cells during HIV-1 infection.
a Representative flow cytometry plots, b pie chart and c summary plots comparing the proportions of GCTfh (CXCR5hiPD-1hi), and d nonGCTfh (PD-1+CXCR5+) cells in HIV negative (HIVneg), Fiebig I/II treated (Tx), Fiebig III–V Tx, Late Tx and untreated HIV-infected (unTx) groups. e Representative images showing lymph node sections stained with BCL-6 (green) to define germinal centers and CD4 (red), or PD-1 (red) to localize GCTfh cells. Three independent experiments were conducted with similar results. Aggregate results for the (f) area of GCs and (g) area density of GCTfh cells computed using TissueQuest (TissueGnostics, Vienna) software. h Representative flow cytometry plot showing gating for Tfh subsets and i aggregate data across the groups. j Correlation analysis of Gag p24 density measured using image cytometry with GCTfh1 (CXCR3+CCR6) and k R6+GCTfh (CXCR3CCR6+) subsets distribution measured using flow cytometry (n = 13). All statistical tests are two-sided and p values are from the Mann–Whitney U test (c, d, f, g, i). Spearman rho (r) and p values are reported for correlation analysis (j, k). The number of donor samples analyzed in each group is indicated. Error bars represent interquartile range. Data are presented as median and interquartile range (c, d, f, g, i). Source data are provided as a source data file.
Fig. 4
Fig. 4. CXCR3+ Tfh cells contribute to HIV persistence in treated hyperacute HIV-1 infection.
Representative IF images characterizing HIV Gag p24+ cells in the germinal centers (BCL-6+, green). a The co-localization of Gag p24 antigens (yellow color in (i–iii), green in (iv), red in (v)) with cells expressing (i) PD1+ in red, (ii) CD4+ in red, (iii) CXCR3+ in red, and (iv) CCR6+; yellow color, surface markers and (v) follicular dendritic cells (FDC, gray color) are assessed by immunofluorescence microscopy. Green, red, and yellow signals are from Opal fluorophores 520, 570 and 690 (PerkinElmer) and nuclei are counterstained with DAPI (blue). b Representative flow cytometry plots showing gating for FACs-sorted Tfh subsets. c HIV mRNA quantified in FACs-sorted Tfh subsets (from n = 8 donors) using digital droplet PCR. Absolute numbers of quantified HIV transcripts are equated to absolute cell numbers determined using the expression of β2M. Amounts of HIV mRNA within CXCR3+ and CXCR3 subsets are also compared. d In vitro NL4-3 infected and uninfected LNMCs surface stained with 3BNC117 monoclonal antibody. e Flow plots of showing ex vivo 3BNC117 LNMC staining for one HIV positive and two HIV negative donors. f Representative flow plot and aggregate data show proportion of 3BNC117+ CD4+ T cells in LNMC and paired PBMCs for seven donors. g Representative flow plot and aggregate data show proportion of 3BNC117+ CD4+ T cells that either co-express or do not express CXCR3. Statistical differences are calculated using Mann–Whitney U (c, f, g) and Kruskal–Wallis (c) tests and all statistical tests are two-sided. Error bars represent interquartile range (c). Data are presented as median and interquartile range (c). Source data are provided as a source data file.
Fig. 5
Fig. 5. HIV-specific CD8+ T cell responses limit the amount of persistent HIV antigens in lymph nodes during ART.
a, b Intracellular cytokine staining was conducted after stimulating PBMCs and lymph node mononuclear cells (LNMCs) with HIV-Gag. a Representative flow cytometry plots and aggregate data of 14 donors showing IFN-γ+ CD8+ T cells, and b IFN-γ+ CD4+ T cells after stimulation with HIV-1 clade C Gag peptide pools. Correlation analysis of average Gag p24 density; measured from image analysis, with the frequency of c IFN-γ+CD8+ T cells and d IFN-γ+CD4+ T cells in LNMCs and PBMCs. e Representative flow cytometry plots of CFSE-labeled CD4+ and CD8+ T cells after 7-days of stimulation of LNMCs with HIV-1 clade C Gag peptide pools. f Aggregate data correlating CFSEloCD8+ and CFSEloCD4+ T cell responses and Gag p24 density. g Representative flow plot and aggregate data showing frequency of HIV Gag-specific CXCR5+ CD8+ T cells. All statistical tests are two-sided and p values are from the Mann–Whitney U test (a, b, g). Spearman rho (r) and p values are reported for correlation analysis (c, d, f). Source data are provided as a source data file.

Similar articles

Cited by

References

    1. Murray AJ, Kwon KJ, Farber DL, Siliciano RF. The latent reservoir for HIV-1: how immunologic memory and clonal expansion contribute to HIV-1 persistence. J. Immunol. 2016;197:407–417. doi: 10.4049/jimmunol.1600343. - DOI - PMC - PubMed
    1. Puertas MC, et al. Lack of concordance between residual viremia and viral variants driving de novo infection of CD4(+) T cells on ART. Retrovirology. 2016;13:51. doi: 10.1186/s12977-016-0282-9. - DOI - PMC - PubMed
    1. Chun TW. Tracking replication-competent HIV reservoirs in infected individuals. Curr. Opin. HIV AIDS. 2013;8:111–116. doi: 10.1097/COH.0b013e32835d6e1c. - DOI - PubMed
    1. Martinez-Picado J, Deeks SG. Persistent HIV-1 replication during antiretroviral therapy. Curr. Opin. HIV AIDS. 2016;11:417–423. doi: 10.1097/COH.0000000000000287. - DOI - PMC - PubMed
    1. Connick E, et al. CTL fail to accumulate at sites of HIV-1 replication in lymphoid tissue. J. Immunol. 2007;178:6975–6983. doi: 10.4049/jimmunol.178.11.6975. - DOI - PubMed

Publication types