. 2022 Jul 13;5(1):639.
doi: 10.1038/s42003-022-03577-5.

Redefining GBA gene structure unveils the ability of Cap-independent, IRES-dependent gene regulation

Affiliations

Redefining GBA gene structure unveils the ability of Cap-independent, IRES-dependent gene regulation

Keiko Miyoshi et al. Commun Biol. .

Abstract

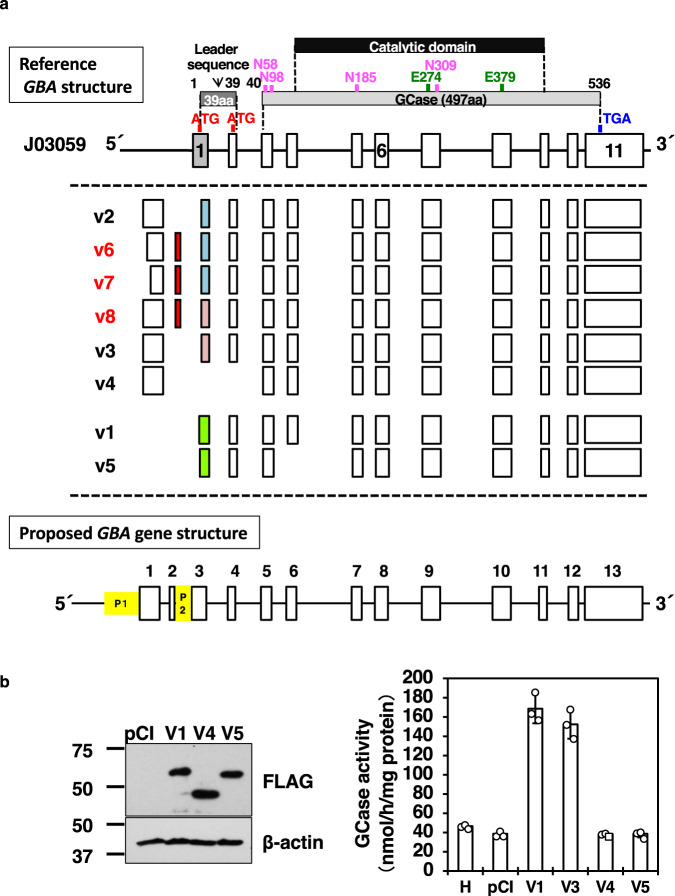
Glucosylceramide is the primary molecule of glycosphingolipids, and its metabolic regulation is crucial for life. Defects in the catabolizing enzyme, glucocerebrosidase (GCase), cause a lysosomal storage disorder known as Gaucher disease. However, the genetic regulation of GCase has not been fully understood. Here we show the redefined structure of the GCase coding gene (GBA), and clarify the regulatory mechanisms of its transcription and translation. First, alternative uses of the two GBA gene promoters were identified in fibroblasts and HL60-derived macrophages. Intriguingly, both GBA transcripts and GCase activities were induced in macrophages but not in neutrophils. Second, we observed cap-independent translation occurs via unique internal ribosome entry site activities in first promoter-driven GBA transcripts. Third, the reciprocal expression was observed in GBA and miR22-3p versus GBAP1 transcripts before and after HL60-induced macrophage differentiation. Nevertheless, these findings clearly demonstrate novel cell-type-specific GBA gene expression regulatory mechanisms, providing new insights into GCase biology.


Conflict of interest statement

The authors declare no competing interests.

Figures

Fig. 1
Fig. 1. Determination of the 5’ ends of a GBA gene.
a Summary cartoon of the 5’ ends of all GBA variants. Upper: Exon-intron structures of the reference sequence J03059 and the corresponding translated GCase protein region (gray box) with a catalytic domain (black box). “ATG” in red, the start codon, “TGA” in blue, the stop codon, “N” in pink, glycosylation sites; “E” in green, catalytic residues. Middle (within dotted lines): Alignment of the eight variants (vs) with adjusted exon positions compared to J03059. Variant accession numbers are shown in the data availability section. As shown, variants are categorized into two groups: P1-driven variants (v2, v6, v7, v8, v3, and v4) and P2-driven variants (v1 and v5). Red boxes indicate newly identified exon two. Exon three subdomains are shown in colored boxes (3i, gray; 3ii, green; 3iii, blue; 3iv, pink). Lower: The proposed GBA gene structure. Yellow boxes indicate the P1 and P2 promoter regions. The number above each box indicates the redefined exon number. b GCase protein expression and enzymatic activities of variants v4 and v5. (Left) The GCase protein expression was analyzed using western blot analysis. Representative data is shown. pCI, an empty vector-transfected HEK293 cell lysate; V1, V4, V5, each variant overexpressed HEK293 cell lysate. (Right) GCase activity of each variant transfected HEK293 cells. H, control HEK293 cells (no treatment); V3, variant v3 in pCIneo-transfected cells; others, similar to the right panel. n = 3 biologically independent samples. Data represent the mean ± STDEV.
Fig. 2
Fig. 2. TSSs of GBA variants in the P1 and P2 promoter regions.
Panels (a, b) indicate P1 and P2 promoter regions spanning 500 bp with the following exon sequences, respectively. The most upstream TSS from P1 promoter is designated as +1, and the following sequence positions are indicated to the right side. Arrows, individual TSSs of the variants (v); blue letters, exon sequences; red letters, SP1 binding sites; yellow highlights, TATA box; green highlights, CAAT box; red boxes, AP1 (JUN/FOS) binding sites; red underlines, CREB binding sites; green underlines, TFEB binding sites.
Fig. 3
Fig. 3. Gene structure and chromosomal position of GBA and GBAP1.
a Structural comparison of GBA and GBAP1. The white boxes indicated exons. Based on the exon 1 and 2 sequences of GBA, upstream exons of GBAP1 were predicted through a homology search of the genome database and are depicted with dashed-line boxes. b The positional relationship between GBA and GBAP1 in chromosome 1. White arrows indicate the direction of GBA and GBAP1.
Fig. 4
Fig. 4. Cell type-specific expression of GBA variants.
a Comparison of the expression levels of GBA transcripts in fibroblasts. The expression levels of GBA transcripts were normalized to those of GAPDH, and expressed as the relative quantity to that of DF2. Each experiment was performed in triplicate. DF, dermal fibroblasts; OF, oral mucosa fibroblasts. b Expression levels of GBA transcripts among different cell types using an in vitro hematopoietic differentiation system of HL60 cells. The expression levels of GBA were normalized to those of PPIA, and expressed as the relative quantity to that of control HL60 cells. Each experiment was performed in triplicate except v6/7, N in v3, C in total GBA were duplicate. C, control HL60 cells (no treatment); M, iMacs; N, iNeuts. c The expression levels of GCase protein by western blot analysis. Representative western blot analysis data is shown. C1 and C2, two individual controls (nontreated HL60 cells); M, iMacs; N, iNeuts, P, positive control (human GBA in pCIneo-transfected HEK293 cell lysate). d GCase activity. C, control HL60 cells (no treatment); M, iMacs; N, iNeuts. Each experiment was performed in triplicate except control (control, n = 6). **p < 0.01. Data represent the mean ± STDEV.
Fig. 5
Fig. 5. Upstream ATG, uORF, and Kozak sequences.
a Positions of uATGs, uORFs, and their Kozak sequences within the region from exon 1 to exon 5. The ATGs are numbered from the 5’ ends of the P1 promoter-controlled transcripts. Two reported start sites (#8 and #10) are indicated in red, and the columns are highlighted in yellow,. The numbers in the table are the predicted sizes of the ORFs for the indicated ATGs on the top line. b Schematic of three kinds of v3 constructs inserted into expression vectors. FLAG tags were added to all constructs at the 3’ end. Top line, CDS only; second line (C), CDS with the original 5’ UTR containing a weak Kozak sequence (V3); third line, CDS with a partial 5’ UTR containing an adequate Kozak sequence (A); fourth line, CDS with a partial 5’ UTR containing a strong Kozak sequence (S). c FLAG-tagged GCase expression with or without glycosylation in HEK293 cells. GCase protein expression was detected by western blot analysis with anti-FLAG antibodies. C, V3, A, and S indicate the same as in b. pCI, empty vector; H, HEK293 cells without transfection. The molecular sizes are indicated on the right side. The experiment was performed in triplicate and the representative data was shown.
Fig. 6
Fig. 6. IRES activity in the 5’ UTRs of GBA variants.
a Formula for estimation of IRES activity by bicistronic reporter assay and the reporter construct. The 5’ UTRs of GBA variants (pink box) were inserted into the pEF1a-RF vector. EF1a, EF1α promoter; hRL, Renilla luciferase CDS; FL, firefly luciferase CDS. b IRES activity in OFs. c IRES activity in HL60-derived macrophages (HL60 + PMA). Gray bar, 20 nM PMA; black bar, 40 nM PMA. d IRES activity in OFs treated with 3 nM PMA. e Effects of PMA on IRES activity in OFs. White bar, no treatment; gray bar, 3 nM PMA; black bar, 10 nM PMA. Each experiment was performed in triplicate. *p < 0.05. Data represent the mean ± STDEV.
Fig. 7
Fig. 7. GCase translation in OF2 cells after rapamycin treatment.
a Diagram of sample preparation. OF2 cells were precultured in media with 0.5% FBS for 24 h before rapamycin treatment. The cells were treated rapamycin for 1 h, FBS was added up to 10% and maintained for 48 h. b Results of GCase expression in rapamycin-treated OF2 cells, as determined by western blot analysis. EtOH; 0.1% ethanol, FBS stim.; FBS stimulation. c Confirmation of the GCase expression remove its glycosylation. Each experiment was performed in the triplicate and representative data was shown.
Fig. 8
Fig. 8. Analyses of the GBA 3’ end.
a Summary of GBA 3’-RACE. The top 2 lines indicate the known structures of J03059 and GBA variants v1 to v5. #1–3 are the results of this study. The boxes indicate the exons. Gray, coding region; white, UTR. The number is the size of exon 13. In the middle, the positions of putative poly (A) addition signals are indicated in blue (Horowitz, et al.) and red (Beaudoing et al.). b In silico analysis of miRNA binding to GBA. Red, miR22-3p based on Straniero et al.; black, database search results obtained using miRDB. c, d Gene expression of GBA, GBAP1 and miR22-3p in fibroblasts (c) and HL60 derivatives (d). The qPCR results for GBA and GBAP1 were normalized to 18S rRNA expression, whereas miR22-3p was normalized to RNU6 expression, respectively. In d, after normalized expression value, calibrated as a relative quantity to no-treated HL60 (C1). Black bar, GBA; white bar, GBAP1; gray bar, miR22-3p. Each experiment was performed in triplicate. Data represent the mean ± STDEV.

Similar articles

Cited by

References

    1. Canals D, Perry DM, Jenkins RW, Hannun YA. Drug targeting of sphingolipid metabolism: sphingomyelinases and ceramidases. Br. J. Pharm. 2011;163:694–712. doi: 10.1111/j.1476-5381.2011.01279.x. - DOI - PMC - PubMed
    1. Hannun YA, Obeid LM. Principles of bioactive lipid signalling: lessons from sphingolipids. Nat. Rev. Mol. Cell Biol. 2008;9:139–150. doi: 10.1038/nrm2329. - DOI - PubMed
    1. Astudillo L, et al. Glucosylceramidases and malignancies in mammals. Biochimie. 2016;125:267–280. doi: 10.1016/j.biochi.2015.11.009. - DOI - PubMed
    1. Lingwood, C. A. Glycosphingolipid functions. Cold Spring Harb Perspect Biol3, 10.1101/cshperspect.a004788 (2011). - PMC - PubMed
    1. Mistry PK, et al. Gaucher disease: progress and ongoing challenges. Mol. Genet Metab. 2017;120:8–21. doi: 10.1016/j.ymgme.2016.11.006. - DOI - PMC - PubMed

Publication types

MeSH terms

Substances