. 2022 Jul;607(7919):548-554.
doi: 10.1038/s41586-022-04962-0. Epub 2022 Jul 13.

Retrograde movements determine effective stem cell numbers in the intestine

Affiliations

Retrograde movements determine effective stem cell numbers in the intestine

Maria Azkanaz et al. Nature. 2022 Jul.

Abstract

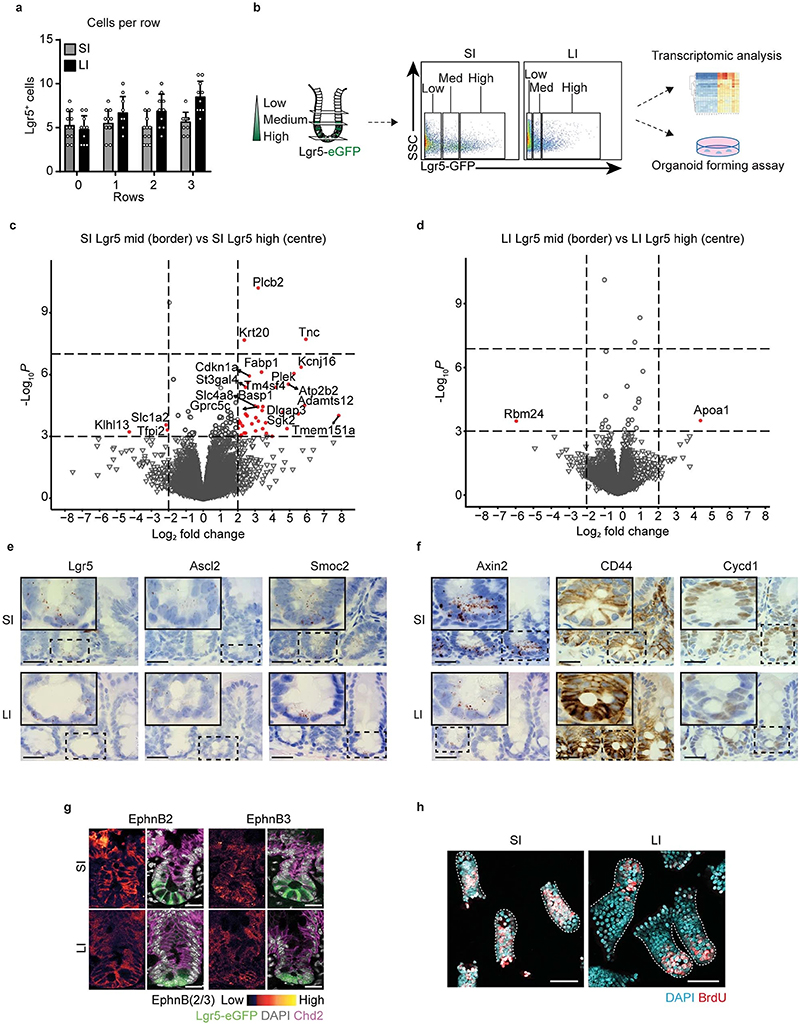
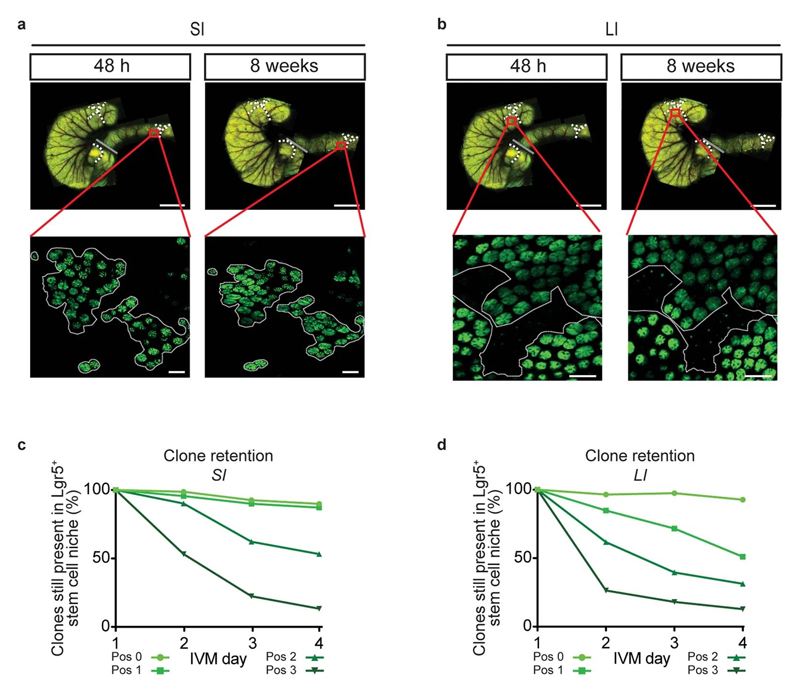
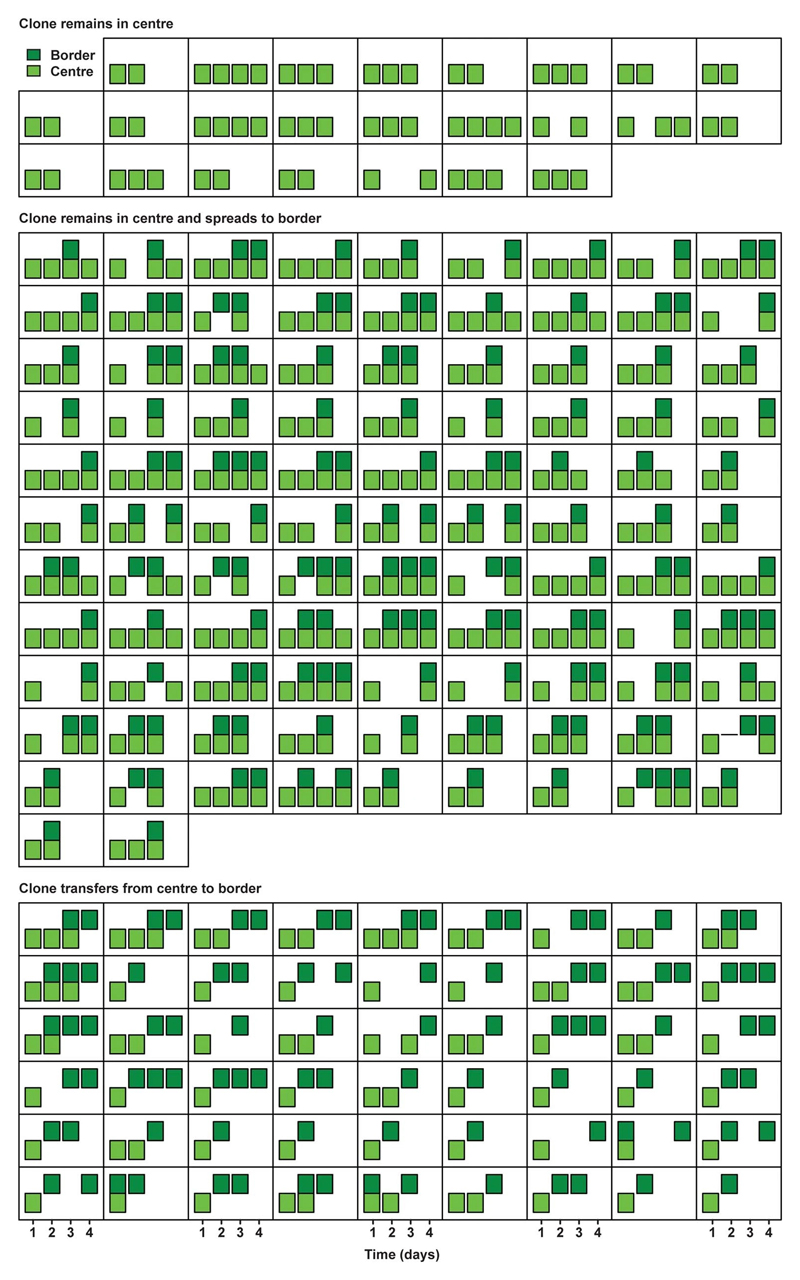
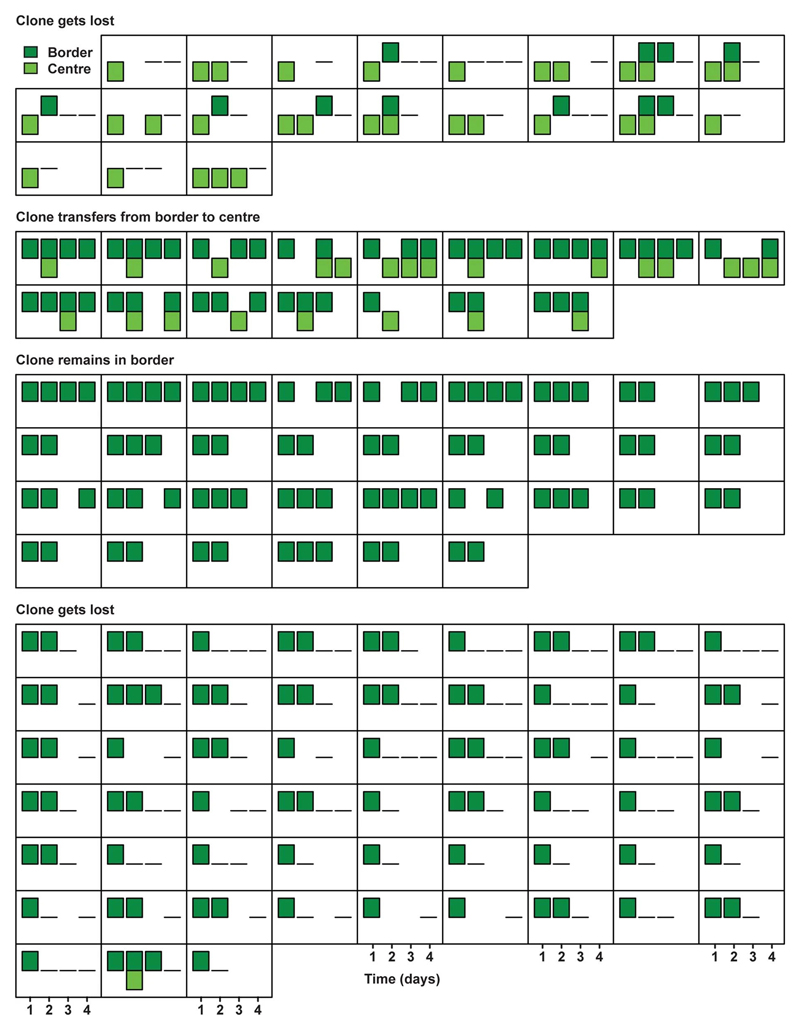
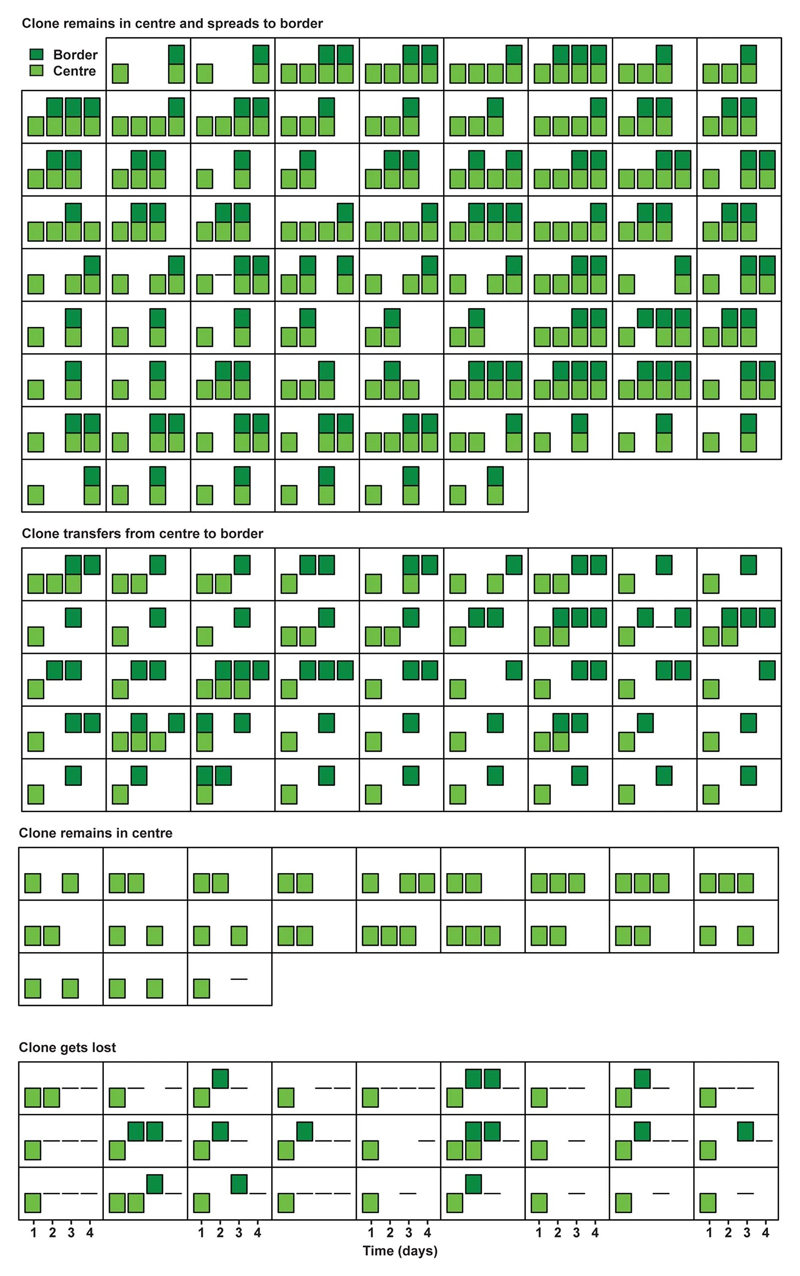
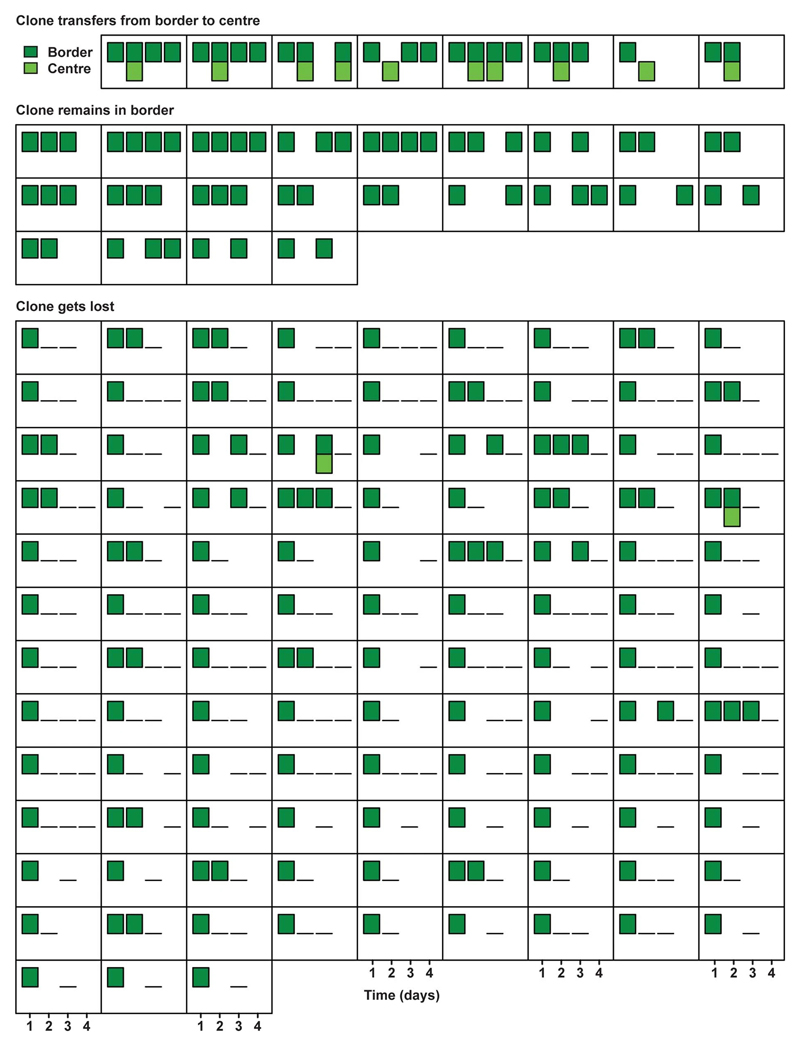
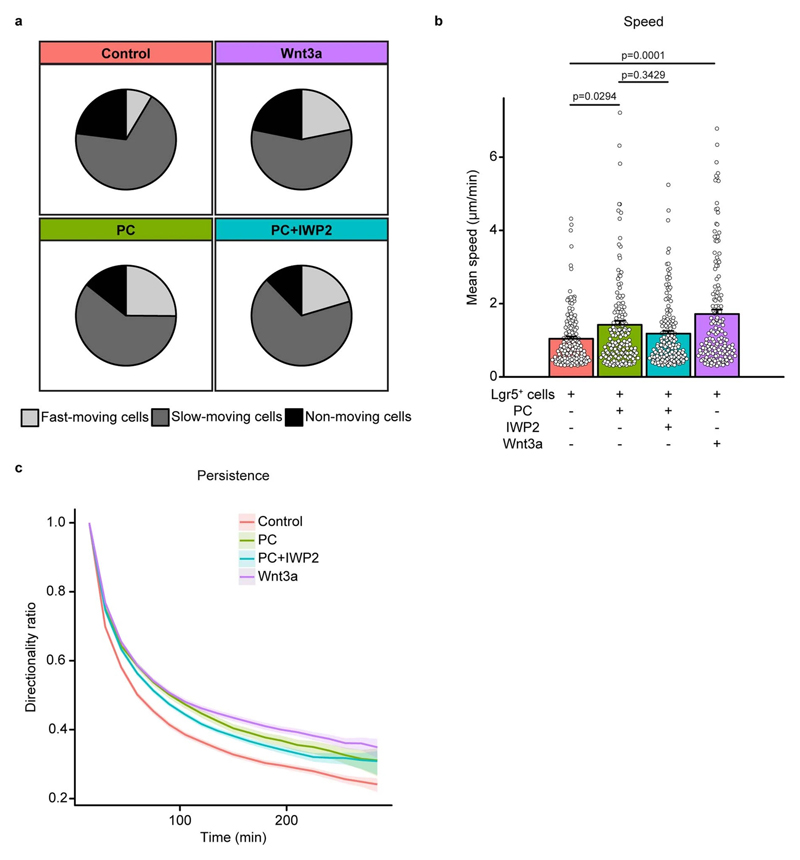
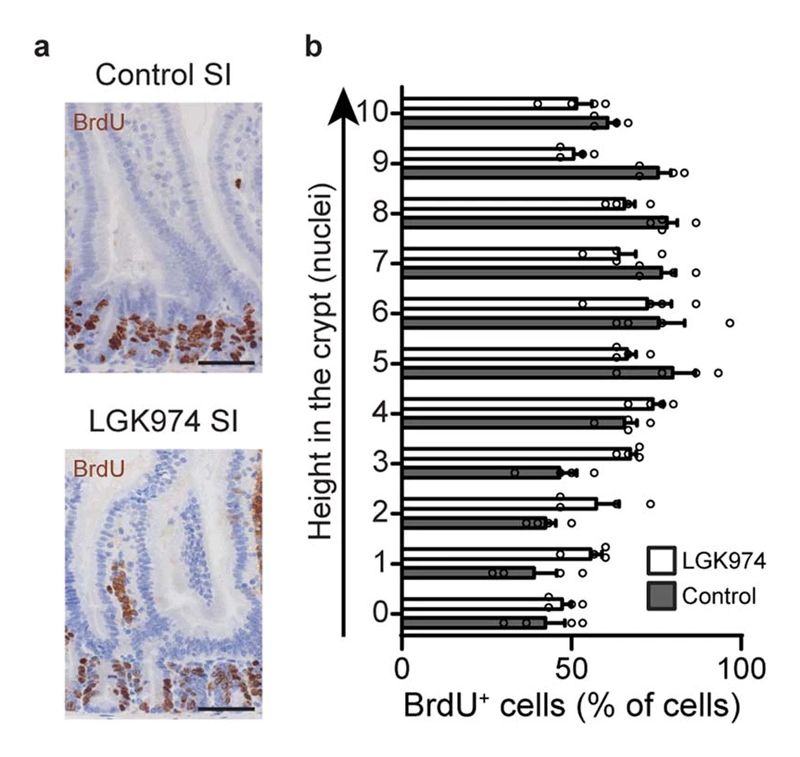
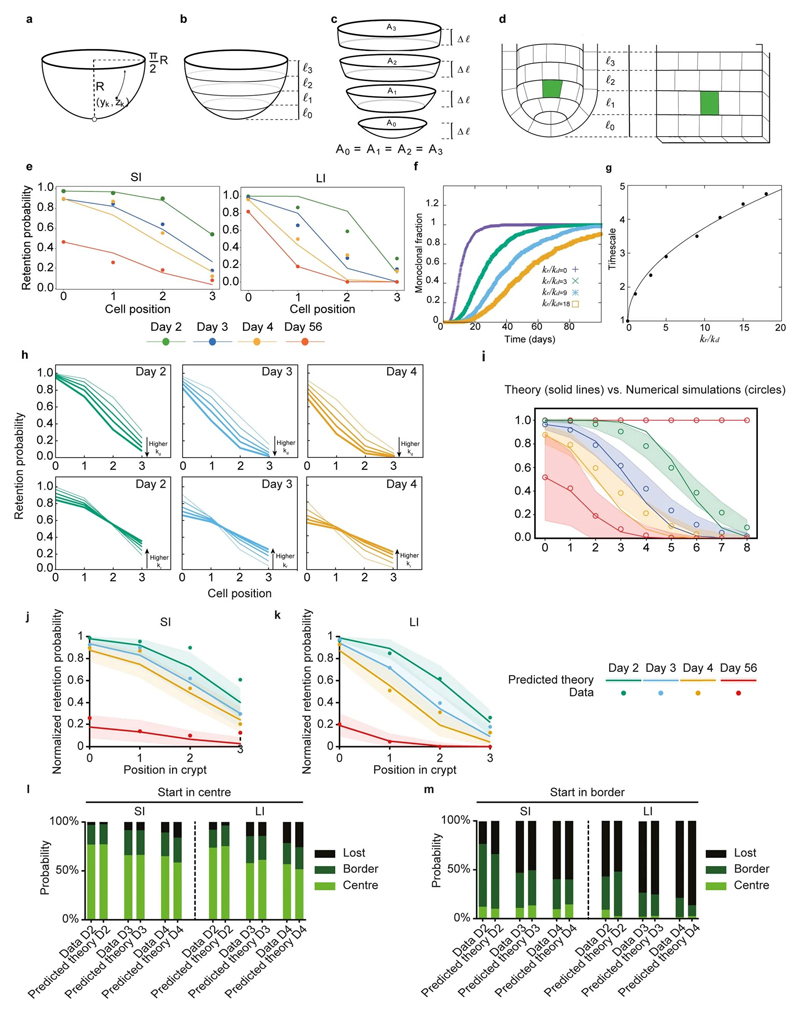
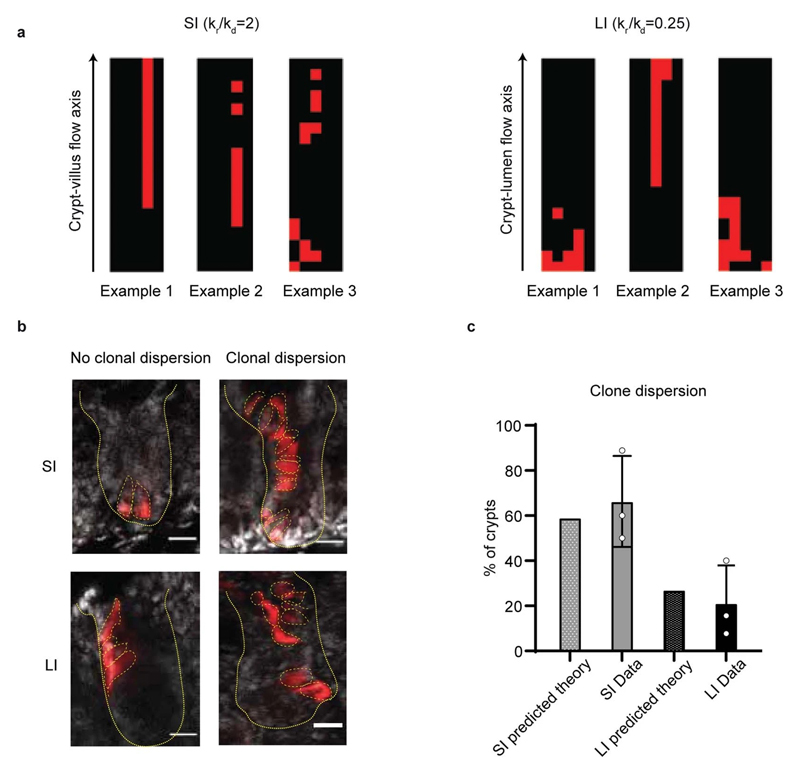
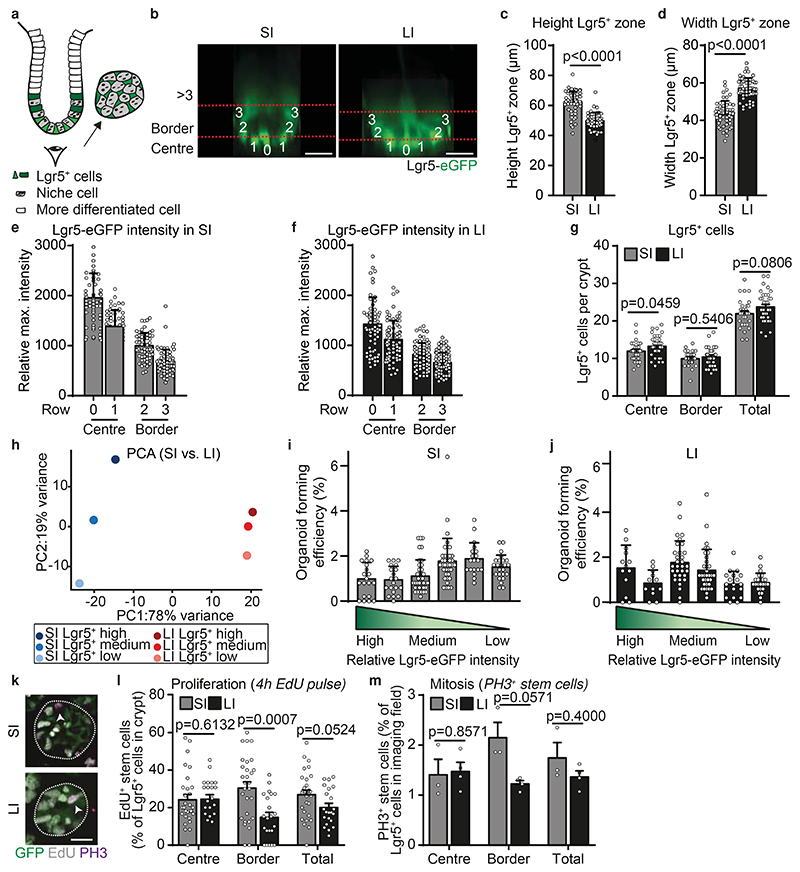
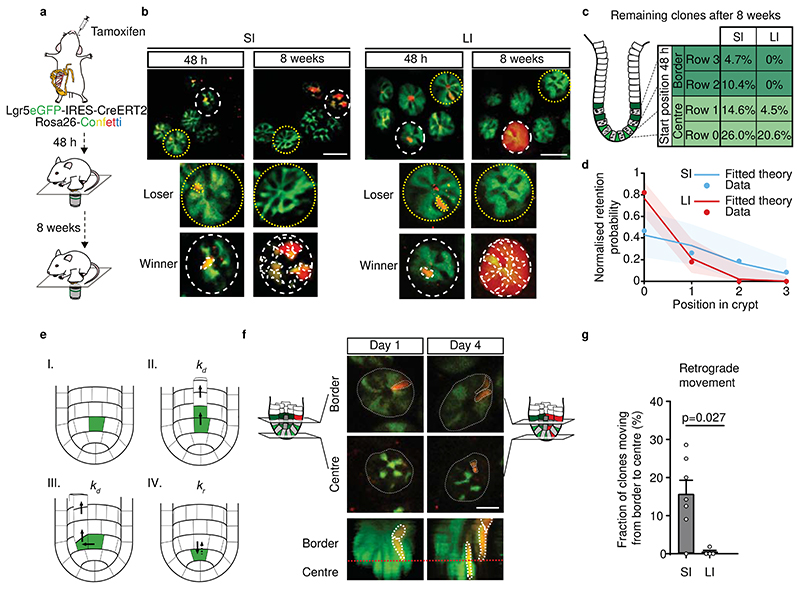
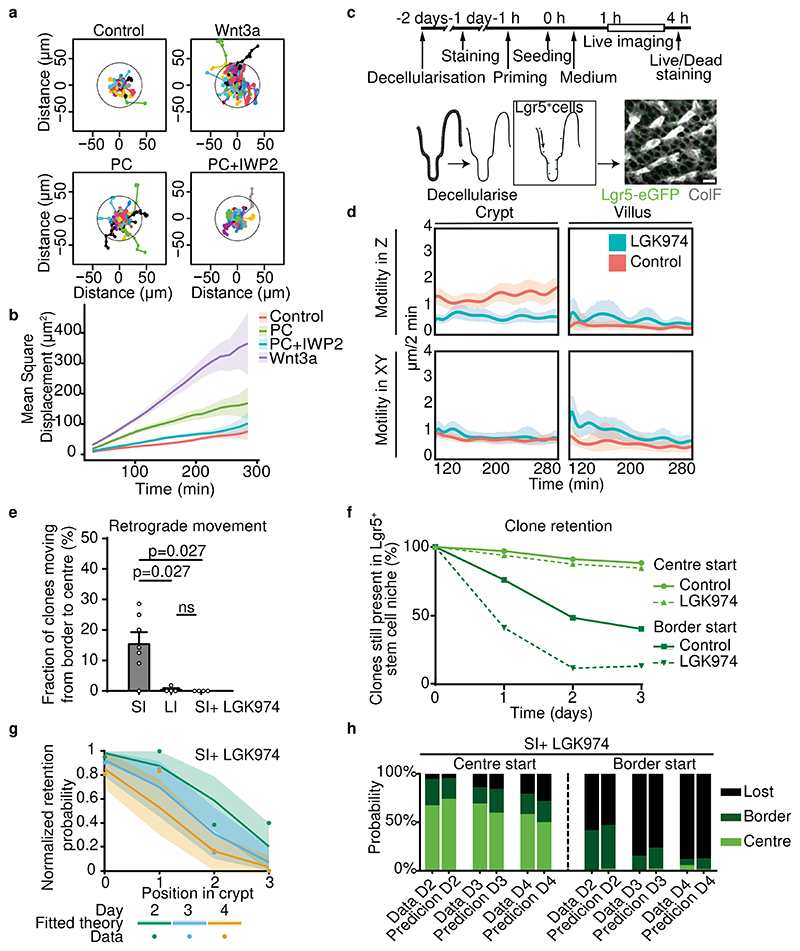
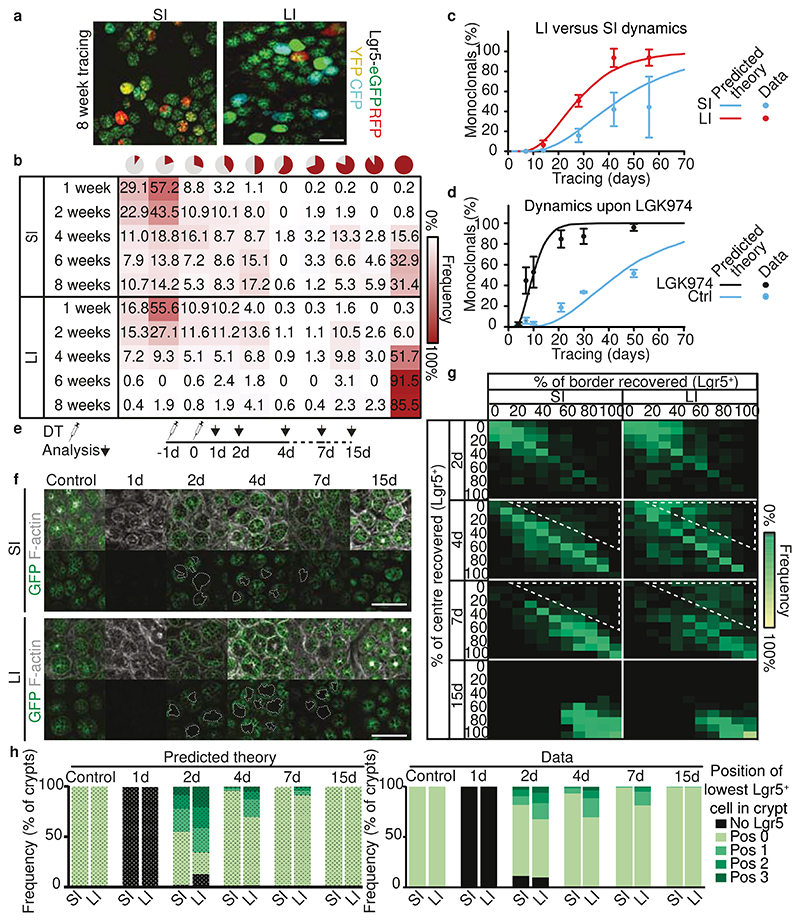
The morphology and functionality of the epithelial lining differ along the intestinal tract, but tissue renewal at all sites is driven by stem cells at the base of crypts1-3. Whether stem cell numbers and behaviour vary at different sites is unknown. Here we show using intravital microscopy that, despite similarities in the number and distribution of proliferative cells with an Lgr5 signature in mice, small intestinal crypts contain twice as many effective stem cells as large intestinal crypts. We find that, although passively displaced by a conveyor-belt-like upward movement, small intestinal cells positioned away from the crypt base can function as long-term effective stem cells owing to Wnt-dependent retrograde cellular movement. By contrast, the near absence of retrograde movement in the large intestine restricts cell repositioning, leading to a reduction in effective stem cell number. Moreover, after suppression of the retrograde movement in the small intestine, the number of effective stem cells is reduced, and the rate of monoclonal conversion of crypts is accelerated. Together, these results show that the number of effective stem cells is determined by active retrograde movement, revealing a new channel of stem cell regulation that can be experimentally and pharmacologically manipulated.


Conflict of interest statement

Competing interests

The authors declare no competing interests.

Figures

Extended Data Figure 1
Extended Data Figure 1. Crypt characteristics in small and large intestine.
a, Quantification of the number of Lgr5+ cells per position in crypt of SI (n=12 crypts) and LI (n=12 crypts) in Lgr5eGFP-Ires-CreERT2 mice. Mean +/- SD are plotted b, Schematic representation of experimental setup for RNA-seq and organoid forming assay. c,d, Volcano plots showing log2 fold-change (x-axis) and -Log10 p-value (y-axis) of genes differentially expressed between Lgr5+ cells with medium intensity (border) and Lgr5+ cells with high intensity (centre). Genes that were significantly altered in border compared with centre Lgr5+ cells are highlighted in red (Log2 fold change >2, -Log10 p-value <0.001) in SI (c) and LI (d), n=4 mice for each condition. e, Stem cell markers (Lgr5, Ascl2 and Smoc2) in situ hybridization (ISH) in C57/B6 mouse SI (top) and LI (bottom) crypts, n=4 mice. Scale bar, 100 μm. f, Wnt targets (AXIN2, CD44, CYCD1) ISH and immunohistochemistry (IHC) in C57/B6 mouse SI (top) and LI (bottom) crypts, n=4 mice. Scale bar, 100 μm. g, Immunofluorescence (IF) staining of Ephrin B2 and Ephrin B3 in C57/B6 mouse SI (top) and LI (bottom) crypts, n=3 experiments. Scale bar, 20μm. h, Confocal images of isolated crypts (dotted outline) of SI (left), and LI (right), proliferating cells were identified by BrdU incorporation upon 2-hour pulse (red). Nuclei were labelled using DAPI (blue), n=10 experiments. Scale bar, 50μm.
Extended Data Figure 2
Extended Data Figure 2. Visualising effective stem cells by intravital imaging in small and large intestine. a,b, Representative
overview images 48 hours (left) and 8 weeks (right) after tracing in Lgr5eGFP-Ires-CreERT2 mice from 6 independent experiments. Dotted lines represent same areas. Grey lines indicate SI LI boundary. Lower pictures represent intravital images showing crypt patterns (Lgr5-eGFP in green) at 48h and 8w after tracing in SI (a) and LI (b). Dotted lines are examples of retraced patchy Lgr5+ areas. Scale bar, 5 mm (top), 100 μm (bottom) from 5 independent experiments. c,d, Quantification of retention within the Lgr5+ zone of clones starting from different positions in the niche (shades of green) in SI (c) and LI (d) as followed by IVM. SI: n=305 clones in 9 mice; LI: n=311 clones in 5 mice (see Ext. Data Fig. 3-6).
Extended Data Figure 3
Extended Data Figure 3. Short-term evolution of clones in SI (1).
Presence in centre (light green) and border (dark green) of individual clones in Lgr5eGFP-Ires-CreERT2; R26-Confetti mice followed by short-term IVM in SI is plotted over time (squares represent individual clones, with a bar per day). Plotted are clones starting and remaining in the centre (top panel), starting and remaining in centre while spreading to border (middle panel) and starting in the centre and transferring to border (bottom panel).
Extended Data Figure 4
Extended Data Figure 4. Short-term evolution of clones in SI (2).
Presence in centre (light green) and border (dark green) of individual clones in Lgr5eGFP-Ires-CreERT2; R26-Confetti mice followed by short-term IVM in SI are plotted over time (represent individual clones with a bar per day). Plotted are clones starting in the centre and getting lost (top panel), starting in border and transferring to centre (second panel), starting in border and remaining in border, and starting in border before getting lost.
Extended Data Figure 5
Extended Data Figure 5. Short-term evolution of clones in LI (1).
Presence in centre (light green) and border (dark green) of individual clones in Lgr5eGFP-Ires-CreERT2; R26-Confetti mice followed by short-term IVM in LI are plotted over time (squares represent individual clones with a bar per day). Plotted are clones starting and remaining in the centre while spreading to border (top panel), starting in the centre and transferring to border (second panel), starting and remaining in centre without spreading to border (third panel) and starting in the centre before getting lost from the niche (bottom panel).
Extended Data Figure 6
Extended Data Figure 6. Short-term evolution of clones in LI (2).
Presence in centre (light green) and border (dark green) of individual clones in Lgr5eGFP-Ires-CreERT2; R26-Confetti mice followed by short-term IVM in LI are plotted over time (squares represent individual clones with a bar per day). Clones are Plotted are clones starting in border and transferring to centre (top panel), starting in border and remaining there (second panel), starting in border before getting lost (bottom panel).
Extended Data Figure 7
Extended Data Figure 7. Wnt enhances motility in vitro.
a, Percentage of fast-moving (>2 μm/min), slow-moving (0.3-2 μm/min) and non-moving (<0.3 μm/min) Lgr5+ cells. The imaged Lgr5+ cells were isolated from Lgr5-EGFP-ires-creERT2;R26R-confetti organoids and exposed to (I) control medium (n=408 cells), (II) medium supplemented with Wnt3a (n=582 cells), (III) medium supplemented with Paneth cells (PC) (n=418 cells), or (IV) medium supplemented with PC and Wnt inhibitor (IWP2) (n=431 cells) in Matrigel from 3 independent biological replicates. b,c Speed (b) and directionality ratio (persistence) over time calculated as mean displacement/length of the trajectory. Significance was determined by a two-sided Mann-Whitney test.(c) of single Lgr5+ cells in control medium, medium supplemented with Wnt3a, co-culture with PC and co-culture PC with IWP2. Shown are n=150 random cell tracks of Lgr5+ cells from 2 independent organoid lines, 50 from each of 3 independent biological replicates. Each point represents the mean value of each track. Shown are mean ± SEM.
Extended Data Figure 8
Extended Data Figure 8. The effect of LGK974 on stem cell dynamics in small intestinal crypts.
a, Representative image of 2h BrdU pulse in SI crypts of control and LGK974-treated mice. Scale bar, 50μm. b, Quantification of cells positive for BrdU per position in SI crypts of control and LGK974-treated mice. Of note, position is based on nuclei count which does not discriminate between stem cells and PCs, and the Lgr5+ zone ends around nuclear position 6-8. Mean +/- SEM are plotted. (n=120 crypts examined over 4 independent experiments from 4 mice, 30 crypts per mouse).
Extended Data Figure 9
Extended Data Figure 9. Biophysical modelling of stochastic conveyor belt dynamics in small versus large intestine.
a, An intestinal crypt is abstracted as a hemispherical surface. A cell experiences net upwards force due to the divisions taking place at lower positions, together with stochastic repositioning events. b, This hemispheric region can be segmented by cuts at different heights, ℓ0, ℓ1, ℓ2, ℓ3. c, If the sections defined by these cuts are of the same width, Δℓ, then the area of each is the same, which provides an explanation for the near-constant number of Lgr5+ cell at each position. d, This allows us to approximate the system as consecutive layers of cells on a cylinder. e, Analytical solutions for the stochastic conveyor belt model (probability of clone retention per time). Left (resp. right) plot shows the retention probability as a function of the starting position of the mother cell of the lineage for the SI (resp. LI). Points show the experimental data for wild-type (same as Fig. 3), lines are the prediction of the stochastic conveyer belt dynamics given by equation (1.3) of the SI Theory Note. In both panels, the color scheme is: Green, 2 days, Blue, 3 days, orange, 4 days, and red 56 days post-labelling. f, Average monoclonal conversion in crypts for different values of kr kd and rescaled time it takes to convert. g, Corresponding time of conversion as a function of kr kd (points) which are very well fitted by a square root (lines), showing that the time increases close to linearly with ✓kr /kd. h, Sensitivity analysis of the 2D numerical simulations. Top, effect of increasing values of the division rate kd on the resulting short-term clonal retention dynamics as a function of initial cell positions at days 2, 3 and 4 (left, middle and right panel respectively), for constant kr=0.25 (LI best-fit value). Increasing thickness of the lines indicate increasing division rate (or alternatively decreasing division time: 2.3, 1.7, 1.4, 1.2, 0.9 divisions per day respectively - note that the middle curve thus corresponds to the value of 1.4 divisions per day used in the main text). Bottom, Effect of increasing values of the division rate kr on the resulting short-term clonal retention dynamics as a function of initial cell positions at days 2, 3 and 4 (left, middle and right panel respectively), for constant kd=0.5 (LI best-fit value). Increasing thickness of the lines indicate increasing kr=0.25,1,2,3, 4 (note that the first curve thus corresponds to the best fit value used in the main text). i, Comparison between 1D analytical theory (solid lines) and 2D simulations (circles) for the clonal retention probability (y-axis, parameters chosen as kr=2, 1/kd=1.2 divisions per day) as a function of initial starting position for the clone (x-axis) and time (colors red, green, blue, yellow and red indicating resp. day 1, day 2, day 3, day 4 and day 56). Dashed region indicates the standard deviation observed in the simulations for the respective simulation time. j,k, Normalised probability of retention in Lgr5+ zone for different starting positions over time in SI (f; n=305 clones in 9 mice) and LI (g; n=334 clones in 5 mice) predicted by model (solid lines and shaded intervals, mean with 95% confidence interval) and experimental data (dots). l,m, Probability of presence in centre, border or loss of centre-starting (left) and border-starting clones (right) over time in SI (h, n=305 clones in 9 mice) and LI (I, n=311 clones in 5 mice), comparing data (left bar) and theory (right bar).
Extended Data Figure 10
Extended Data Figure 10. Clonal dispersion in small and large intestine.
a, Typical outputs of 2D numerical simulations of a single clonal labelling event (labelled cells indicated in red) for the parameter set extracted from SI (left) and LI (right) data. As expected, larger values of kr result in a higher probability of clonal fragmentation (defined as the probability of a given clone displaying two fragments separated by a row of clonally non-labelled cells, see SI Note for details on the simulations). b, SI (top) and LI (bottom) crypts with sparse lineage-tracing experiment, where a single lineage (red here, induced and imaged 7 days post induction) can be observed. Clonal dispersion due to cell rearrangements is either observed (right) or not (left). Scale bar, 20μm. c, Probability of clonal fragmentation in SI and LI (data shown in grey (SI) and black (LI), theory in dotted bars extracted from the parameters in panel a), showing good agreement. Data is based on n=3 mice (20 crypts for SI and 55 crypts for LI). Each data point represents percentage of clonal dispersed crypts in one mouse, and bars show mean +/- SD.
Figure 1
Figure 1. The spatial organization and functional potential of Lgr5+ cells are comparable in the SI and LI.
a, Schematic crypt representation. b, Representative XY-images of SI and LI crypts in Lgr5eGFP-Ires-CreERT2 mice from n=4 experiments. The relative position of Lgr5+ cells in the central (row 0 and 1) or border region (row 2 and 3) of the stem cell niche. c,d, Height (c) and width (d) of Lgr5-GFP+ zone in SI and LI (c,d, n=50 crypts (SI), n=48 crypts (LI)). e,f, Relative maximum intensity of Lgr5-eGFP signal in SI (e) and LI (f) (e, n=47, 62, 61 and 62 crypts; f, n=66, 78, 77 and 84 crypts for row 0, 1, 2 and 3 respectively). g, Number of Lgr5+ cells in centre, border and total in SI and LI crypts (n=50 and 48 crypts, respectively). h, Principal component analysis of RNA-seq in Lgr5 high, medium and low cells (i.e. centre, border and >3 row cells). Dots, mean (n=3 mice). i,j, Organoid forming efficiency of Lgr5+ cells with high, medium and low intensity isolated from SI (i) and LI (j). Dots, percentage of cells that formed organoids in a BME drop (Left to right, i, n= 20, 20, 39, 38, 19 and 24; j, n= 13, 12, 32, 34, 19 and 24 BME drops from n=3 experiments in 3 mice). k, Confocal images of Lgr5-eGFP cells in S-phase (4h EdU) and mitosis (phospho-histone H3 (PH3), arrow heads) in SI and LI crypts (dotted outline). l,m, EdU+ (l) and PH3+ (m) Lgr5+ cells as a percentage of the total Lgr5+ pool in SI (l, n=33 crypts; m, n=3 image fields) and LI (l, n=22 crypts; m, n=3 image fields). Bars, mean +/- SEM. Significance in (c, d, l and m) was determined by two-sided Mann-Whitney tests. Scale bars: 20μm (b and k).
Figure 2
Figure 2. Different numbers of effective stem cells in SI and LI due to retrograde movement.
a, Schematic representation of experimental setup. b, Representative overview images 48 hours and 8 weeks after tracing in SI (left) and LI (right) from 6 independent experiments. Dotted yellow and white circles represent retraced crypts. A labelled clone can either be lost (loser, dashed yellow circle) or retained (winner, dashed white circle). c, Clone retention from different starting positions in SI (n=267 clones in 6 mice) and LI (n=294 clones in 6 mice). d, Normalised retention probability at 8 weeks as predicted by the model (lines with 95% confidence interval) and experimental data (dots) in SI (n=267 clones in 6 mice) and LI (n=294 clones in 6 mice). e, Model sketch: the crypt is abstracted as cylinder coupled to a hemispheric region (I). kd is the upward movement rate due to cell division (II, III) and kr is the random cell relocation rate, including retrograde movements (IV). f, Example of a border starting clone at day 1 that moved to the centre at day 4 (retrograde movement) from 7 independent experiments. g, Percentage of border starting clones present in centre on day 3 in SI (n=59 clones in 7 mice) and LI (n=109 clones in 4 mice). Mean +/- SEM. Significance was determined by a two-sided Mann-Whitney test. Scale bars: 50μm (b), 20μm (f).
Figure 3
Figure 3. Wnt promotes Lgr5+ cell migration.
a, Normalised migration tracks of single Lgr5+ cells isolated from Lgr5-EGFP-ires-creERT2;R26R-confetti organoids in control medium, medium supplemented with Wnt3a, co-culture with Paneth cells (PC), or co-culture PC with Wnt inhibitor (IWP2) in Matrigel (n=150 random tracks of Lgr5+ cells from 2 organoid lines, 3 biological replicates). b, Mean square displacement (MSD) calculated as a function of time (n=150 cells, 3 biological replicates). Data, mean +/- SEM. c, Schematic representation of experimental setup for analysing cell movement on decellularised intestinal scaffolds. d, The motility of Lgr5+ cells was determined along the crypt-villus axis (motility in Z) and along the lateral axis (motility in XY) (n=150-200 cell tracks from 3 decellularised intestines for each control (vehicle) and LGK974 treated group). Data, mean with 95% confidence interval. e, Percentage of border starting clones present in the crypt centre on day 3 (n=59, 109, 75 clones in 7, 4, 4 mice for SI, LI and SI upon LGK974 treatment respectively). Bars, mean +/- SEM. Significance was determined by a two-sided Mann-Whitney test. f, Quantification of retention within the Lgr5+ zone of centre- or border-starting clones in crypts of control (solid lines) and LGK974-treated (dashed lines) mice as followed by IVM (n=75 clones in 4 mice). g, Normalised retention probability in the Lgr5+ zone in LGK974-treated SI (n=75 clones in 4 mice, data re-analysed from predicted by model (solid lines, mean with 95% confidence interval) and experimental data (dots). h, Probability of a clone starting either in niche centre (left) or border (right) to be present in the centre, border or to be lost from the Lgr5+ zone over time in SI of LGK974-treated mice, comparing data (left bar) and theory (right bar) (n=75 clones in 4 mice). See Supplementary Note, section 2.2.3 for details. Scale bars: 50μm (c).
Figure 4
Figure 4. Consequences of retrograde movement.
a, Representative maximum projections of crypt bottoms 8 weeks after induction in SI and LI (n=5 independent experiments). b, Heat map showing frequency of clone sizes at different time points in SI and LI. c, Monoclonal crypts in SI and LI over time predicted by model (solid line) and real data in SI and LI. Dots, mean +/- SD (b,c, n= 444, 375, 218, 152, 151 clones in 3, 4, 3, 5, 7 mice (SI); n= 304, 465, 236, 164, 531 in 3, 4, 3, 5, 8 mice (LI) for 1, 2, 4, 6 and 8 weeks respectively). d, Monoclonal crypts in SI of control and LGK974 treated mice (n for control= 3, 3, 4, 4, 3, 3 mice; n for LGK974= 2, 4, 3, 5, 3, 3 mice for day 4, 7, 10, 21, 30, and 50 respectively, 200 clones per mouse) over time predicted by model (solid line) and real data reanalysed from. Dots, mean +/- SEM. See Supplementary Note section 2.2.3 for details. e, Schematic representation. Targeted ablation of Lgr5+ cells by two DT injections in 19 Lgr5DTR:EGFP mice. f, Representative images of untreated and DT treated mice at different time points post ablation (n= 3 independent experiments). g, Heatmap of the percentage of crypts recovered in centre and border regions in the SI and LI (n= 5, 3, 4, 3 mice for day 2, 4, 7, and 15 respectively). Note the faster recovery kinetics of SI crypts (white highlighted area). h, Best numerical fit for the position of lowest Lgr5+ cell using the biophysical model (left), predicting a faster dynamics in the presence of a larger amount of retrograde movements, and experimental data (right) (n= 2, 3, 5, 3, 4, 3 mice for control, day 1, 2, 4, 7, and 15 respectively). Scale bars: 200μm (a), 100μm (f).

Comment in

Similar articles

Cited by

References

    1. Lopez-Garcia C, Klein AM, Simons BD, Winton DJ. Intestinal stem cell replacement follows a pattern of neutral drift. Science. 2010;330:822–825. doi: 10.1126/science.1196236. - DOI - PubMed
    1. Snippert HJ, et al. Intestinal crypt homeostasis results from neutral competition between symmetrically dividing Lgr5 stem cells. Cell. 2010;143:134–144. doi: 10.1016/j.cell.2010.09.016. - DOI - PubMed
    1. Barker N, et al. Identification of stem cells in small intestine and colon by marker gene Lgr5. Nature. 2007;449:1003–1007. doi: 10.1038/nature06196. - DOI - PubMed
    1. Breault DT, et al. Generation of mTert-GFP mice as a model to identify and study tissue progenitor cells. Proc Natl Acad Sci U S A. 2008;105:10420–10425. doi: 10.1073/pnas.0804800105. - DOI - PMC - PubMed
    1. Powell AE, et al. The pan-ErbB negative regulator Lrig1 is an intestinal stem cell marker that functions as a tumor suppressor. Cell. 2012;149:146–158. doi: 10.1016/j.cell.2012.02.042. - DOI - PMC - PubMed