. 2022 Aug;608(7924):813-818.
doi: 10.1038/s41586-022-04931-7. Epub 2022 Jul 13.

Structure of Tetrahymena telomerase-bound CST with polymerase α-primase

Affiliations

Structure of Tetrahymena telomerase-bound CST with polymerase α-primase

Yao He et al. Nature. 2022 Aug.

Abstract

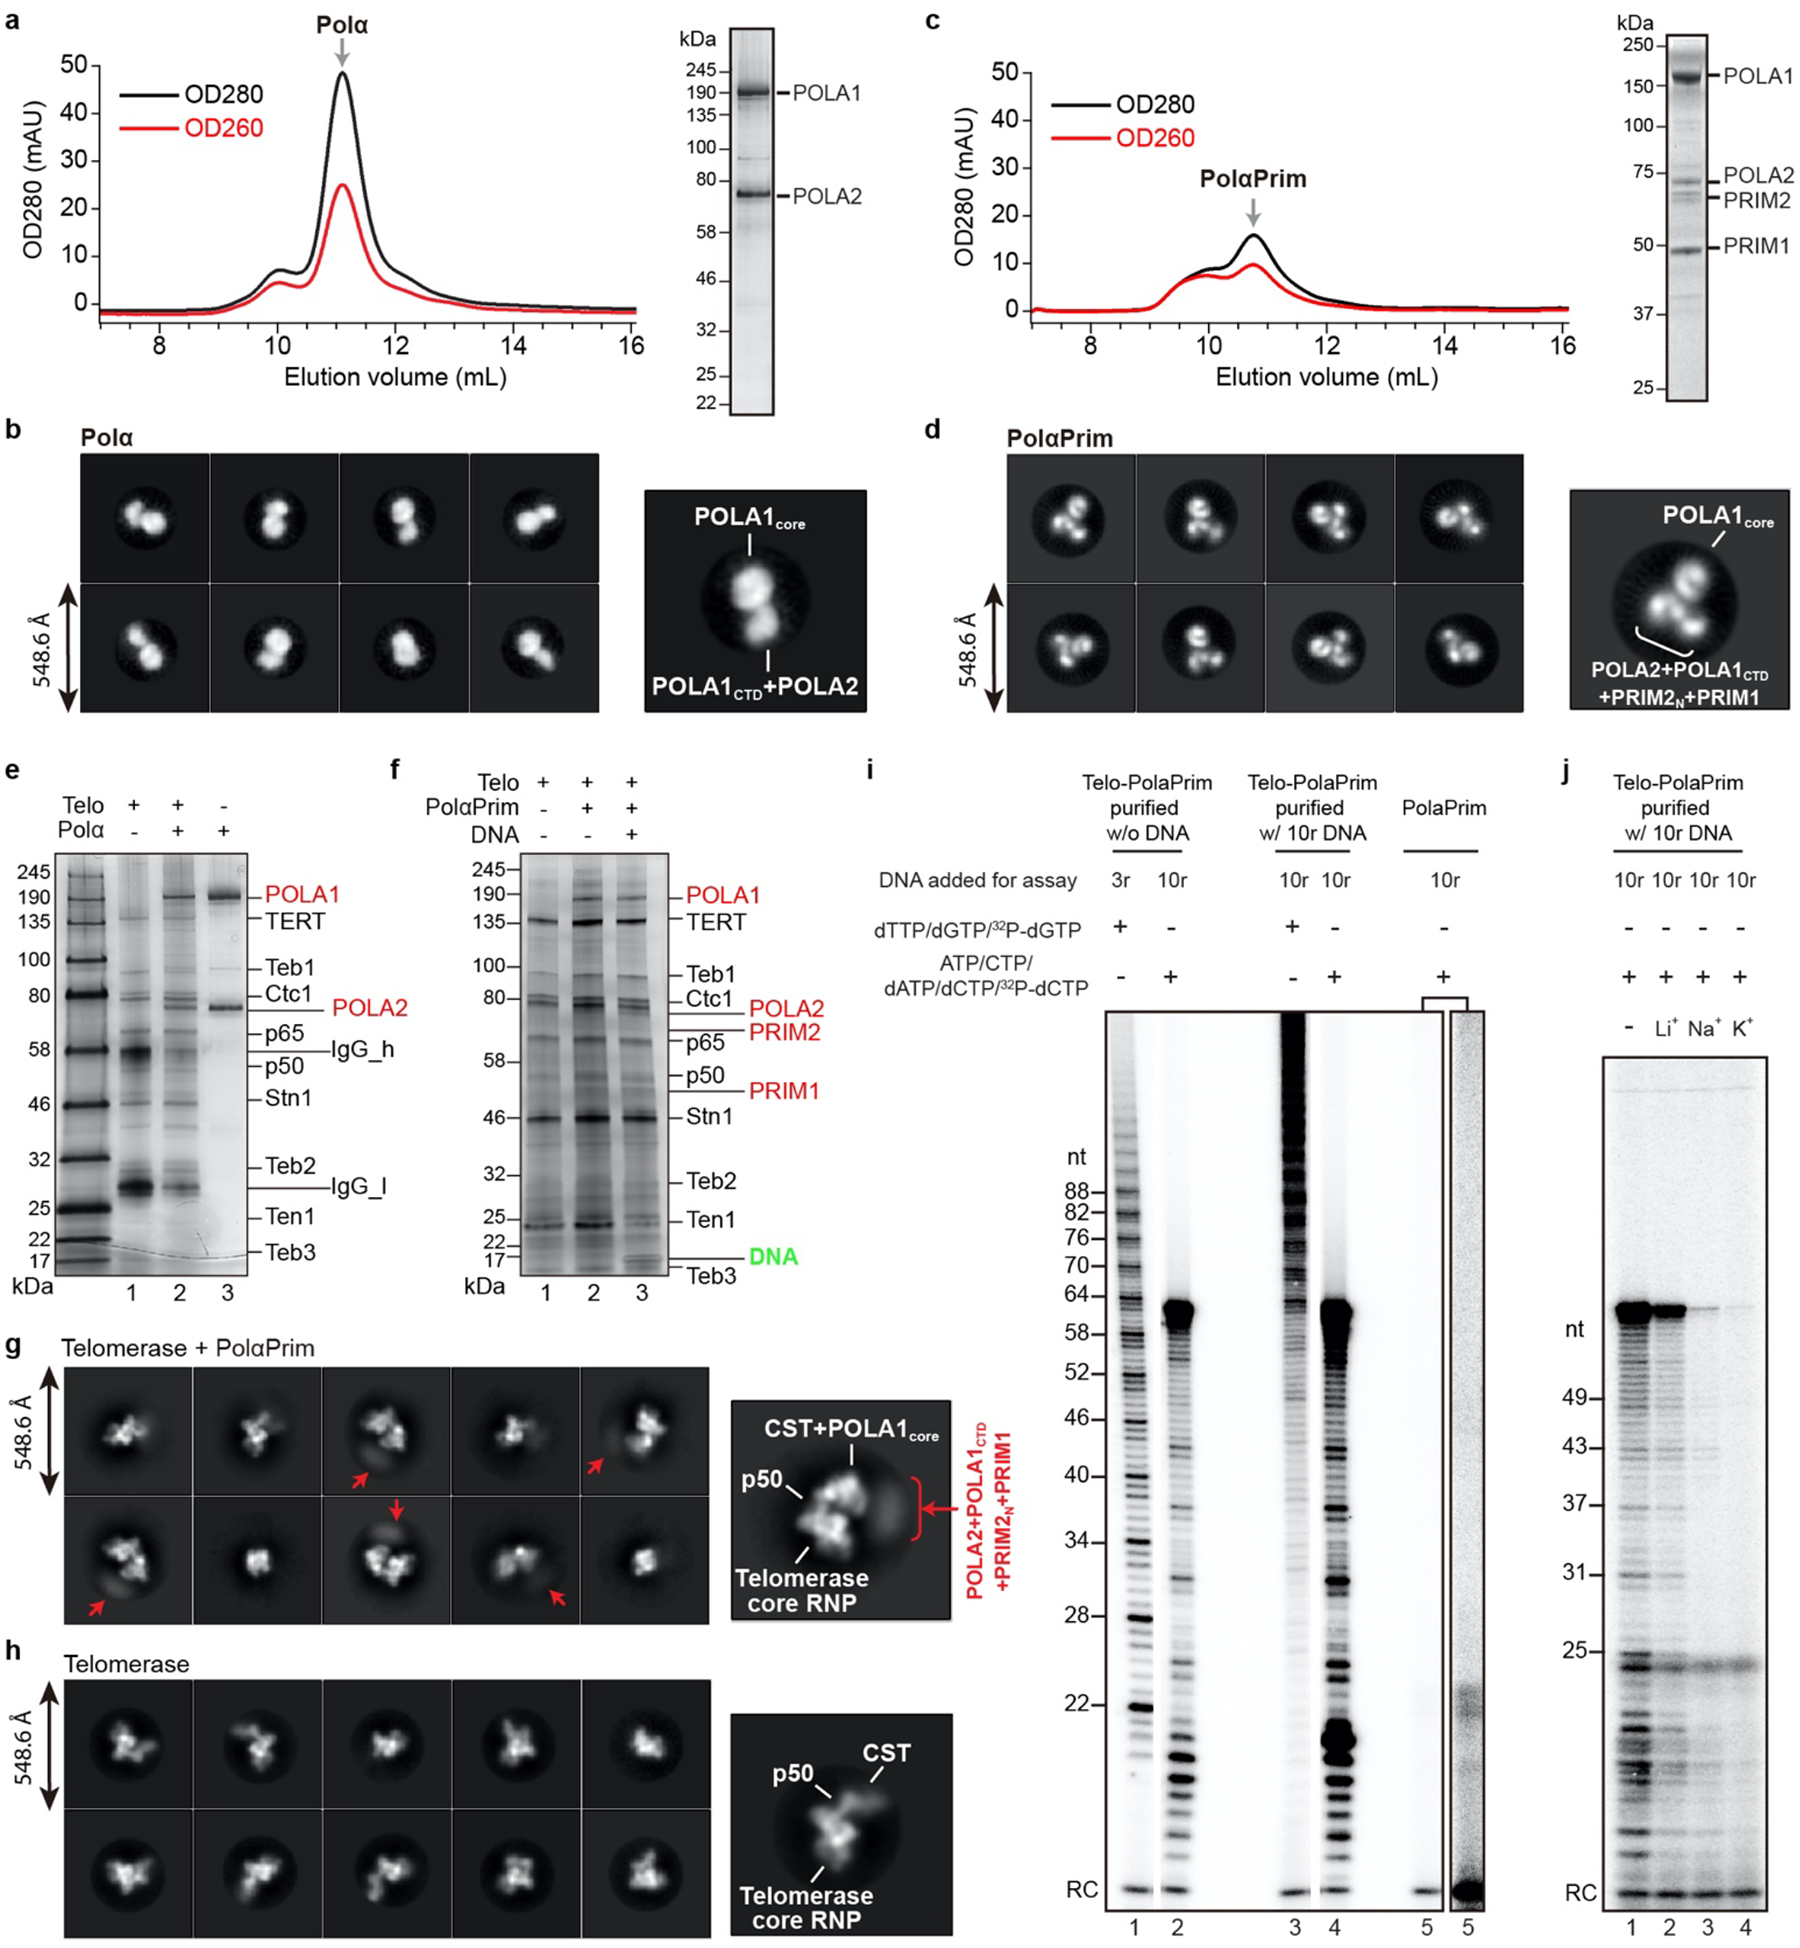
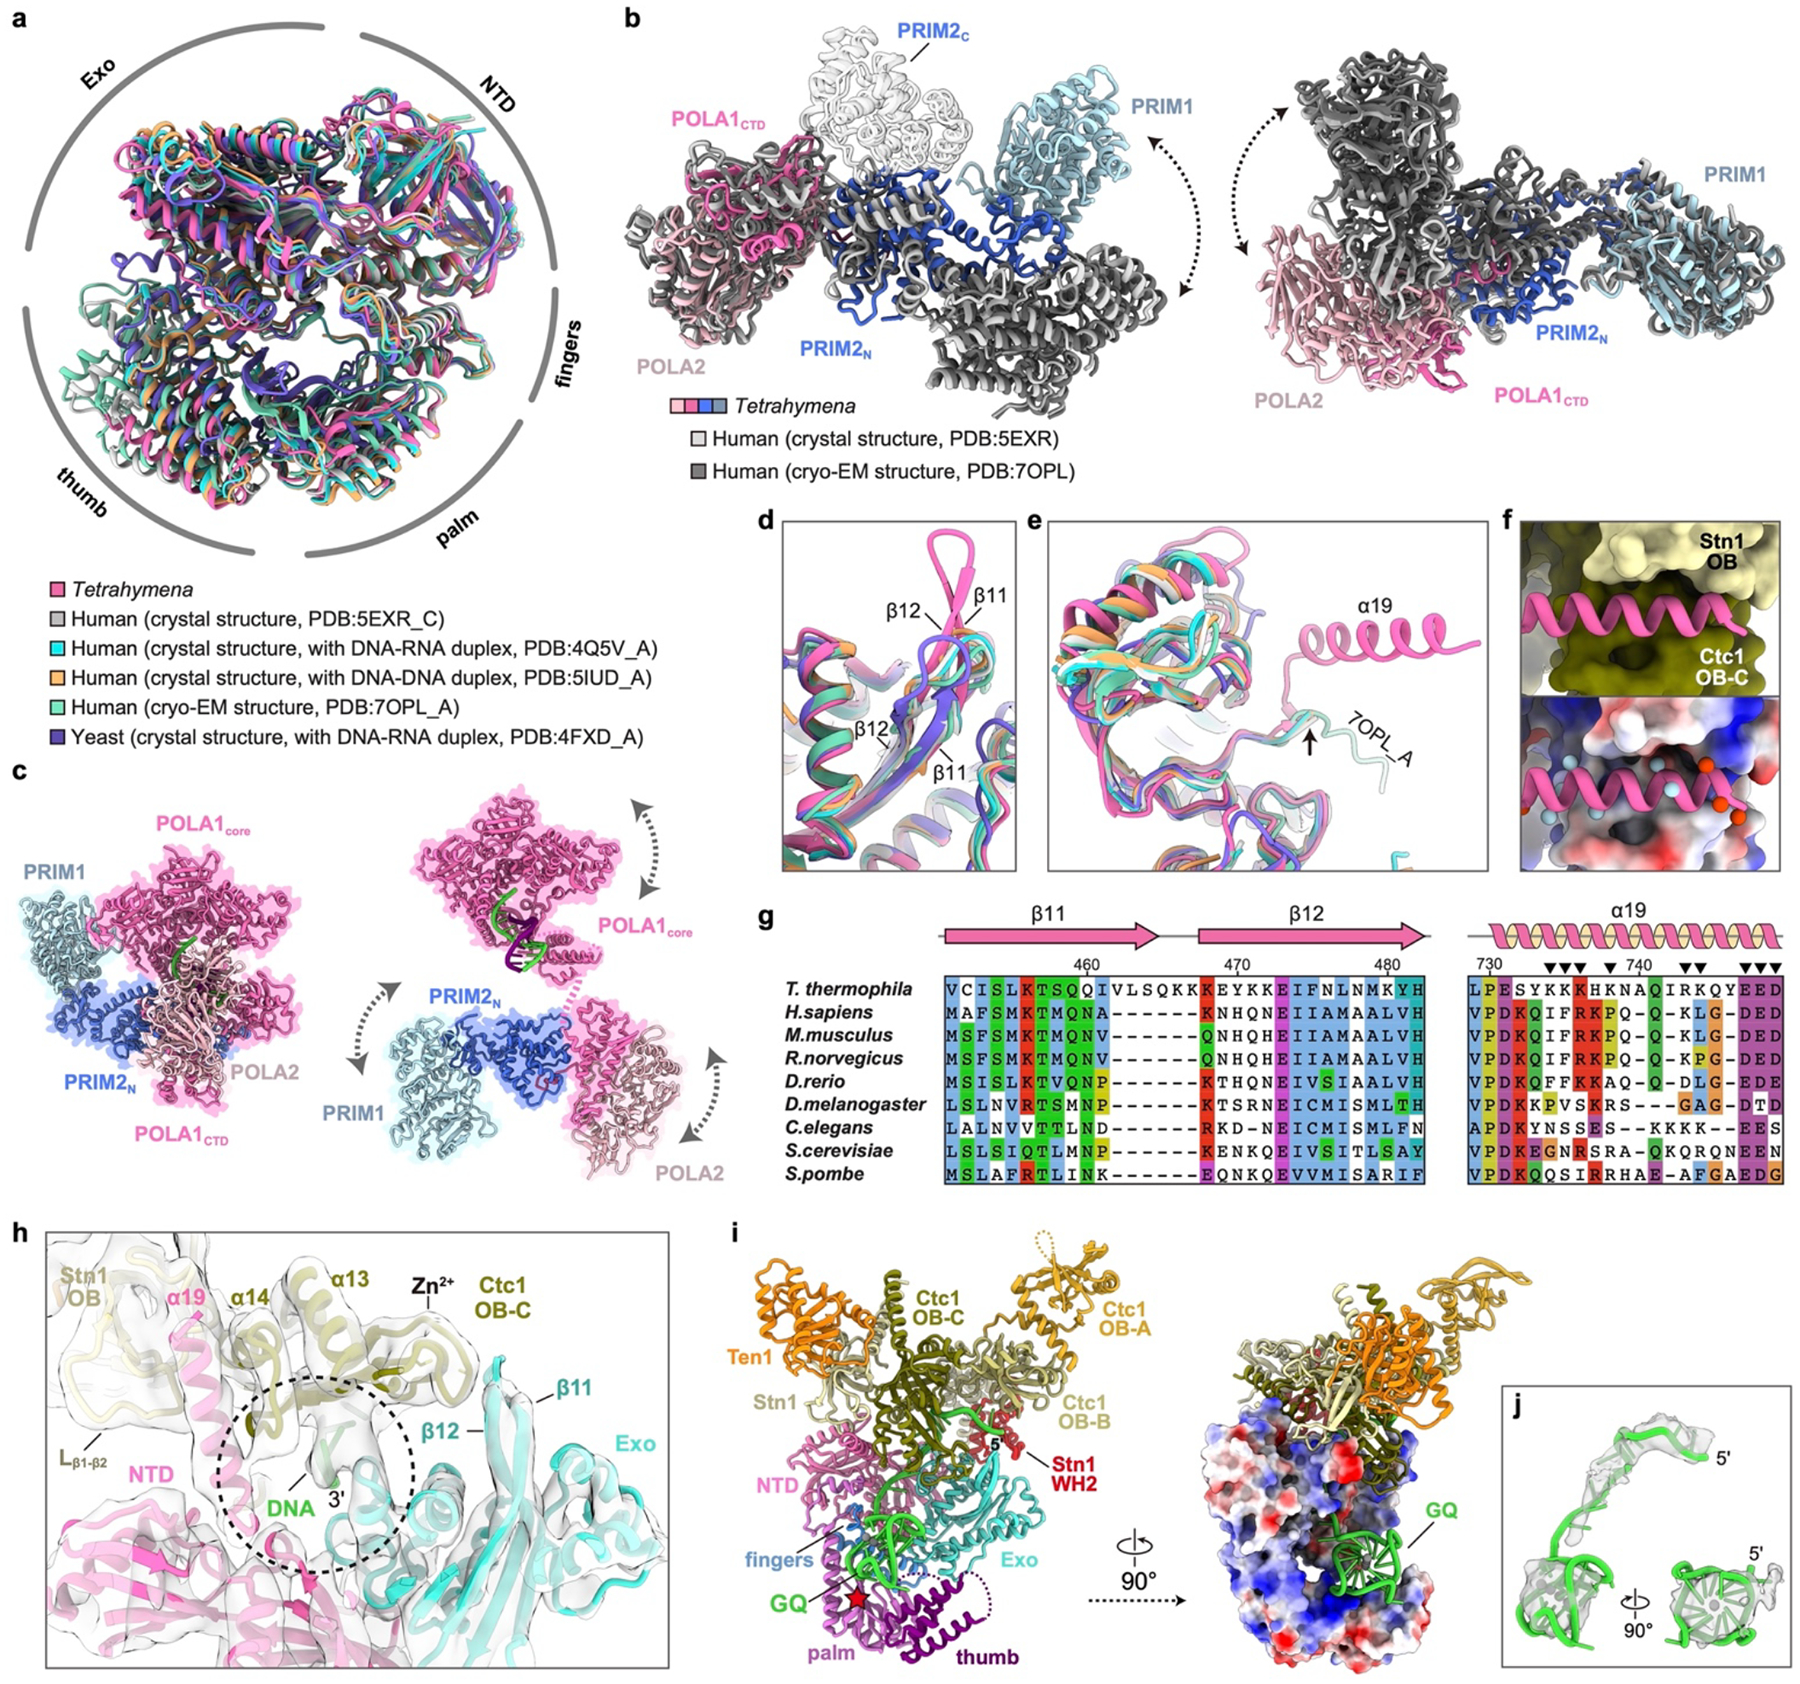
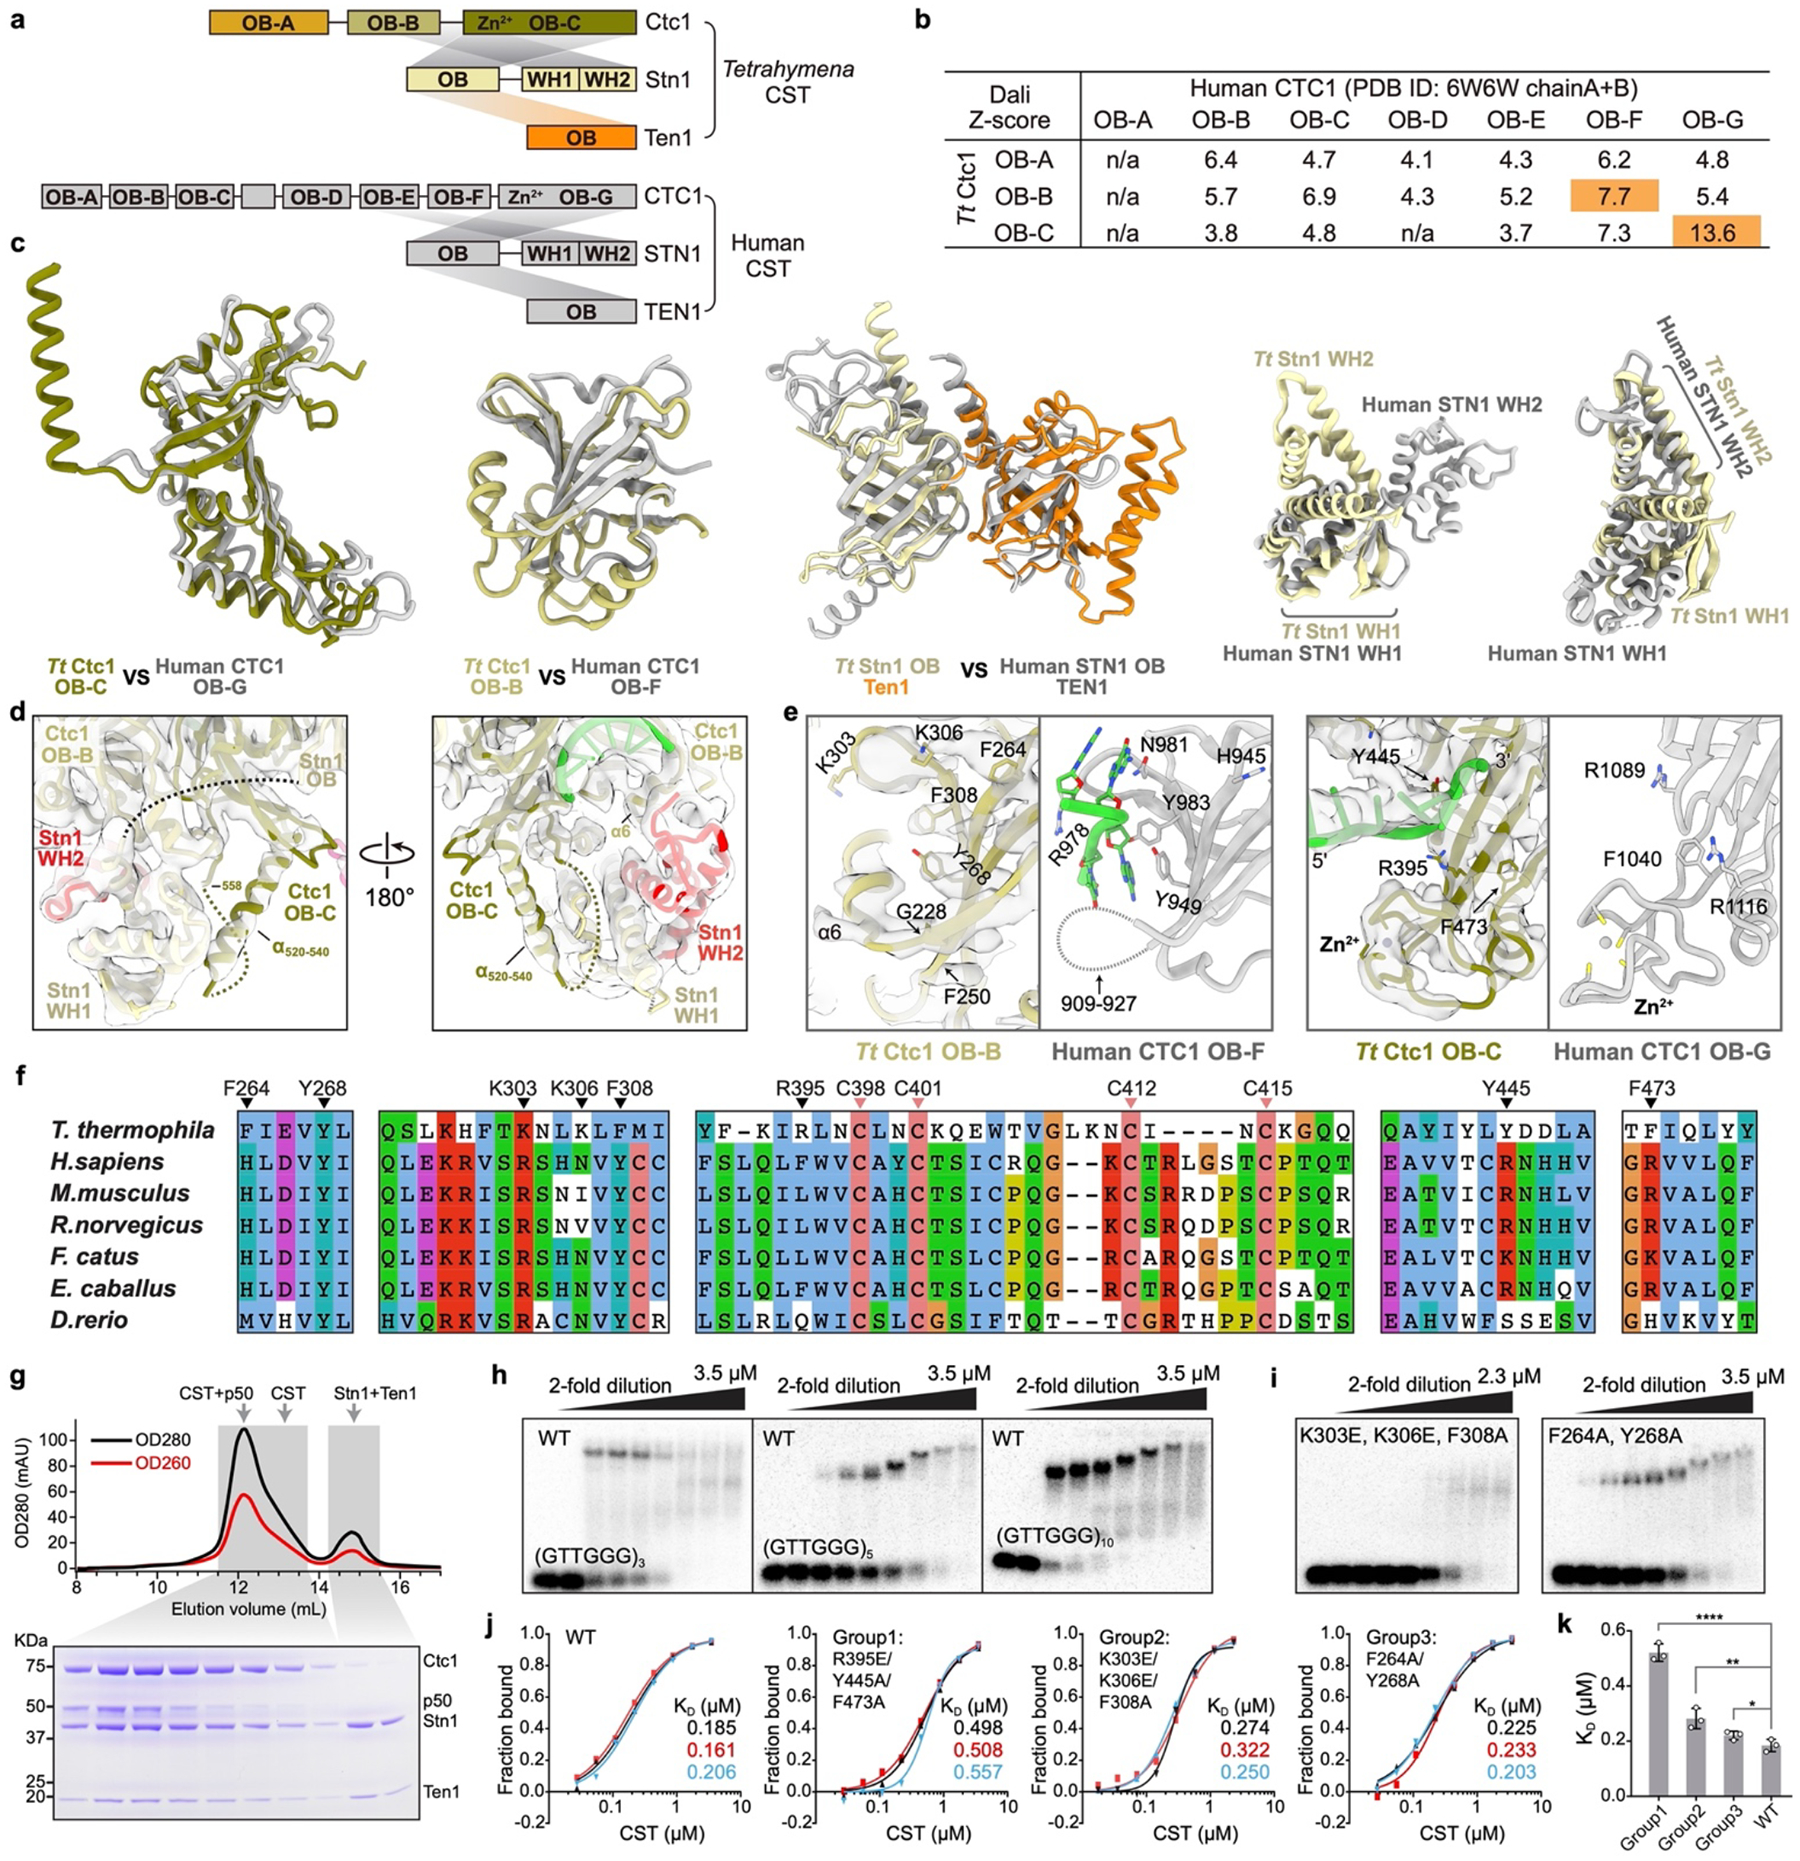
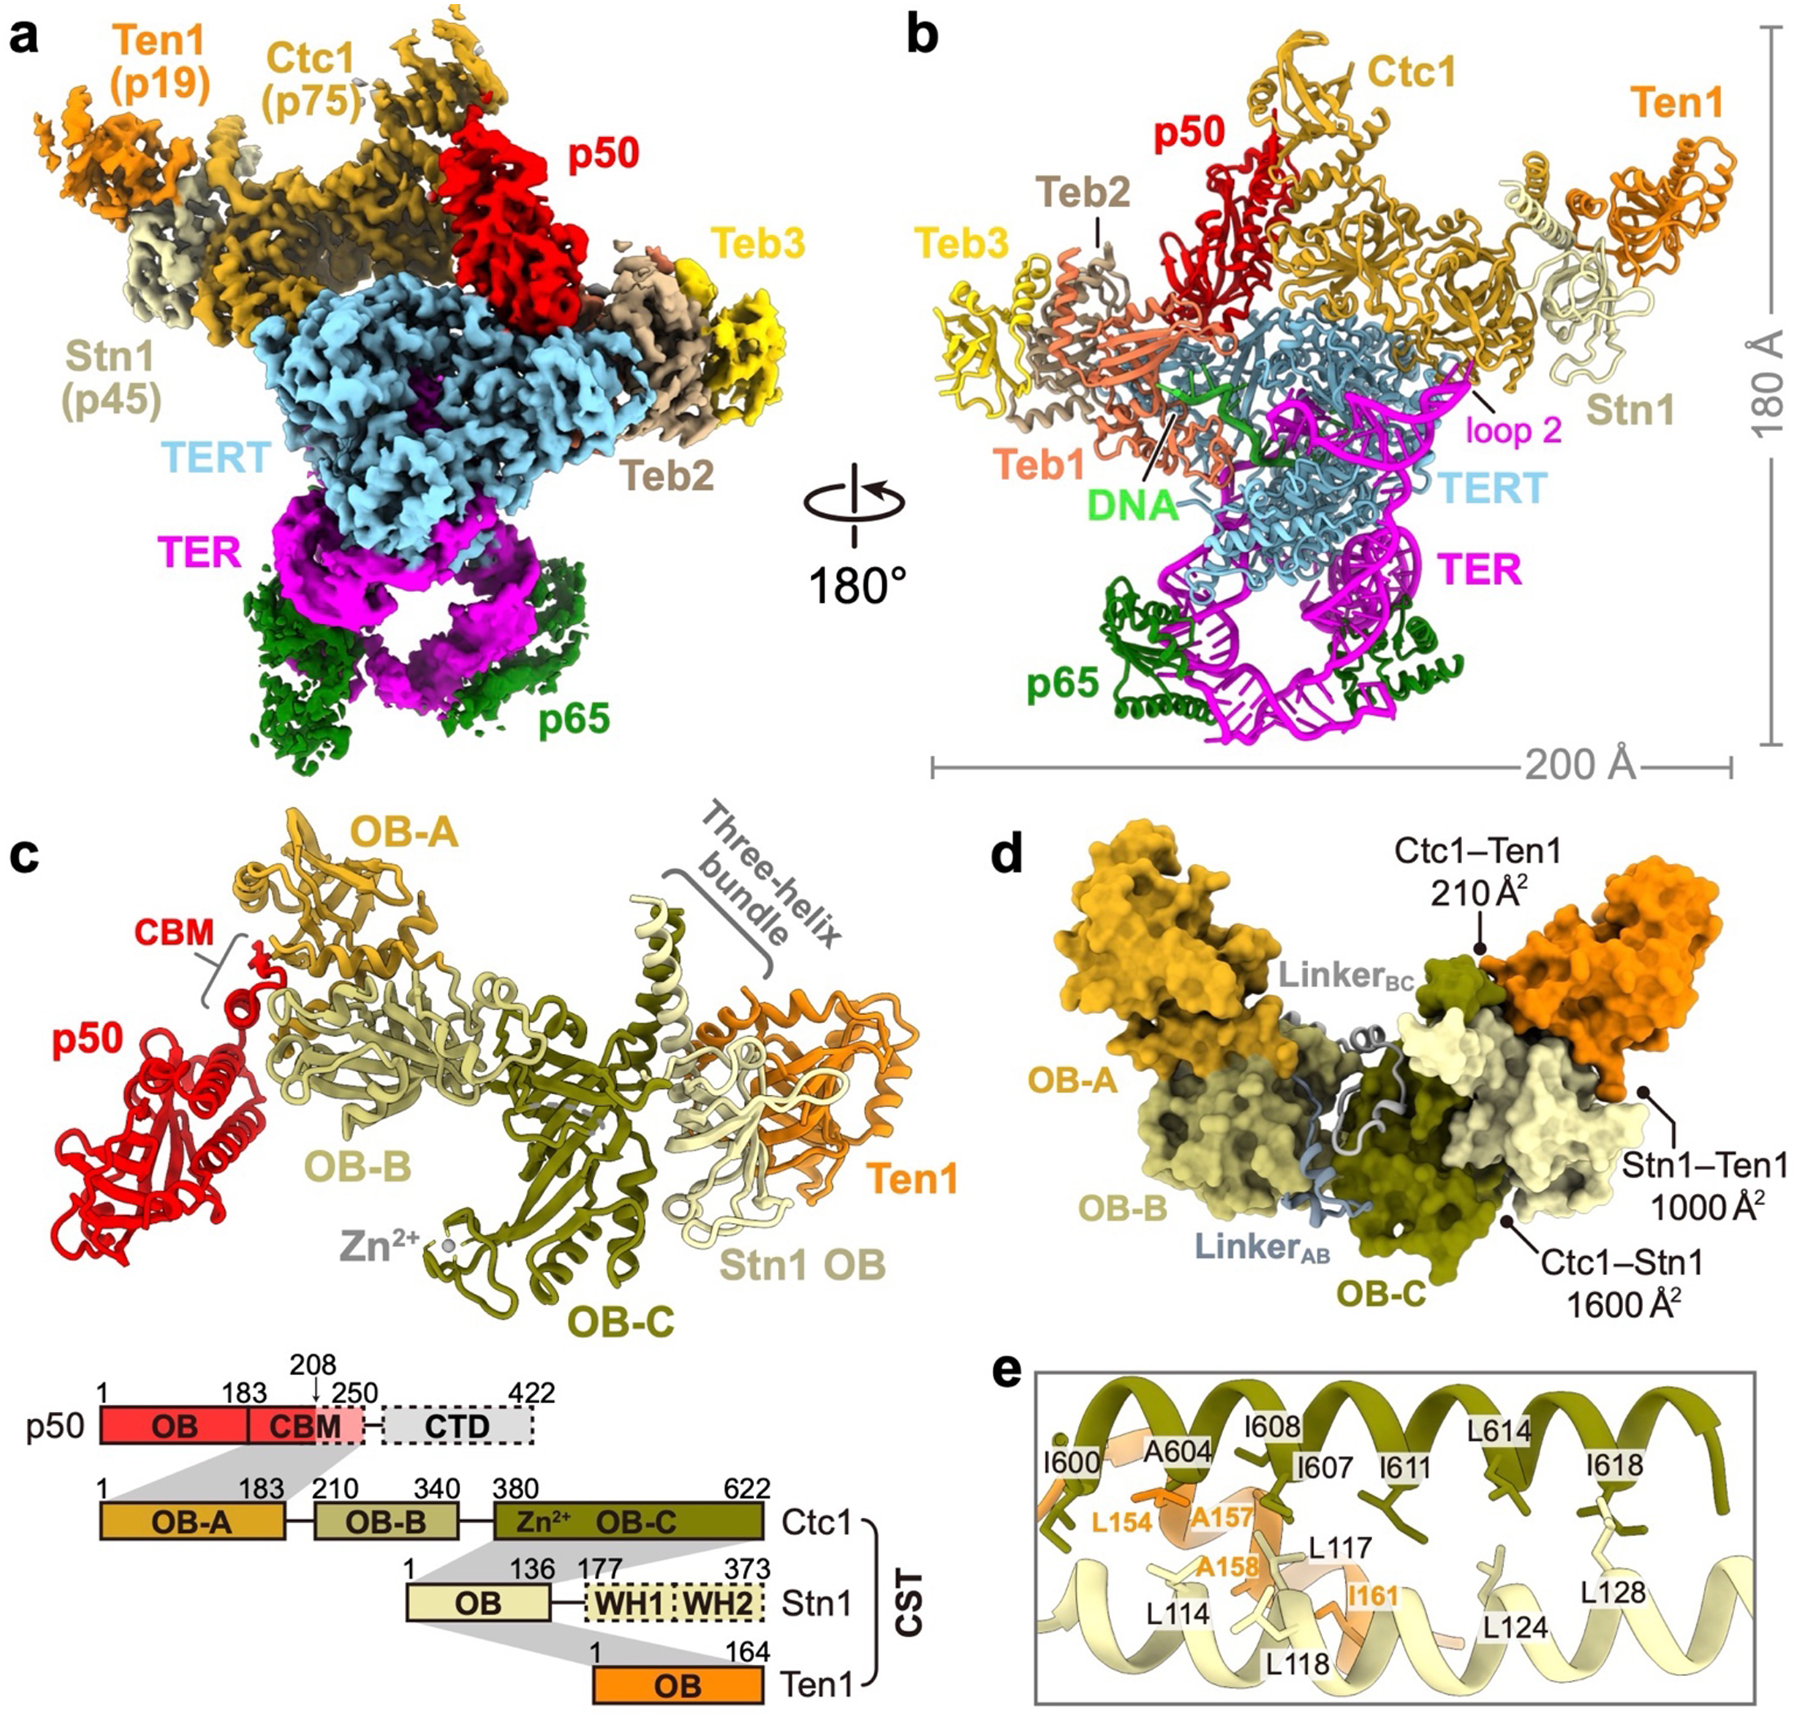
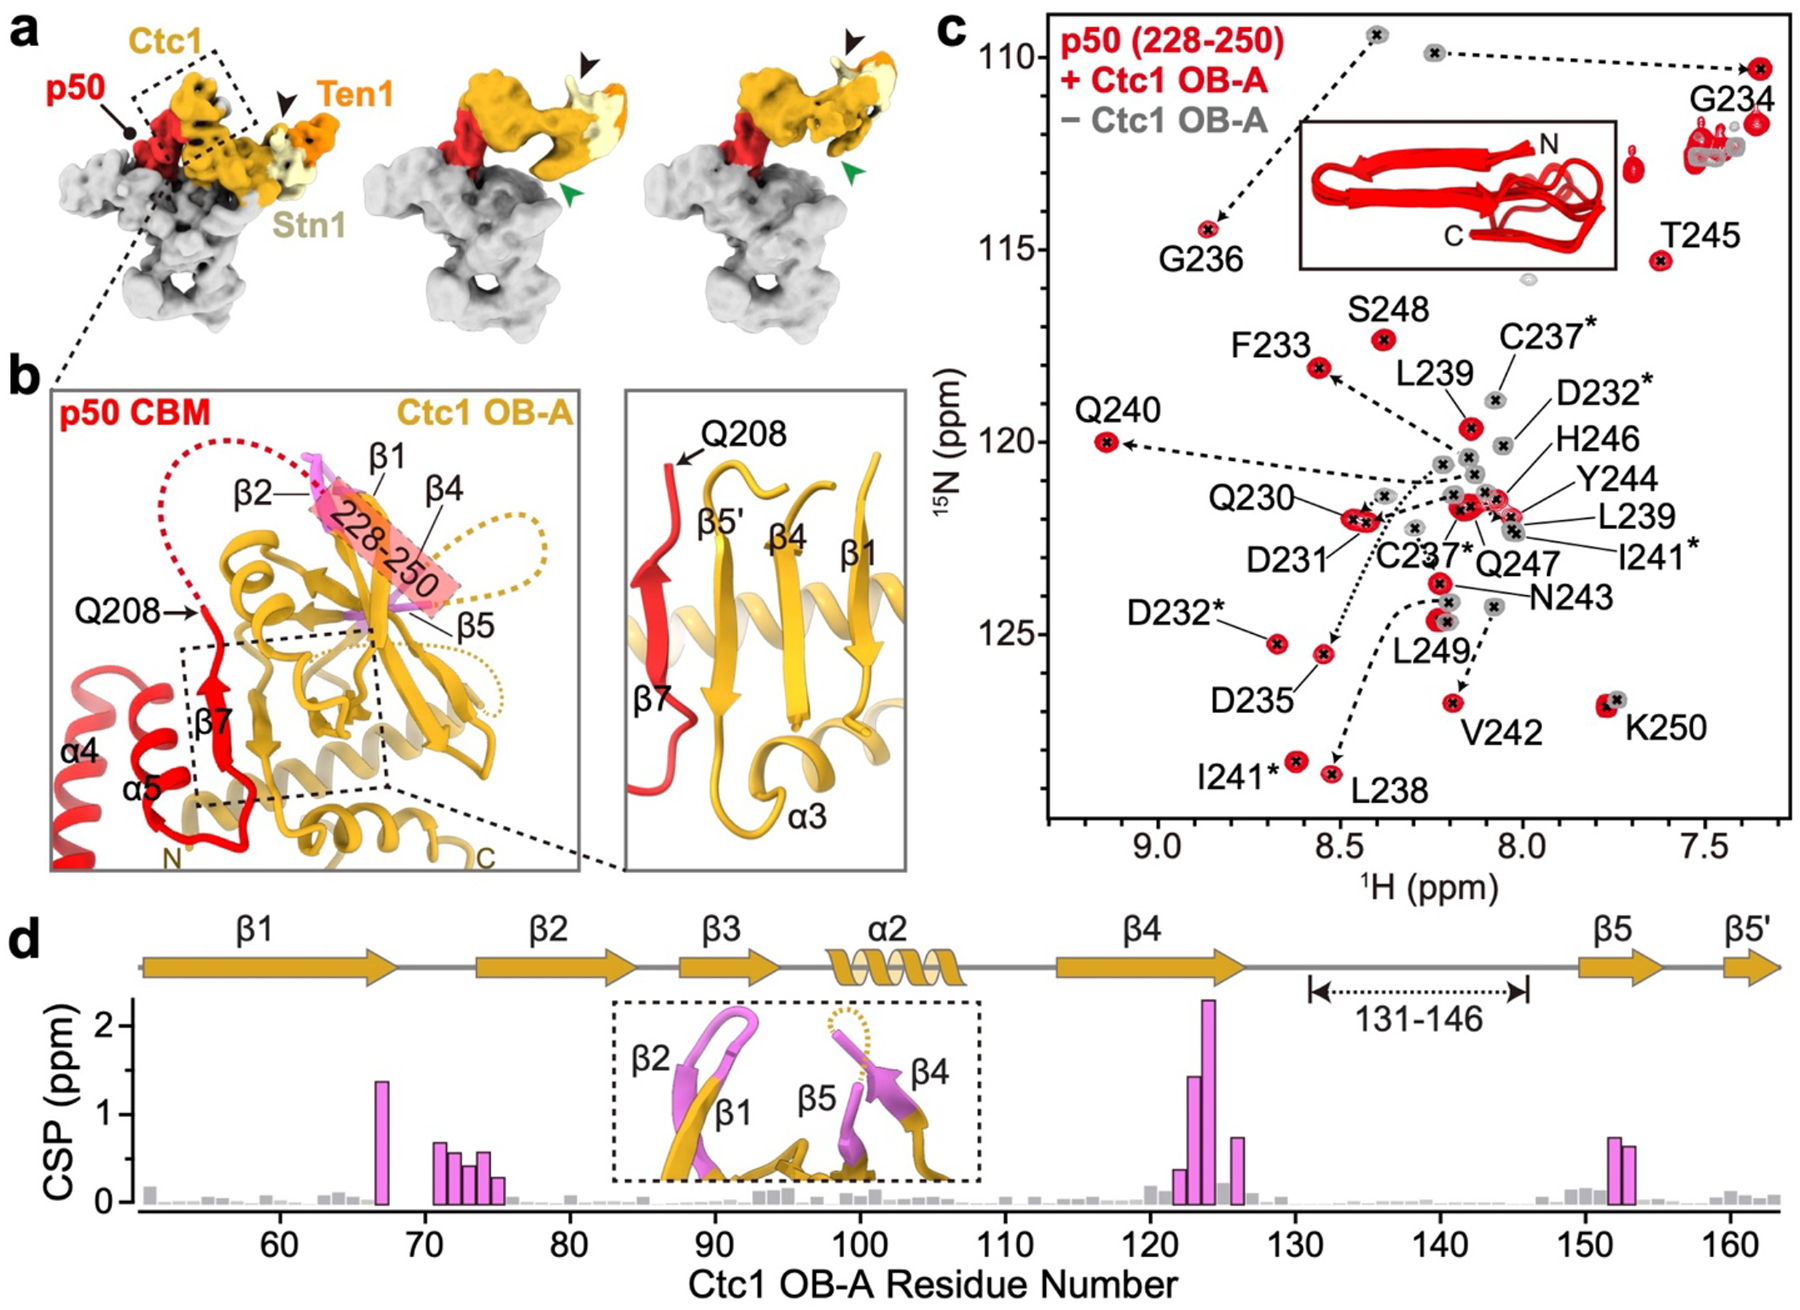
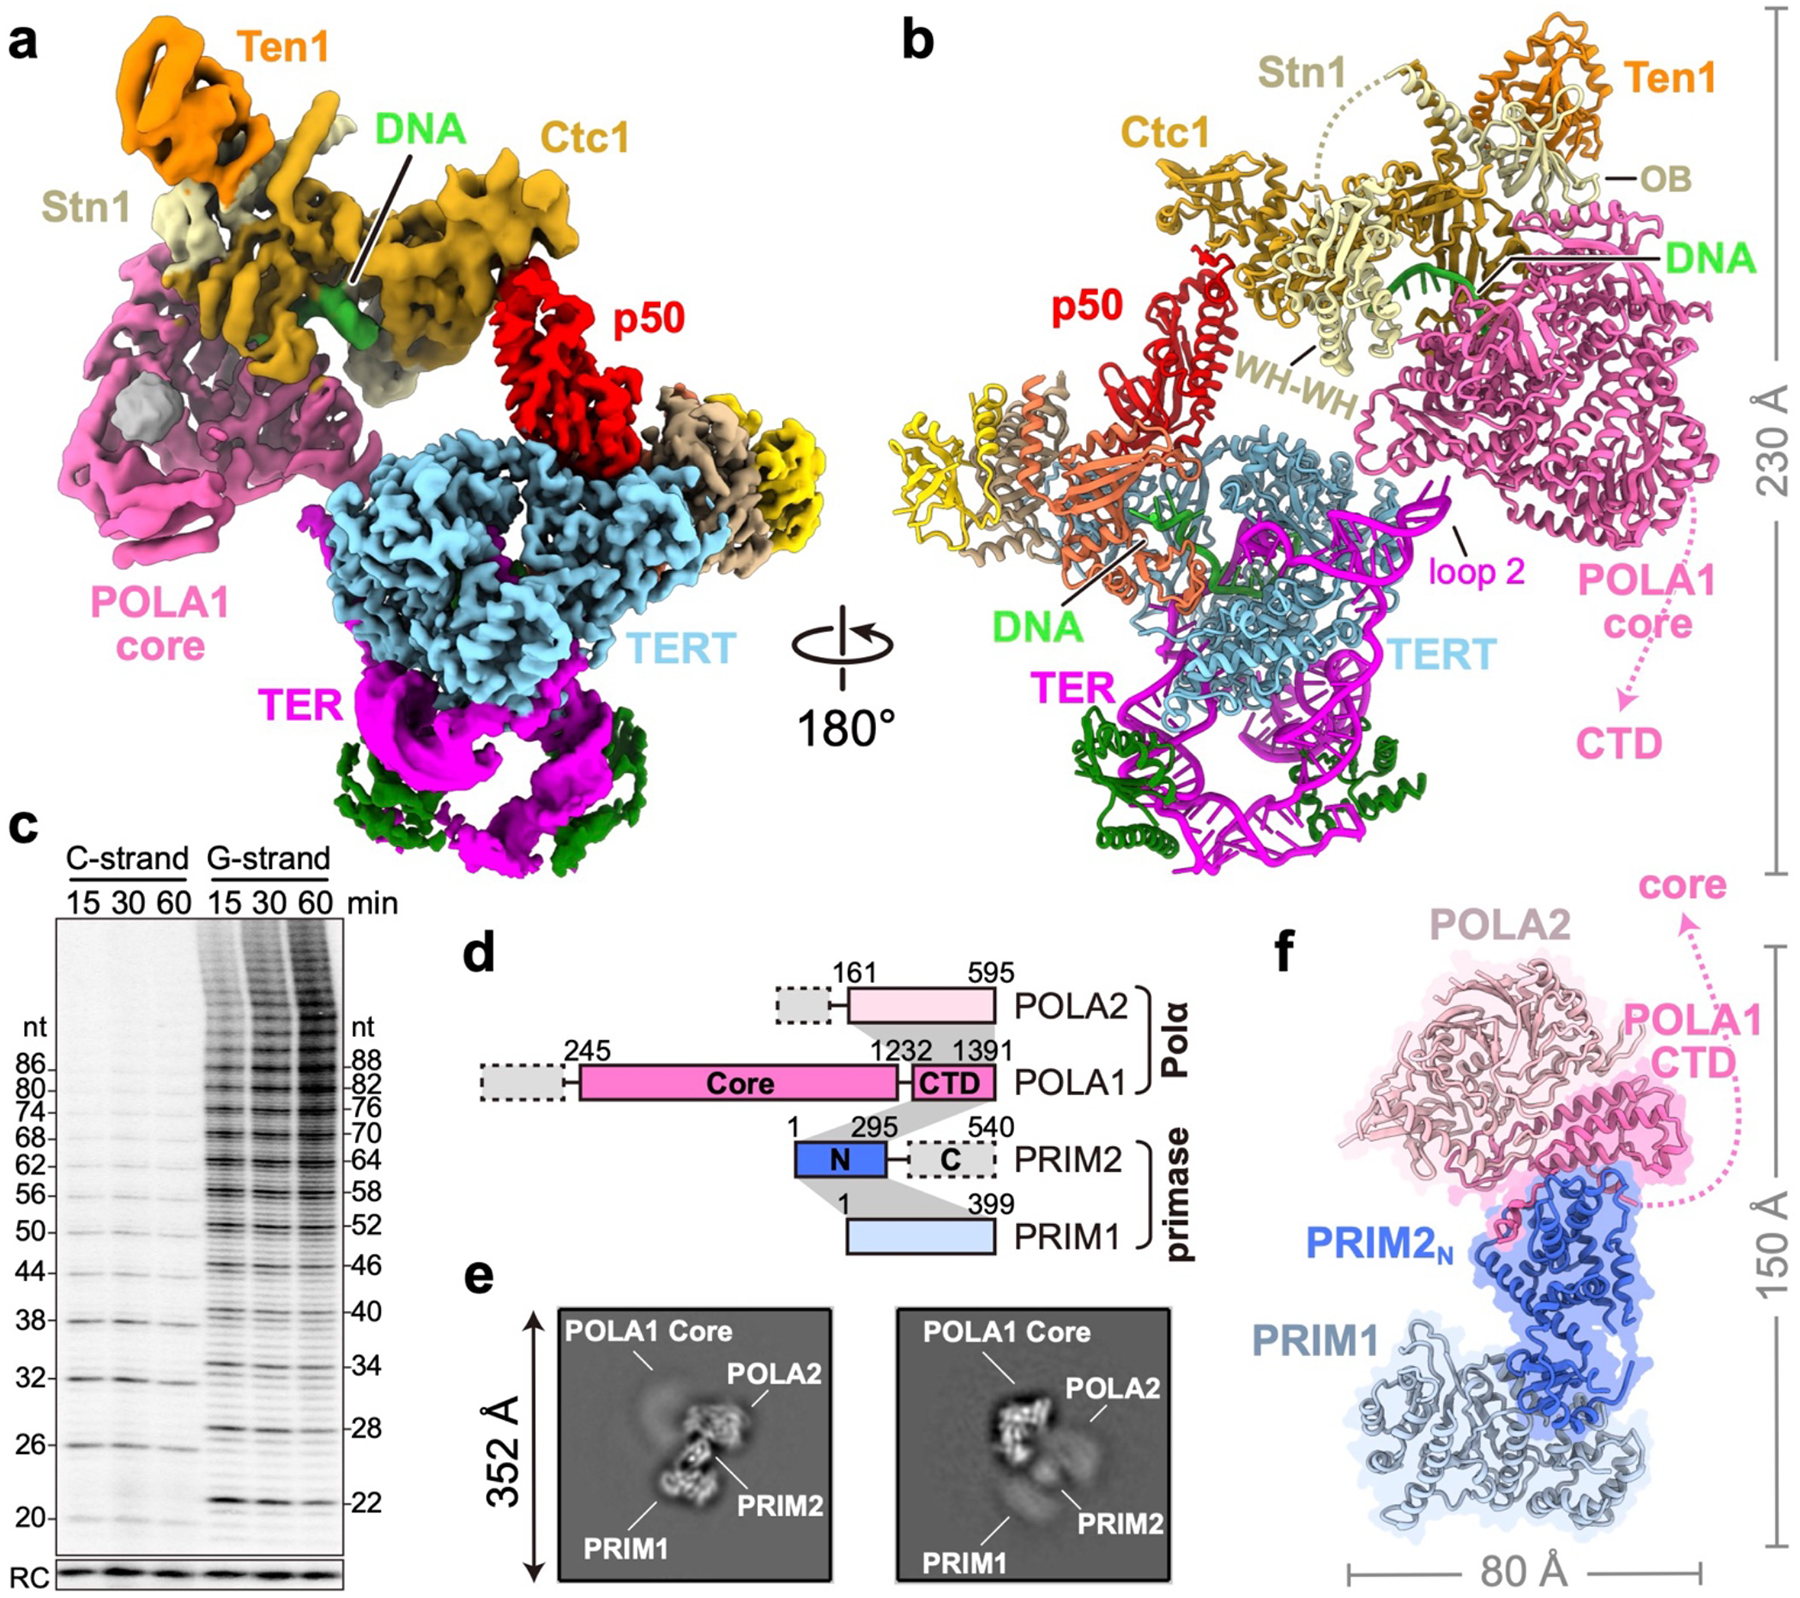
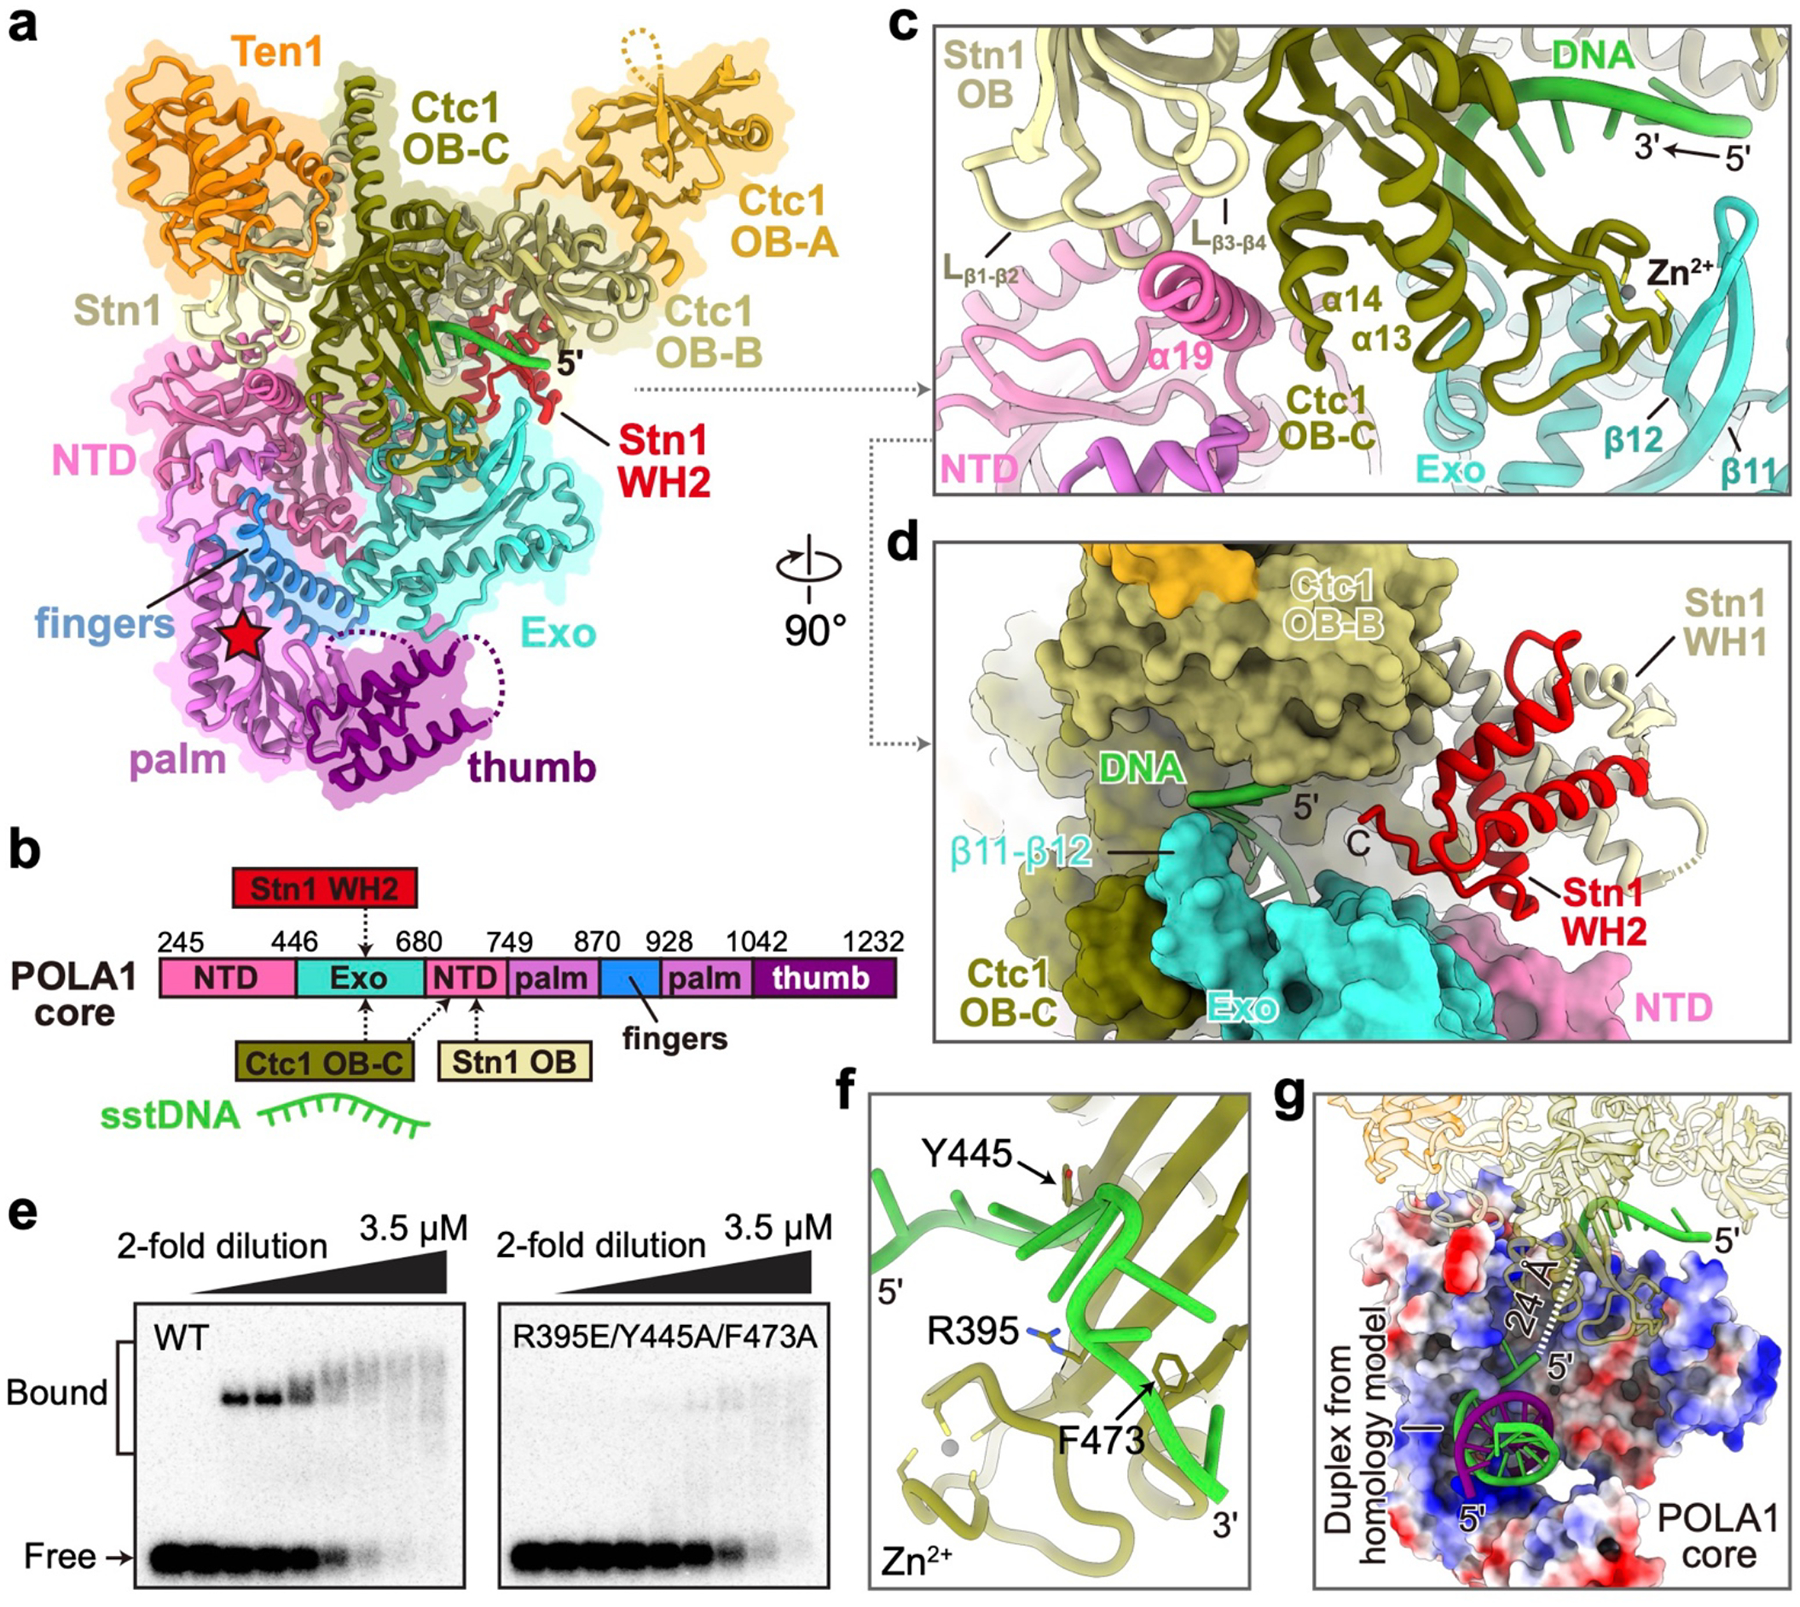
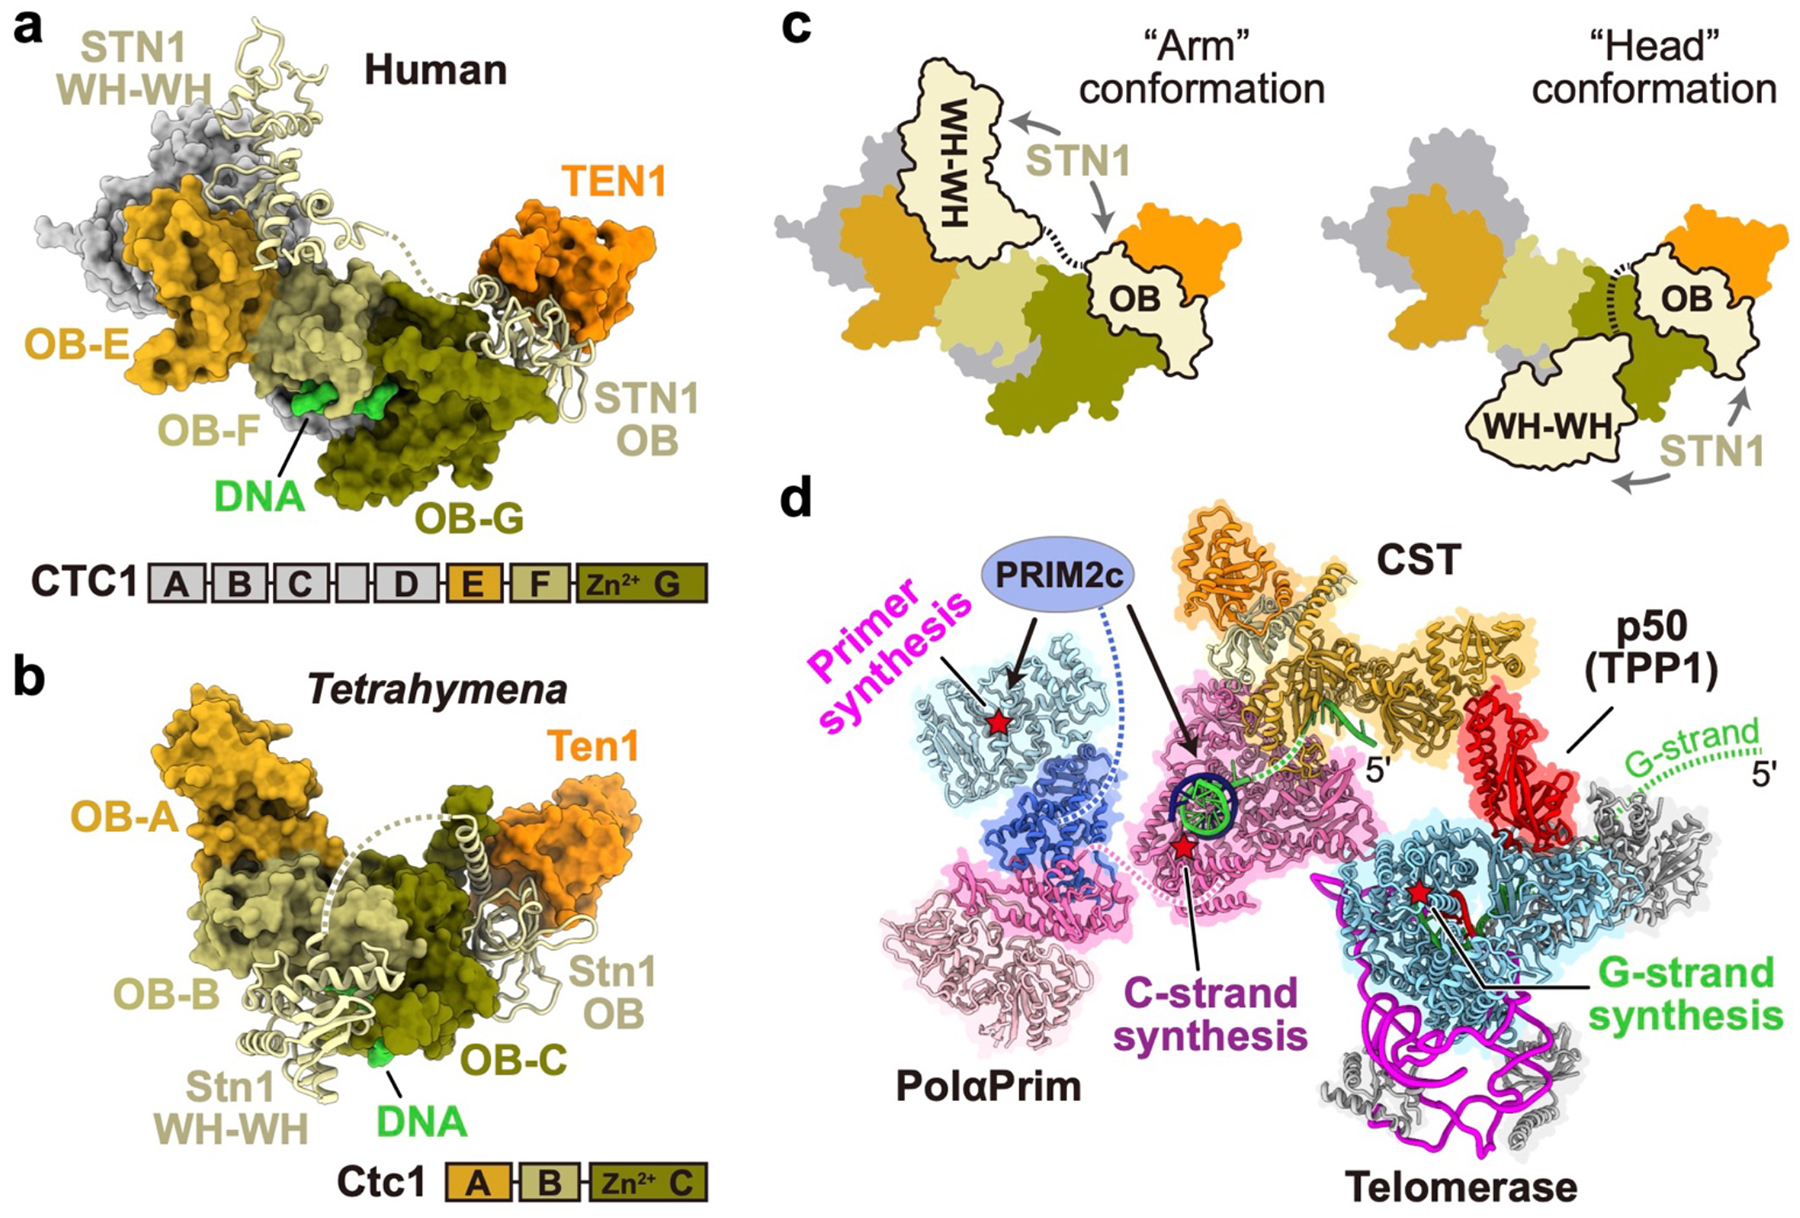
Telomeres are the physical ends of linear chromosomes. They are composed of short repeating sequences (such as TTGGGG in the G-strand for Tetrahymena thermophila) of double-stranded DNA with a single-strand 3' overhang of the G-strand and, in humans, the six shelterin proteins: TPP1, POT1, TRF1, TRF2, RAP1 and TIN21,2. TPP1 and POT1 associate with the 3' overhang, with POT1 binding the G-strand3 and TPP1 (in complex with TIN24) recruiting telomerase via interaction with telomerase reverse transcriptase5 (TERT). The telomere DNA ends are replicated and maintained by telomerase6, for the G-strand, and subsequently DNA polymerase α-primase7,8 (PolαPrim), for the C-strand9. PolαPrim activity is stimulated by the heterotrimeric complex CTC1-STN1-TEN110-12 (CST), but the structural basis of the recruitment of PolαPrim and CST to telomere ends remains unknown. Here we report cryo-electron microscopy (cryo-EM) structures of Tetrahymena CST in the context of the telomerase holoenzyme, in both the absence and the presence of PolαPrim, and of PolαPrim alone. Tetrahymena Ctc1 binds telomerase subunit p50, a TPP1 orthologue, on a flexible Ctc1 binding motif revealed by cryo-EM and NMR spectroscopy. The PolαPrim polymerase subunit POLA1 binds Ctc1 and Stn1, and its interface with Ctc1 forms an entry port for G-strand DNA to the POLA1 active site. We thus provide a snapshot of four key components that are required for telomeric DNA synthesis in a single active complex-telomerase-core ribonucleoprotein, p50, CST and PolαPrim-that provides insights into the recruitment of CST and PolαPrim and the handoff between G-strand and C-strand synthesis.


Conflict of interest statement

Competing interests: Authors declare that they have no competing interests.

Figures

Extended Data Fig. 1:
Extended Data Fig. 1:. Cryo-EM data processing workflow of TtCST in telomerase holoenzyme and evaluations of the final reconstructions.
a, Data processing workflow (detailed in Methods). b, Euler angle distributions of particles used for the final 3.5 Å resolution reconstruction. c, Local resolution evaluation of the 3.5 Å resolution reconstruction shown for overall map (upper) and for the TtCST–p50 region (lower). d, Plot of the Fourier shell correlation (FSC) as a function of the spatial frequency demonstrating the resolutions of final reconstructions. e, 3D FSC analysis of the 3.5 Å resolution reconstruction. Shown are the global FSC (red line), the spread of directional resolution values (area encompassed by the green dotted lines) and the histogram of directional resolutions evenly sampled over the 3D FSC (blue bars). A sphericity (0.5 threshold) of 0.899 indicates almost isotropic angular distribution of resolution (a value of 1 stands for completely isotropic angular distribution). f, FSC coefficient as a function of spatial frequency between model and cryo-EM density map. g, Representative cryo-EM densities (gray and mesh) encasing the related atomic models (colored sticks and ribbons). h, Superimposition of cryo-EM densities (low-pass filtered to 5 Å) and model of Ctc1 OB-A in complex with p50 CBM.
Extended Data Fig. 2:
Extended Data Fig. 2:. Structural details of TtCST.
a, Domain organization of TtCST subunits. Invisible regions in the cryo-EM map are shown as dashed boxes. Intermolecular interactions are indicated as gray shading. b, Ribbon diagrams of TtCST subunits/domains with secondary structure elements labelled. Unmodeled regions are shown as dashed lines. Crystal structure of Ten1–Stn1 OB (PDB 5DOI) is shown in gray and overlayed with the cryo-EM structure for comparison. c, Ribbon representation of TtCST structure with individual OB domain colored as indicated. d, Zoom-in view of the interface between Ctc1 OB-C and Stn1 OB. Salt bridge and hydrogen-bonding interactions are shown as dashed yellow lines. e, Two arginine sidechains on Stn1 OB (ribbon) clamp D499 on Ctc1 OB-C (electrostatic surface). f, g, Detailed interactions between Stn1 OB and Ten1. h, Close-up views of the cryo-EM densities of the interfaces between CST subunits (Fig. 1e, Extended Data Fig. 2d–g). i, Overall view of the interface between TtCST and TERT–TER. j-l, Zoom-in views of interactions between TtCST and TERT–TER as indicated in dashed boxes in h. These interactions stabilize TtCST in the predominant conformation.
Extended Data Fig. 3:
Extended Data Fig. 3:. NMR spectra and structural study of Ctc1 OB-A with p50 peptide.
a, Assigned 1H-15N HSQC spectrum of 15N-labelled Ctc1 OB-A (residues 1–183) in the presence of unlabeled p50 peptide (residues 228–250). Inset shows the expanded central region of the spectrum. b, Superimposed 1H-15N HSQC spectra of 15N-labelled Ctc1 OB-A in the presence (yellow) and absence (gray) of unlabeled p50 peptide. Signals from the same residues with chemical shift differences of >0.25 ppm are connected by dashed arrows. Signals from residues 68–70 that only appear in the presence of p50 peptide are labeled with asterisks. c, Chemical shift perturbation (CSP) index of 15N-labelled Ctc1 OB-A upon binding p50 peptide. Magenta box indicates the region that is shown in Fig. 2d. d, Chemical-shift-based secondary structure score of Ctc1 OB-A in the absence (gray) and presence (yellow) of p50 peptide. The scores are determined using TALOS+ (ref). Top and bottom edges of each bar represent the probabilities of each residue assigned to be α helix and β sheet, respectively. The secondary structure of Ctc1 OB-A observed in the cryo-EM structure is shown below for comparison. e, Plot of long range (greater than 5 residues) 1H-1H NOE restraints observed within Ctc1 OB-A. Residues with pairwise NOE restraint(s) are connected by a link. Links are color coded as indicated based on the number of NOE restraints between the two connected residues.
Extended Data Fig. 4:
Extended Data Fig. 4:. Identifying the “invisible” interface between Ctc1 OB-A and p50 peptide using NMR methods.
a, Schematic diagram of p50 and constructs of p50 peptide. The N-terminal 30 kDa and 25 kDa fragments of p50 are labeled as p50N30 and p50N25, respectively. Previous biochemical study showed that p50N30 could bind Ctc1, whereas p50N25 could not. The cryo-EM structure of p50 ends at residue 208 (Fig. 2b). Based on these facts, a series of p50 peptides in the range of residues 213–255 were designed to explore additional interface between p50 and Ctc1 OB-A that are “invisible” in the cryo-EM structure. b, NMR binding study of p50 peptides with Ctc1 OB-A. Two regions of 1H-15N HSQC spectra of 15N-labelled Ctc1 OB-A in the absence (apo) and presence of unlabeled p50 peptides were shown. Chemical shifts of T71 and A73 were chosen to illustrate the binding process in this and the following panels c and d. p50228–250 peptide is determined to be the optimal construct and was used for other NMR studies presented in this paper. c, Titration series of p50 peptide into 15N-labelled Ctc1 OB-A. The binding is in the slow exchange regime and saturated at 1:1 stoichiometry. d, Truncations of two unstructured loops (residues 38–49 and 131–146) of Ctc1 OB-A individually have no effect on its binding with p50 peptide. e, Secondary structure score of p50228–250 in the presence of Ctc1 OB-A. f, CSP index of p50 peptide upon binding Ctc1 OB-A. 1H-15N HSQC spectra shown in Fig. 2c were used for the CSP calculation. g, Model of the interactions between Ctc1 OB-A and p50. CS-Rosetta models of p50228–250 are shown in gray box with arrows pointing to the binding surface on Ctc1 OB-A. Unstructured linkers are shown as dashed lines.
Extended Data Fig. 5:
Extended Data Fig. 5:. Characterization of purified Tetrahymena PolαPrim samples and their assembly with telomerase holoenzyme.
a, Size-exclusion chromatography (SEC) profile (left) and SDS-PAGE gel (right) of Polα. b, Representative 2D-class averages of Polα particles obtained from negative-stain EM images. c, SEC profile (left) and SDS-PAGE gel (right) of PolαPrim. d, Representative 2D-class averages of PolαPrim particles obtained from negative-stain EM images. e, Silver-stained SDS-PAGE gel of affinity purified telomerase–Polα (lane 2) shows that Polα can bind telomerase in the absence of Primase. Telomerase (lane 1) and Polα (lane 3) samples were loaded on the same gel for comparison. f, Silver-stained SDS-PAGE gel of affinity purified telomerase–PolαPrim samples shows assembly of the complex with or without sstDNA. g, Representative 2D-class averages of affinity purified telomerase–PolαPrim obtained from negative-stain EM images. Densities are assigned based on the cryo-EM structure (Fig. 3a) obtained with the same batch of sample. Smeared densities (red arrows) are observed near POLA1core in several classes, so we were able to assign them to the PolαPrim platform, which comprises POLA2, POLA1CTD, PRIM2N, and PRIM1. h, Representative 2D-class averages of telomerase particles shown for comparison with g. i, Activity assays of telomerase-PolαPrim (lanes 1–4) and PolαPrim alone (lane 5). Direct telomerase activity assays were conducted for G-strand synthesis alone in the presence of dTTP and dGTP (lanes 1 and 3). PolαPrim activity assays were conducted for C-strand synthesis alone in the presence of ATP, CTP, dATP and dCTP (lanes 2, 4 and 5). 32P-dGTP and 32P-dCTP were used to label the G-strand and C-strand products, respectively. A longer exposure is shown for lane 5 so that products can be seen. RC, recovery control. All lanes are from a single gel. j, Activity assays of C-strand synthesis (lane 1) relative to that in 50 mM LiCl (lane 2), 50 mM NaCl (lane 3), or 50 mM KCl (lane 4). For lanes 2–4, the DNA templates were incubated in assay buffer containing 50 mM of the indicated cations on ice for 30 min before the reaction.
Extended Data Fig. 6:
Extended Data Fig. 6:. Cryo-EM structure determination of Tetrahymena telomerase–PolαPrim complex.
a, Data processing workflow (detailed in Methods). b, Resolution of final reconstructions determined by gold-standard FSC at the 0.143 criterion. c, Particle distribution (upper) and local resolution evaluation (lower) of the 2.9 Å resolution reconstruction of telomerase core. d, Particle distribution (upper) and local resolution evaluation (lower) of the 4.2 Å resolution reconstruction of TtCST–POLA1core. e, 3D FSC analysis of the 2.9 Å resolution reconstruction of telomerase core (left) and the 4.2 Å resolution reconstruction of TtCST–POLA1core (right). For each reconstruction, the global FSC (red line), the spread of directional resolution values (area encompassed by the green dotted lines) and the histogram of directional resolutions evenly sampled over the 3D FSC (blue bars) are shown. A sphericity of 0.958 was determined for telomerase core (left), indicating almost isotropic angular distribution of resolution. A sphericity of 0.736 was determined for TtCST-POLA1core (right), suggesting slightly anisotropic angular distribution of resolution. f, FSC curves for refined models versus the corresponding cryo-EM density maps. g-j, Representative cryo-EM densities (transparency surface) encasing the related atomic models (color sticks and ribbons) for telomerase RNP core (g), CST (h), Stn1 WH-WH (i) and POLA1core (j).
Extended Data Fig. 7:
Extended Data Fig. 7:. Cryo-EM structure determination of PolαPrim.
a, Data processing workflow (detailed in Methods). b, Representative 2D-class averages of PolαPrim particles obtained from cryo-EM images. The two classes shown in Fig. 3e are labeled with red boxes. c, Resolution of final reconstructions determined by gold-standard FSC at the 0.143 criterion. d, Euler angle distributions of particles used for the final reconstructions. e, Local resolution evaluations of the final reconstructions. f, FSC coefficients as a function of spatial frequency between model and cryo-EM density maps. The composite map is generated using Phenix with two focused refined maps (detailed in Methods). For the full map and the composite map, the complete model was used to calculate the FSCs. For the two focused refined maps, only corresponding regions of the model were used to calculate the FSCs. g, Representative cryo-EM densities (gray mesh) encasing the related atomic models (colored sticks and ribbons).
Extended Data Fig. 8:
Extended Data Fig. 8:. Structural conservation of Tetrahymena PolαPrim.
a, Superposition of Tetrahymena (Tt), human and yeast POLA1core structures–,, shown in an overall view. b, Structural comparison of PolαPrim platform of Tt and human,. The structures were superposed based on POLA2–POLA1CTD (left) or PRIM1 (right). Arrows indicate dynamics of the unaligned regions. PRIM2C in human structures are shown as transparent ribbons. PRIM2C is not observed in the Tt structure. c, Structures of PolαPrim in an autoinhibited conformation (left, modeled based on PDB 5EXR) and an active conformation (right, modeled based on a low-resolution cryo-EM map in Extended Data Fig. 7a). The DNA-DNA duplexes on POLA1core were modeled based on PDB 5IUD. In the autoinhibited conformation (left), the active site on POLA1core is sterically blocked by POLA1CTD and POLA2 for DNA entry. In the active conformation (right), dynamics of subunits are indicated with arrows. d-e, Superposition of Tt, human and yeast POLA1core structures for the regions that are on the interface with TtCST. Conserved domains/motifs are labeled as indicated. The β11-β12 hairpin in Tt POLA1core is longer than those in human and yeast (d). The α19 is structured only in Tt POLA1 when binding TtCST (e). f, Zoom-in views of the interface between Tt POLA1core α19 (ribbon) and TtCST (surface/electrostatic surface). In the lower panel, locations of positively and negatively charged residues on α19 are indicated using blue and red balls, respectively. g, Sequence conservation analysis of the β11-β12 hairpin and α19 of POLA1. Charged residues on α19 are indicated with black arrows. h, Zoom-in view of the interface between POLA1core and TtCST with sstDNA. Cryo-EM densities are shown as transparent surface. The template entry port formed by POLA1core NTD and Exo and Ctc1 OB-C is indicated by a cycle. i, Path of sstDNA in the cryo-EM structure of Tt telomerase–PolαPrim. The sstDNA binds in the C-shape cleft of Ctc1 OB-C with its 5’ side, while its 3’ side passes through the template entry port to the active site of POLA1core (left). A G-quadruplex (GQ) formed by four Tt telomere repeats (modeled based on PDB 7JKU) is observed on a positively charged DNA binding surface of POLA1core between the palm and thumb (right). j, Superimposition of the GQ structure and cryo-EM density. Weak density of sstDNA can be observed connecting the sstDNA on Ctc1 OB-C to the GQ.
Extended Data Fig. 9:
Extended Data Fig. 9:. Comparison of TtCST and hCST.
a, Domain diagrams of TtCST and hCST. b, Structural homology analysis of individual OB domains of TtCtc1 (OB-A to -C) and human CTC1 (OB-A to -G) using the Dali sever. Based on the resulted pairwise Z-scores, TtCtc1 OB-B and OB-C are identified as homologs of human CTC1 OB-F and OB-G, respectively. c, Structural comparison of individual domains from TtCST (color) with corresponding domains from hCST (gray). Structures of WH-WH domains of Tt Stn1 and human STN1 were superposed based on WH1 or WH2 domain. The relative orientation of the two WH domains is different between Tt and human. d, The interface between Stn1 WH-WH and Ctc1 in the cryo-EM structure of Tt telomerase–PolαPrim. Cryo-EM densities are shown as transparent surfaces. An previously unstructured loop of Ctc1 OB-C (Extended Data Fig. 2b) partially forms an α helix (α520–540) and contributes to the interface with Stn1 WH-WH. e, Comparison of DNA binding sites on TtCtc1 (color) and human CTC1 (gray). Conserved residues located on the DNA binding interface are shown as sticks. Cryo-EM densities of TtCtc1 are shown as transparent surfaces. In the decameric structure of hCST (PDB 6W6W), sstDNA primarily binds on CTC1 OB-F. However, in TtCST, the equivalent sstDNA binding site on OB-B is partially occluded by a helix (α6) that is part of an unstructured loop in hCTC1 OB-F. The helix α6 abuts TERT in TtCST without PolαPrim (Extended Data Fig. 2k) and Stn1 WH2 when PolαPrim is bound (as shown in d). f, Sequence conservation analysis of Ctc1 residues on the DNA binding interface. Residues shown in e are indicated with black arrows. Conserved cysteines in the Zn-ribbon motifs are indicated with pink arrows. g, SEC profile and SDS-PAGE gel of TtCST–p50 co-expressed in Sf9 cells. Gel samples are from the peak fractions of the SEC profile as indicated. h, EMSA of purified wild-type TtCST with d(GTTGGG)n, where n = 3, 5 or 10. i, Substitutions of TtCtc1 OB-B conserved residues K303E/K306E/F308A and F264A/Y268A substantially decrease d(GTTGGG)5 binding, as indicated by EMSAs. These results suggest that the binding site on TtCtc1 OB-B might be accessible to sstDNA in free TtCST where neither TERT nor Stn1 WH-WH stabilize helix α6. Wedges indicate two-fold dilution of TtCST. The first lane of each gel is a TtCST-free control. j, Quantifications of fraction of bound DNA for all the independent EMSA experiments with TtCST WT and variants as indicated (n=3 biological replicates). KD values were determined as described in Methods. k, Effect of TtCST residue substitutions on d(GTTGGG)5 binding. Data are mean ± s.d. from n=3 biological replicates shown in j. *P=0.04, **P=0.009, ****P<0.0001; one-tailed unpaired t-tests.
Fig. 1:
Fig. 1:. Cryo-EM structure of TtCST in telomerase holoenzyme.
a, Cryo-EM map of telomerase holoenzyme. b, Ribbon representation of the model of telomerase holoenzyme, viewed after a 180° rotation from a. The proteins, TER and DNA are color-coded as indicated. c, Structure and schematic of TtCST with p50. The three OB domains (OB-A, -B, and -C) of Ctc1 are colored individually as indicated. In the schematic, invisible regions in the cryo-EM map are shown as dashed boxes. Intermolecular interactions between proteins are indicated as gray shading. OB, oligonucleotide/oligosaccharide-binding fold domain; WH, winged-helix domain; CBM, CST binding motif; CTD, C-terminal domain; Zn2+, Zn-ribbon motif. d, Surface representation of TtCST structure. Buried surface areas in the interfaces between TtCST subunits are indicated. The two structured linkers between Ctc1 OB domains are shown as ribbon. e, Zoom-in view of the hydrophobic interface of TtCST intermolecular three-helix bundle.
Fig. 2:
Fig. 2:. Interface between TtCST and p50.
a, Cryo-EM maps of telomerase holoenzyme with TtCST at different positions. TtCST subunits and p50 are colored as indicated. The three-helix bundle and Zn-ribbon motif are labeled with black and green arrows, respectively. Cryo-EM maps are low-pass filtered to similar resolution for comparison. b, Interactions between Ctc1 OB-A and p50 CBM. Unmodeled regions in the cryo-EM structure are shown as dashed lines. c, 1H-15N HSQC spectra of 15N-labelled p50 peptide (residues 228–250) with (red) and without (gray) Ctc1 OB-A. NMR signals from the same residues are connected with dashed arrows or labeled with asterisks. Inset shows the 10 lowest energy CS-Rosetta models of p50 peptide (Cα RMSD 1.73 Å) in the presence of Ctc1 OB-A. d, Chemical shift perturbation (CSP) index of 15N-labelled Ctc1 OB-A upon binding p50 peptide. Residues with CSP over 0.25 ppm are highlighted in magenta, and their locations on the cryo-EM structure are shown in an inserted panel and on b.
Fig. 3:
Fig. 3:. Structure of Tetrahymena telomerase holoenzyme in complex PolαPrim.
a, Composite map of the complex generated with focused refined cryo-EM maps (Extended Data Fig. 6a). b, Atomic model of the complex. The unstructured linker between Stn1 OB and WH-WH domains is shown as dashed line. c, Concurrent time courses of G-strand and C-strand synthesis by telomerase-PolαPrim using d(GTTGGG)3 DNA primers (detailed in Methods). 32P-dGTP and 32P-dCTP were used to label the G-strand and C-strand products, respectively. The G-strand products provide the template for C-strand synthesis. RC, recovery control. Supplementary Fig. 1 provides gel source data for all figures. d, Structure-based diagram of PolαPrim. Intermolecular interactions between subunits are indicated as gray shading. e, Representative 2D-class averages of PolαPrim. f, Cryo-EM structure of PolαPrim. The flexible linker between POLA1core and POLA1CTD is shown as dashed line.
Fig. 4:
Fig. 4:. Interface between TtCST and POLA1core.
a, Ribbon representation of TtCST and POLA1core with individual protein/domain/motif colored as indicated. Location of POLA1 active site is shown as a red star. NTD, N-terminal domain; Exo, exonuclease domain. b, Structure-based diagram of POLA1core and interactions with TtCST. c, d, Zoom-in views of the interface between POLA1core and TtCST with sstDNA shown from perpendicular directions. e, EMSA of d(GTTGGG)5 DNA binding by wild-type (WT) and Ctc1 mutant TtCST. Wedges indicate two-fold dilutions of TtCST from 3.5 to 0.03 μM. The first lane of each gel is a TtCST-free control. Quantification results of EMSAs were shown in Extended Data Fig. 9j. f, sstDNA binding site on Ctc1 OB-C. Sidechains of residues substituted for EMSA are shown as sticks. g, Zoom-in view of POLA1core (electrostatic surface) with a DNA duplex modeled based on human POLA1 structure (PDB 5IUD). The template and product strands in the duplex are colored in green (G-strand) and purple (C-strand), respectively. The path of sstDNA in the channel is shown as dashed line.
Fig. 5:
Fig. 5:. Structural comparison of TtCST and hCST.
a, b, Surface representation of TtCST (a) and hCST (PDB 6W6W) (b) with Stn1/STN1 shown as ribbons. Corresponding subunits/domains are colored the same as indicated. c, Cartoon illustrations of hCST with STN1 WH-WH in “arm” and “head” conformations. The linker between STN1 OB and WH-WH is shown as dashed line. d, Model of Tetrahymena telomerase holoenzyme in complex with PolαPrim. The DNA duplex on POLA1core is modeled based on a homology model of human POLA1core(ref) (PDB 5IUD). Position of the POLA2–POLA1CTD–PRIM2N–PRIM1 platform relative to POLA1core is based on a low-resolution cryo-EM map in Extended Data Fig. 7a. Telomeric DNA G-strand and C-strand are colored green and purple, respectively. PRIM2C is shown as an oval connecting to PRIM2N. Active sites on TERT, PRIM1, and POLA1 for the synthesis of G-strand, C-strand primer, and C-strand, respectively, are denoted by red stars. During G-strand and C-strand synthesis, these active sites would be occupied successively for a given G-strand, not simultaneously.

Similar articles

Cited by

References

    1. de Lange T Shelterin-Mediated Telomere Protection. Annu Rev Genet 52, 223–247 (2018). - PubMed
    1. Lim CJ & Cech TR Shaping human telomeres: from shelterin and CST complexes to telomeric chromatin organization. Nat Rev Mol Cell Biol (2021). - PMC - PubMed
    1. Baumann P & Cech TR Pot1, the putative telomere end-binding protein in fission yeast and humans. Science 292, 1171–1175 (2001). - PubMed
    1. Abreu E et al. TIN2-tethered TPP1 recruits human telomerase to telomeres in vivo. Mol Cell Biol 30, 2971–2982 (2010). - PMC - PubMed
    1. Nandakumar J et al. The TEL patch of telomere protein TPP1 mediates telomerase recruitment and processivity. Nature 492, 285–289 (2012). - PMC - PubMed

MeSH terms