. 2022 Sep;609(7925):159-165.
doi: 10.1038/s41586-022-04934-4. Epub 2022 Jul 13.

ZBTB46 defines and regulates ILC3s that protect the intestine

Collaborators, Affiliations

ZBTB46 defines and regulates ILC3s that protect the intestine

Wenqing Zhou et al. Nature. 2022 Sep.

Abstract

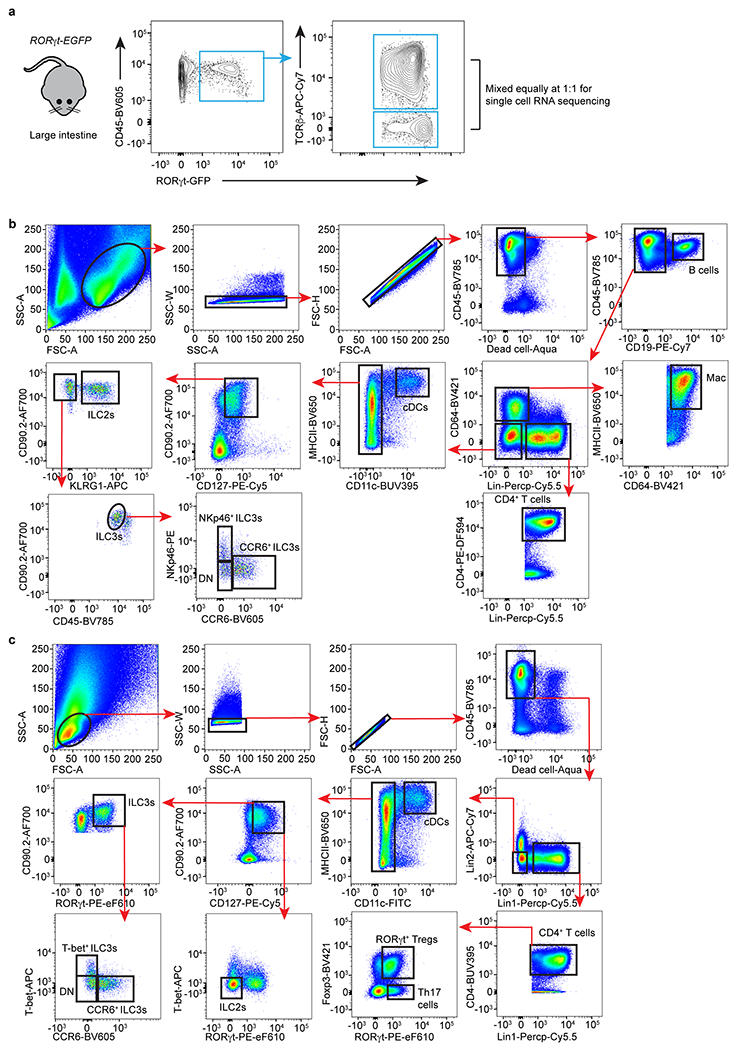
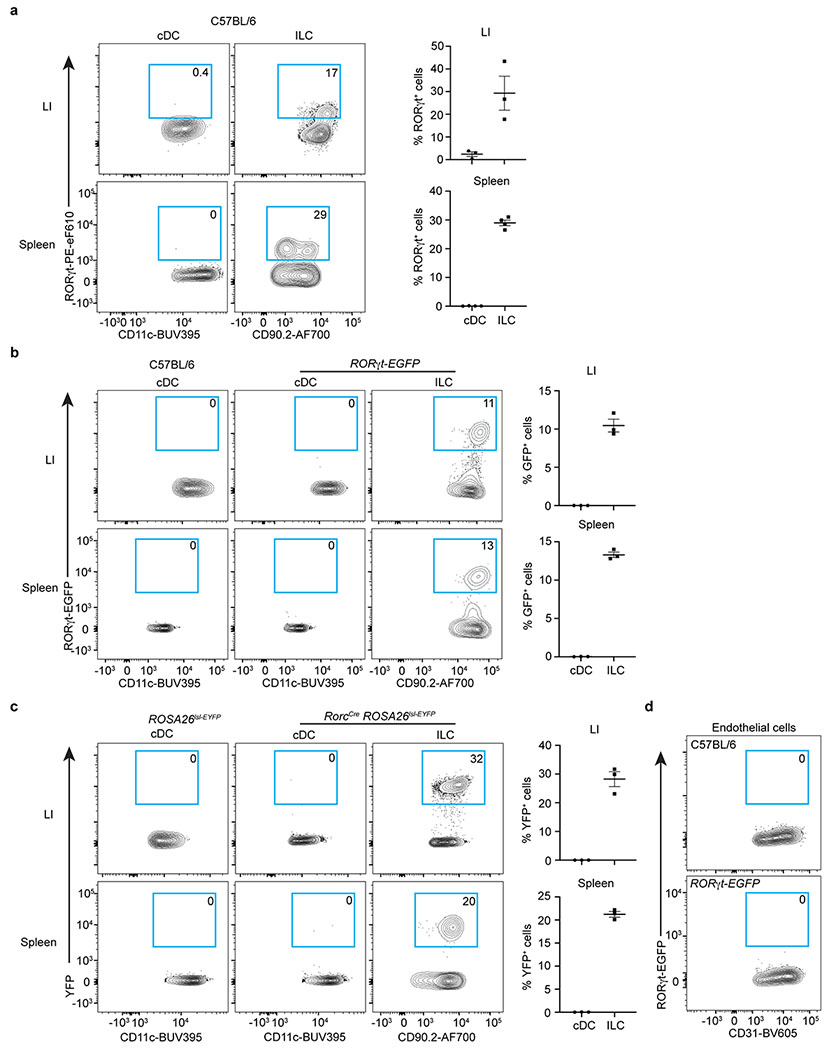
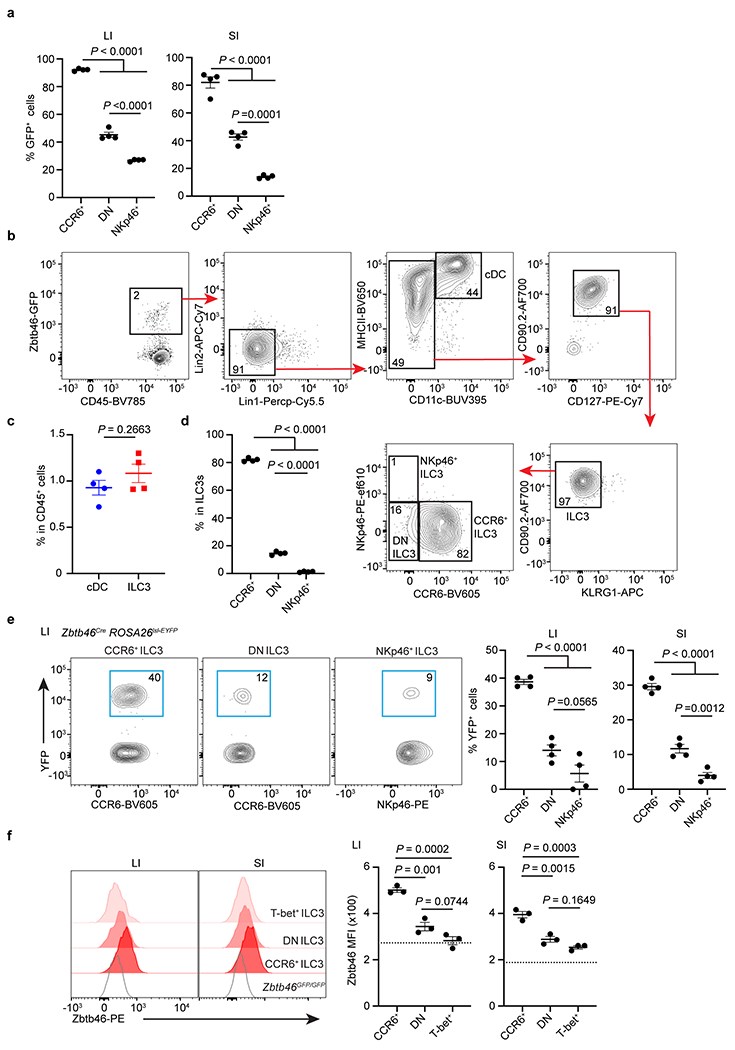
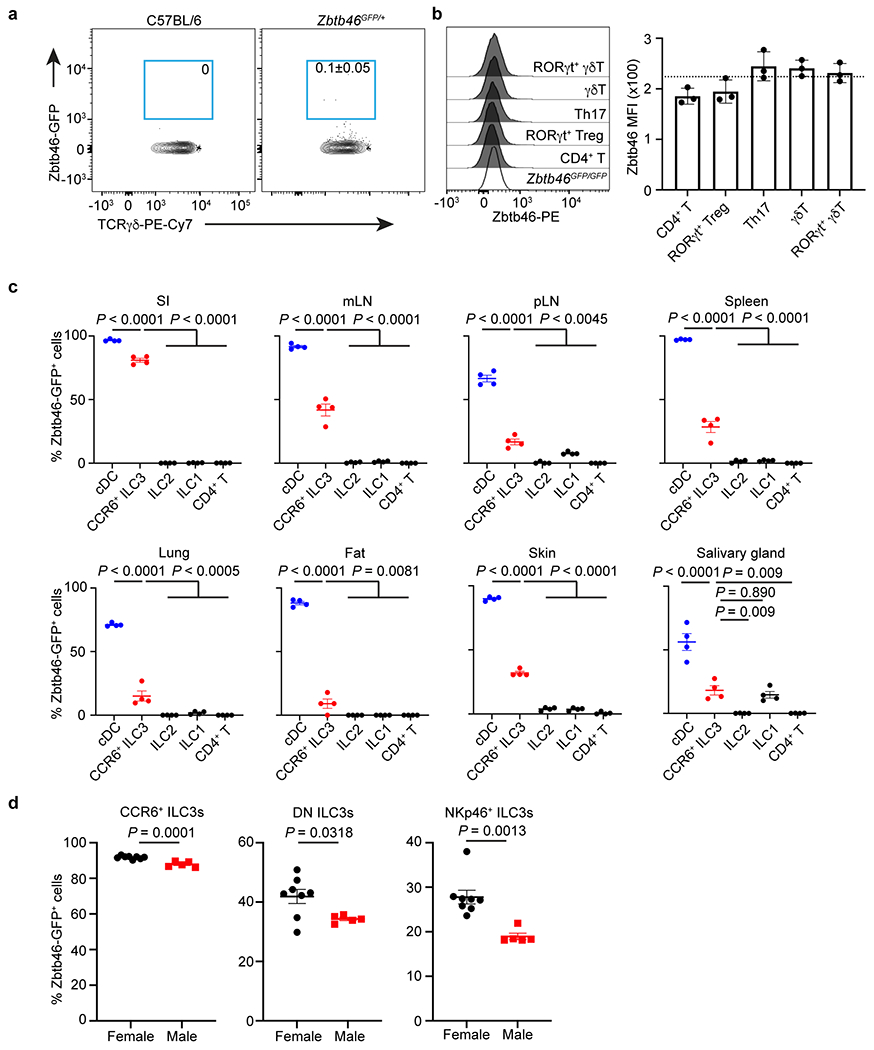
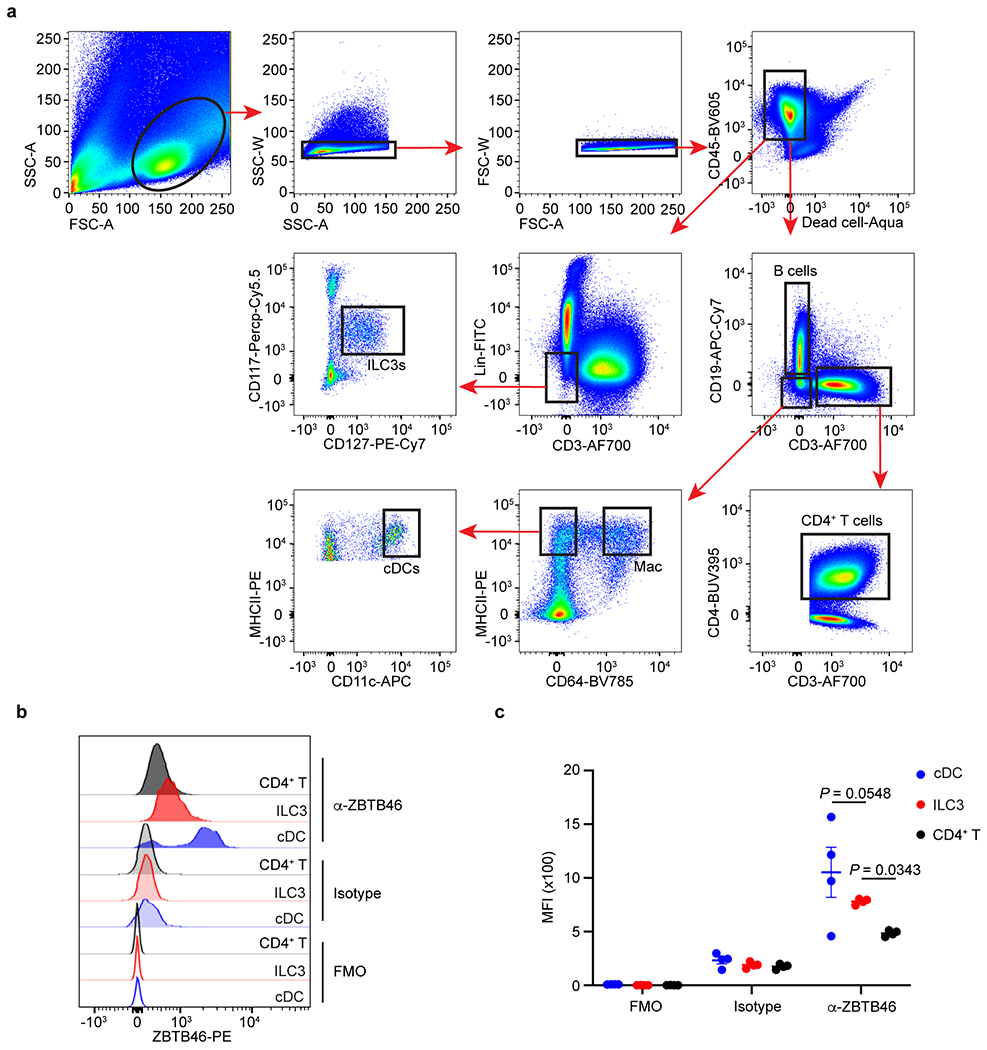
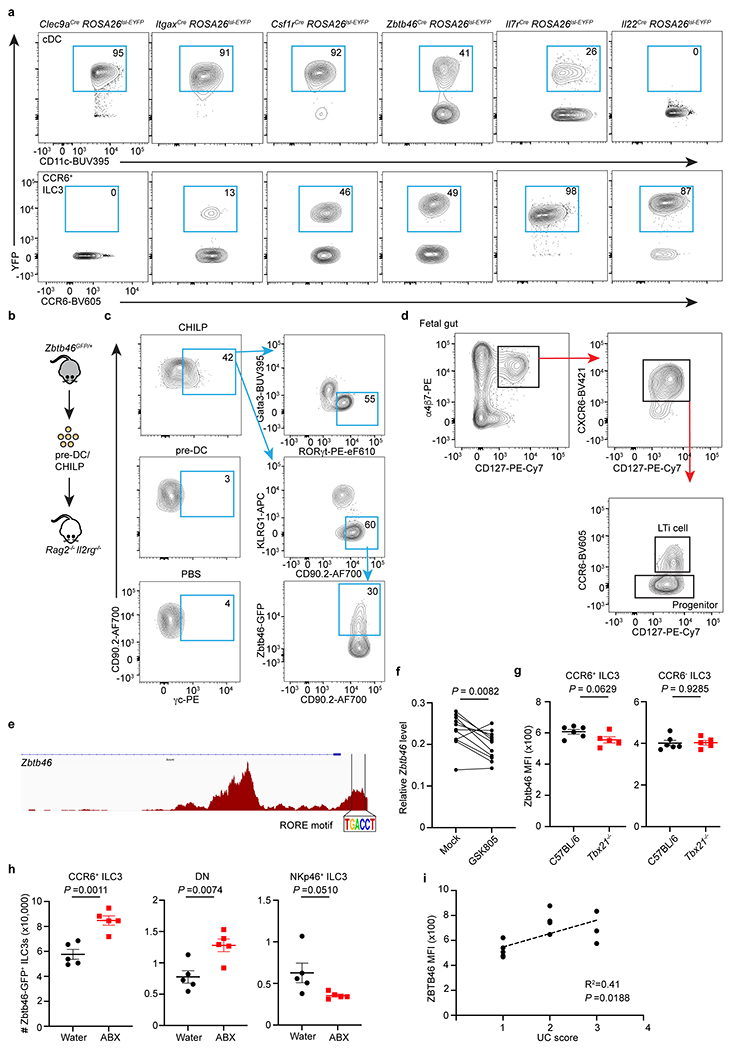
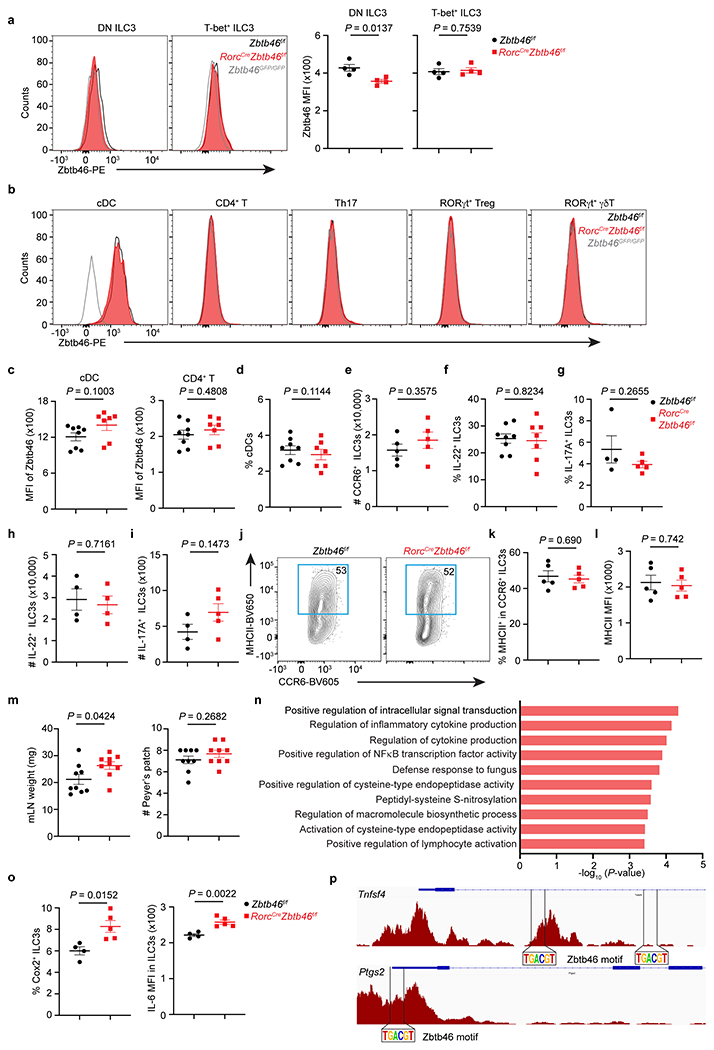
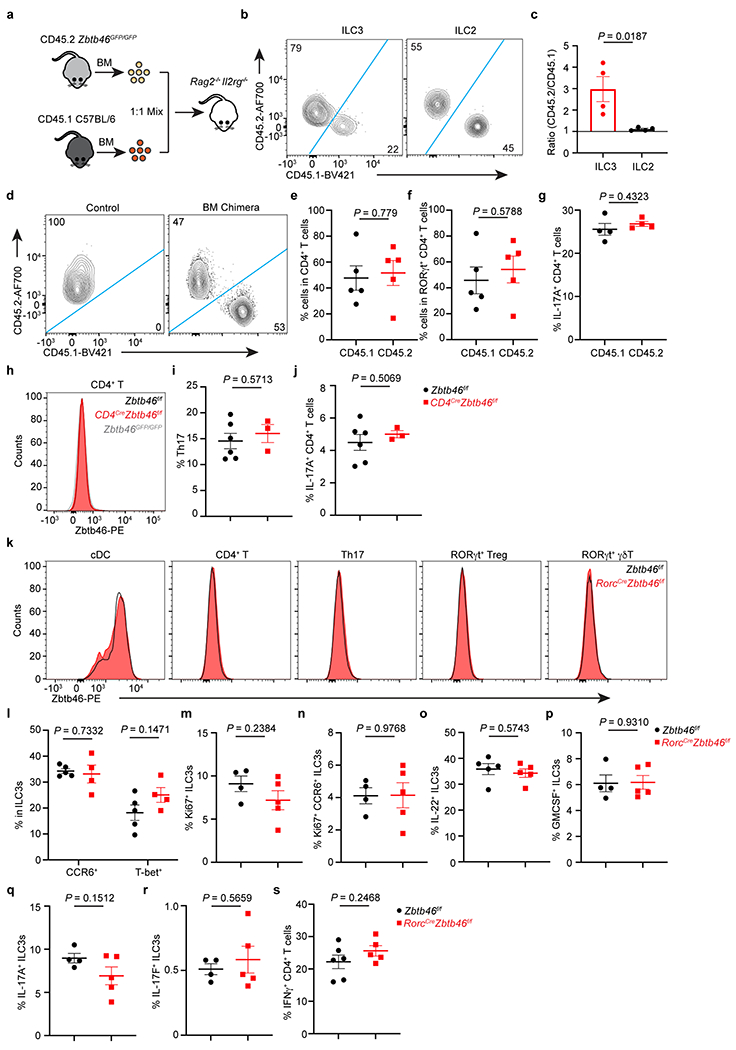
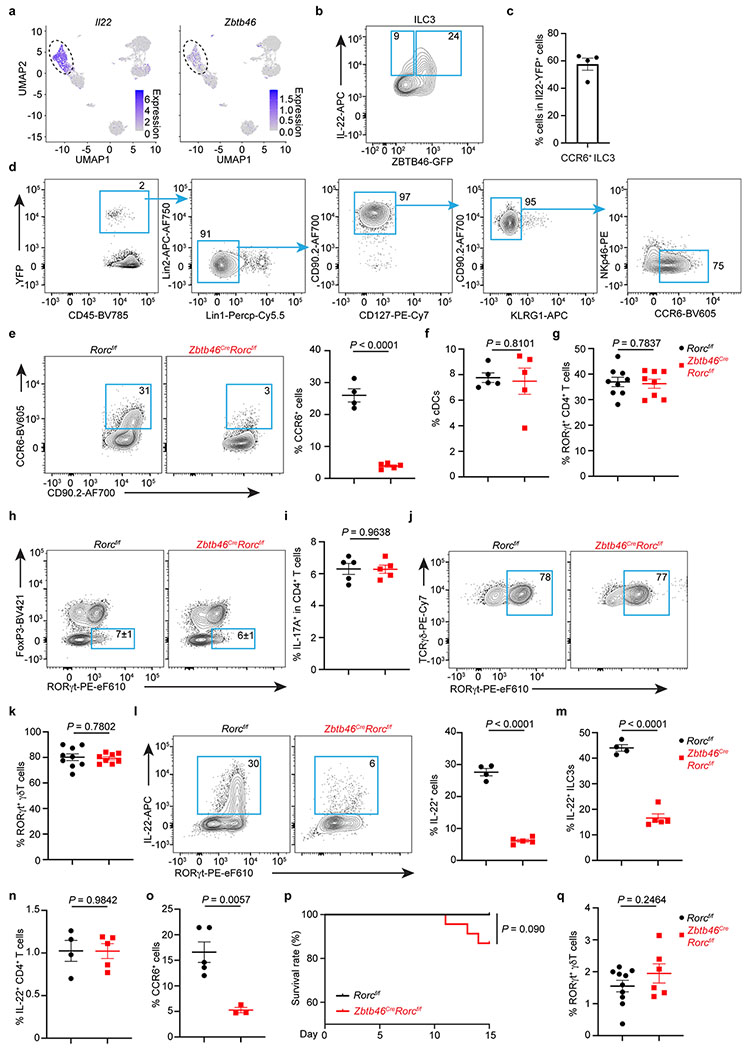
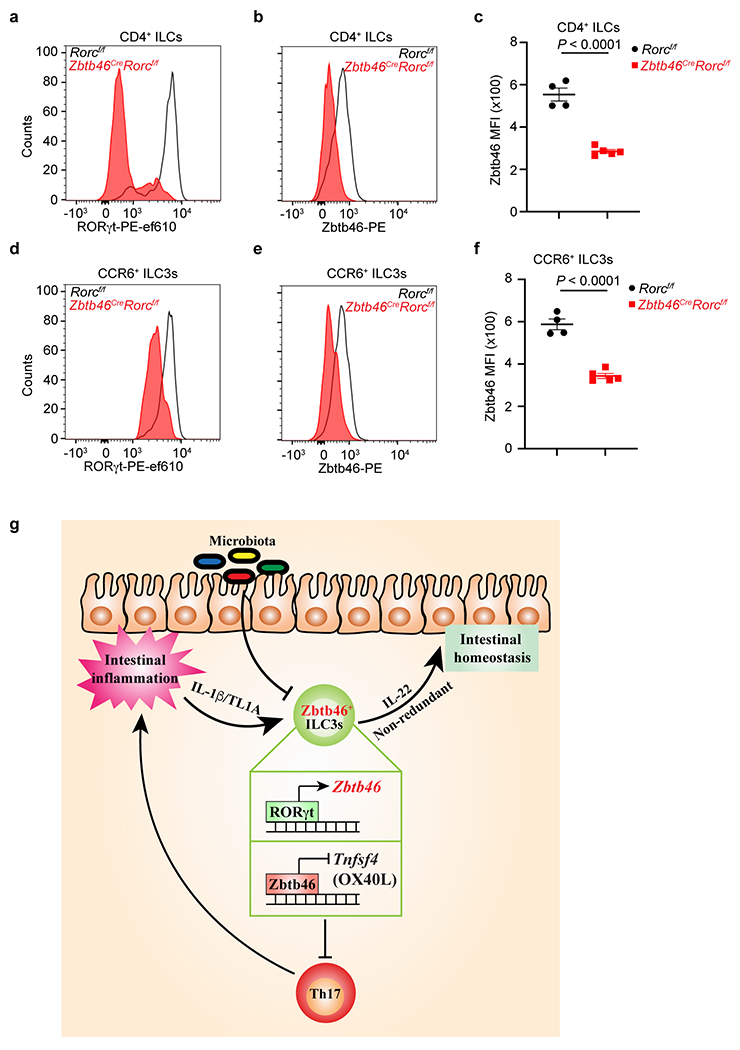
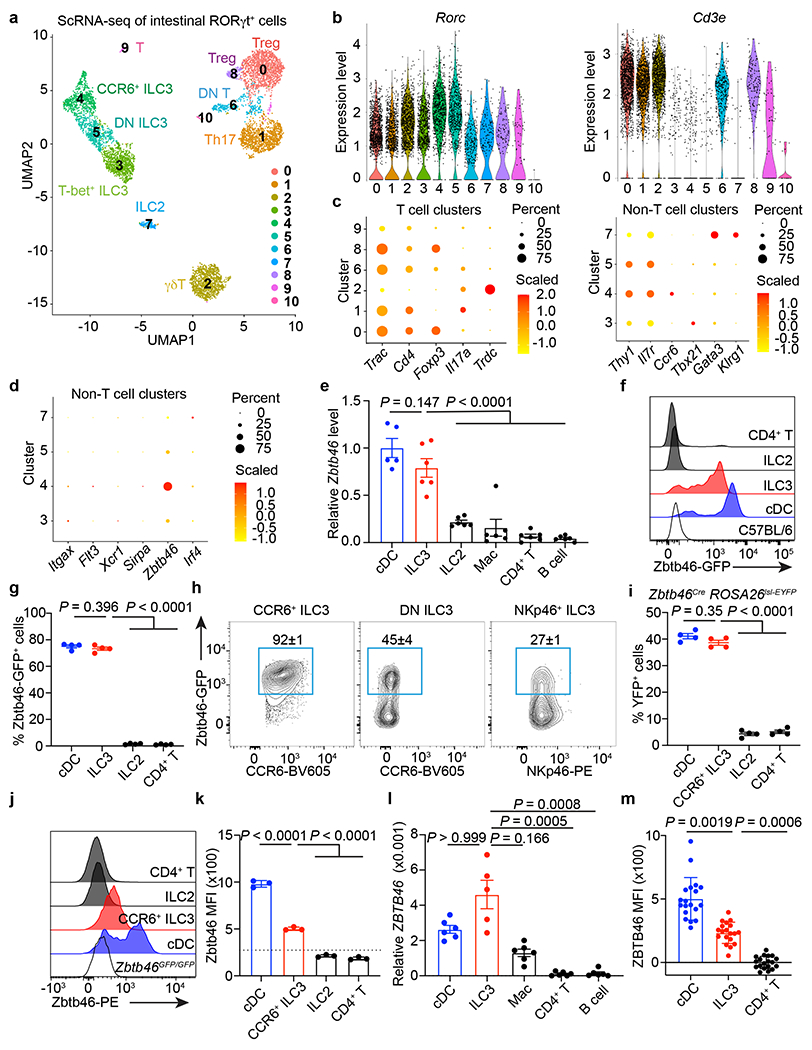
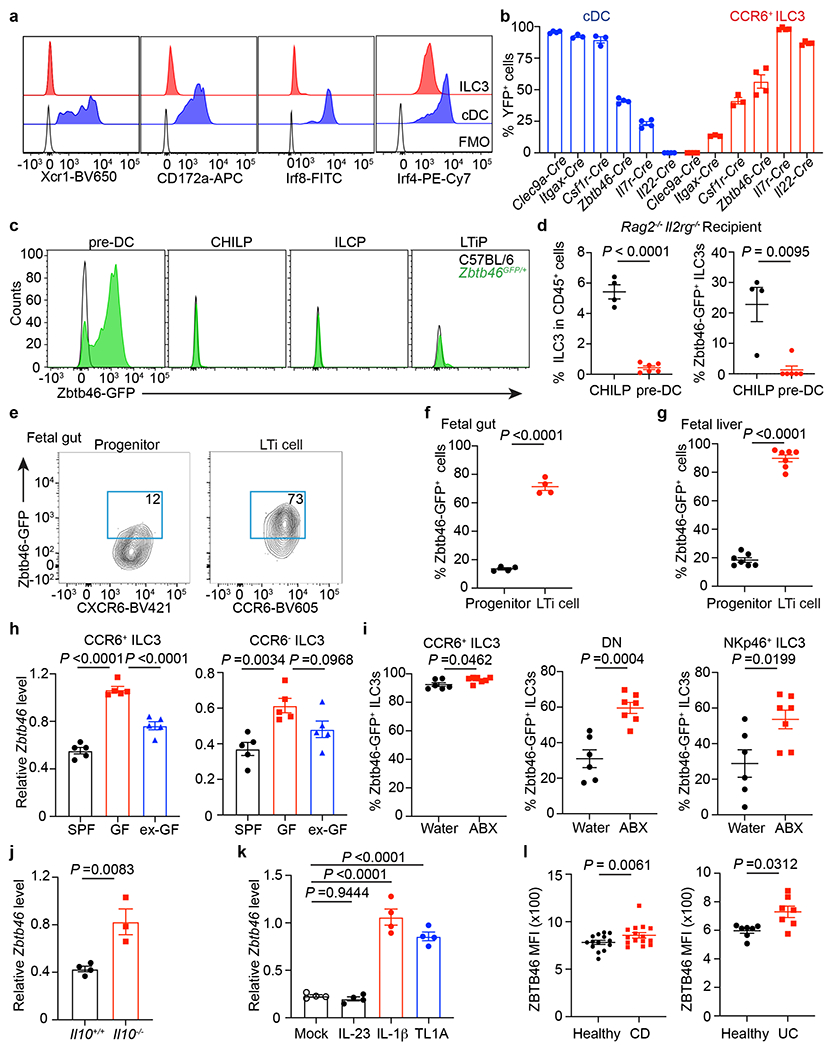
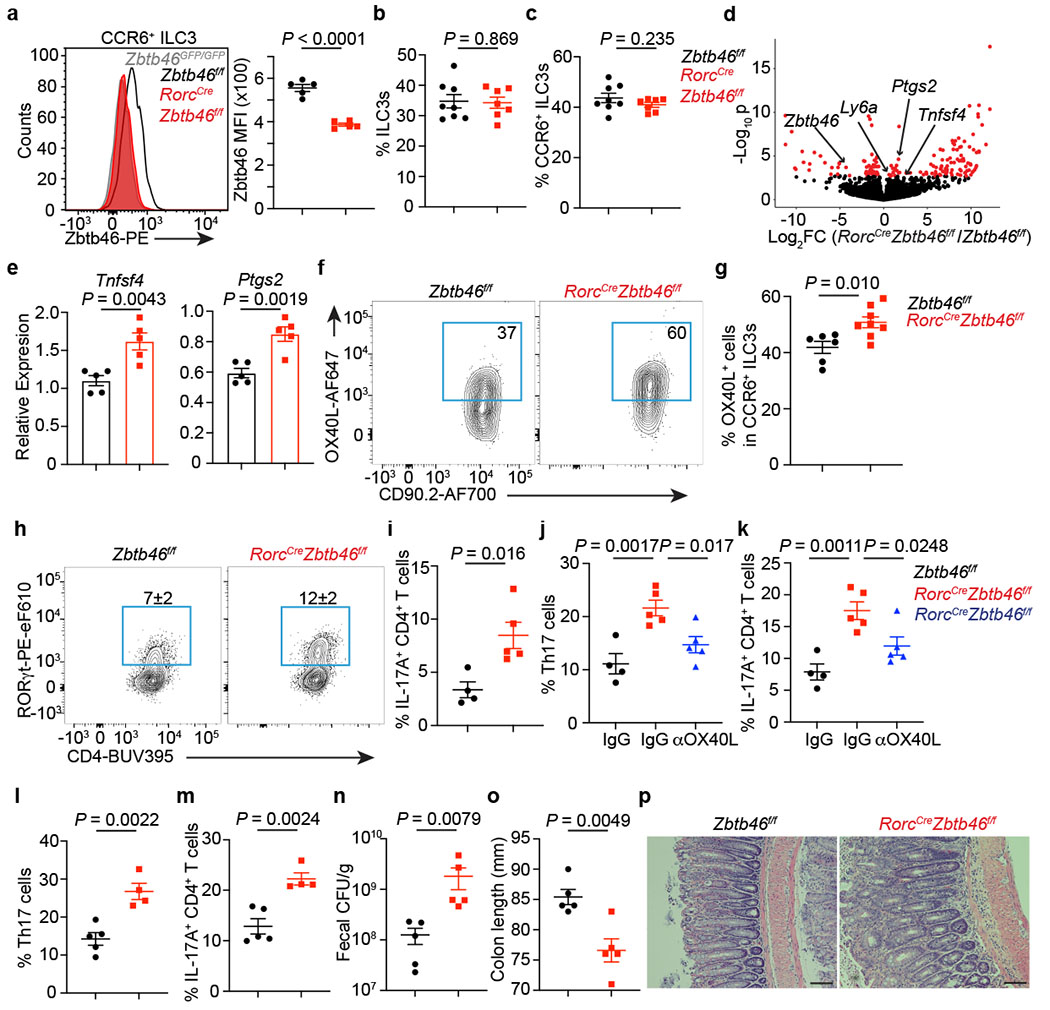
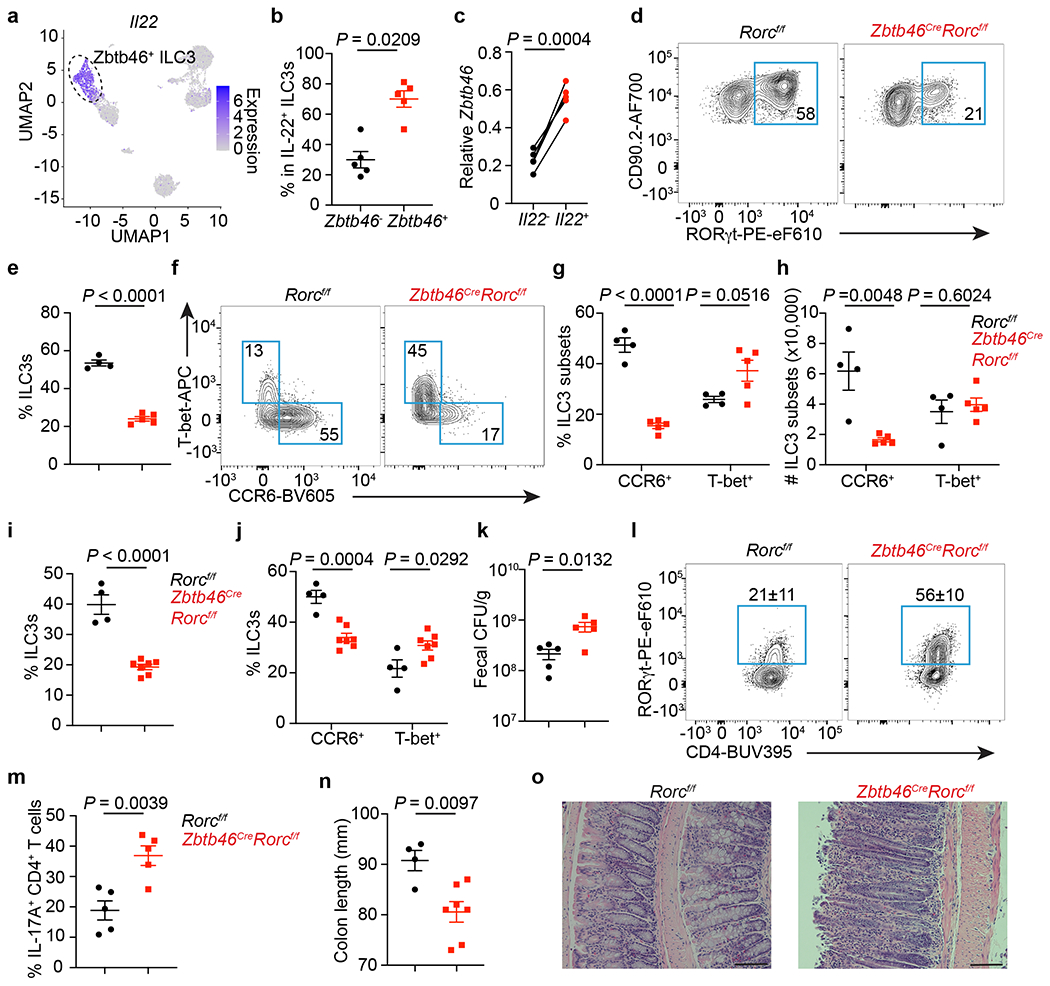
RORγt is a lineage-specifying transcription factor that is expressed by immune cells that are enriched in the gastrointestinal tract and promote immunity, inflammation and tissue homeostasis1-15. However, fundamental questions remain with regard to the cellular heterogeneity among these cell types, the mechanisms that control protective versus inflammatory properties and their functional redundancy. Here we define all RORγt+ immune cells in the intestine at single-cell resolution and identify a subset of group 3 innate lymphoid cells (ILC3s) that expresses ZBTB46, a transcription factor specifying conventional dendritic cells16-20. ZBTB46 is robustly expressed by CCR6+ lymphoid-tissue-inducer-like ILC3s that are developmentally and phenotypically distinct from conventional dendritic cells, and its expression is imprinted by RORγt, fine-tuned by microbiota-derived signals and increased by pro-inflammatory cytokines. ZBTB46 restrains the inflammatory properties of ILC3s, including the OX40L-dependent expansion of T helper 17 cells and the exacerbated intestinal inflammation that occurs after enteric infection. Finally, ZBTB46+ ILC3s are a major source of IL-22, and selective depletion of this population renders mice susceptible to enteric infection and associated intestinal inflammation. These results show that ZBTB46 is a transcription factor that is shared between conventional dendritic cells and ILC3s, and identify a cell-intrinsic function for ZBTB46 in restraining the pro-inflammatory properties of ILC3s and a non-redundant role for ZBTB46+ ILC3s in orchestrating intestinal health.


Conflict of interest statement

The authors declare no competing interests.

Figures

Extended Data Figure 1.
Extended Data Figure 1.. Gating of immune cells from the large intestine of mice.
a. Cells were isolated from the large intestine lamina propria of RORγt-EGFP reporter mice. Two populations, TCRβ+ cells and TCRβ cells, of RORγt+ immune cells were sorted separately and equally mixed at a 1:1 ratio, permitting enrichment of non-T lymphocytes populations. b. Gating strategy for different immune cells with surface markers. Lineage markers included: CD3, CD5, NK1.1, TCRγδ, Ly6G. B cells were gated as CD45+CD19+; Macrophages (Mac) were gated as CD45+CD64+MHCII+; cDCs were gated as CD45+LinCD64CD11hiMHCIIhi. CD4+ T cells were gated as CD45+Lin+CD4+; ILC2s were gated as CD45+LinCD64CD11cCD127+CD90+KLRG1+; ILC3s were gated as CD45dimLinCD64CD11cCD127+CD90hiKLRG1; ILC3s were further gated as CCR6+, NKp46+ or DN subset. c. Gating strategy for different immune cells with transcription factors. Lineage 1: CD3, CD5, NK1.1, TCRγδ, Ly6G. Lineage 2: F4/80 and B220. cDCs were gated as CD45+LinCD11hiMHCIIhi; Th17 cells were gated as CD45+Lin+CD4+FoxP3RORγt+; ILC3s were gated as CD45+LinCD11cCD127+CD90+RORγt+, and further gated as CCR6+, T-bet+, or DN; ILC2s were gated as CD45+LinCD11cCD127+CD90+RORγtT-bet.
Extended Data Figure 2.
Extended Data Figure 2.. RORγt expression among ILCs and cDCs.
a. Representative flow cytometry plots and quantifications of RORγt+ cells in cDCs and ILCs in the large intestine (LI) (n = 3 mice) or spleen of C57BL/6 mice by protein staining (n = 4 mice). ILCs were gated as CD45+LinCD11cCD127+CD90.2+. b. Representative flow cytometry plots and quantifications of RORγt-GFP+ cells in cDCs and ILCs in RORγt-EGFP reporter mice (n = 3 mice). c. Representative flow cytometry plots and quantifications of YFP+ cells in cDCs and ILCs in RorcCreROSA26lsl-EYFP fate mapping mice (n = 3 mice). d. Representative flow cytometry plots of RORγt-GFP+ cells in endothelial cells in RORγt-EGFP reporter mice. Data are representative of two or three independent experiments and shown as the means ± S.E.M in a-d.
Extended Data Figure 3.
Extended Data Figure 3.. Zbtb46 is significantly enriched in CCR6+ LTi-like ILC3s from the intestine.
a. Quantifications of frequencies of Zbtb46-GFP+ cells in indicated ILC3 subsets in the large intestine (LI) or small intestine (SI) of Zbtb46GFP/+ mice (n = 4 mice for both LI and SI). b-d. Unbiased gating for Zbtb46-GFP+ cells from the large intestine of Zbtb46GFP/+ mice. c. Quantification of the frequency of Zbtb46-GFP+ cDCs or ILC3s in total CD45+ immune cells from the large intestine of Zbtb46GFP/+ mice (n = 4 mice). d. Quantification of the frequency of Zbtb46-GFP+ ILC3 subsets from the large intestine of Zbtb46GFP/+ mice (n = 4 mice). e. Representative flow plots and quantifications of frequencies of Zbtb46Cre fate-mapped cells in indicated ILC3 subsets in the large intestine (LI) or small intestine (SI) of Zbtb46CreROSA26lsl-EYFP mice (n = 4 for both LI and SI). f. Representative flow histograms and quantifications of Zbtb46 MFI in indicated ILC3 subsets from the large intestine (LI) or small intestine (SI) of C57BL/6 or Zbtb46GFP/GFP mice (n = 3 for both LI and SI). The dash line indicates Zbtb46 MFI in CCR6+ ILC3s from Zbtb46GFP/GFP. Data are representative of two or three independent experiments and shown as the means ± S.E.M.. Statistics are calculated by One-way ANOVA with Dunnett’s multiple comparisons in a, d, e, and f, two-tailed unpaired Student’s t-test in c.
Extended Data Figure 4.
Extended Data Figure 4.. Zbtb46 is expressed by ILC3s in mucosal and lymphoid tissues.
a. Representative flow plots of Zbtb46-GFP+ cells in γδT cells in the large intestine of C57BL/6 or Zbtb46GFP/+ mice (n = 4 mice). b. Representative flow cytometry histogram and quantification of Zbtb46 MFI in indicated T cell subsets from the large intestine of C57BL/6 or Zbtb46GFP/GFP mice (n = 3 mice). The dash line indicates Zbtb46 MFI in CD4+ T cells from Zbtb46GFP/GFP. c. Quantification of Zbtb46-GFP+ cell frequencies of indicated cells in the small intestine (SI), mesenteric lymph nodes (mLN), periphery lymph nodes (pLN), Spleen, Lung, Fat, Skin, and salivary gland of Zbtb46GFP/+ mice (n = 4 mice for all tissues). d. Quantification of Zbtb46-GFP+ cell frequencies of ILC3 subsets in the large intestine of Zbtb46GFP/+ female or male mice (n = 8 or 5 mice per group for all subsets). Data are representative of two independent experiments a-c, and data are pooled from 2 individual experiments in d. Data are shown as the means ± S.E.M. in b-d, means ± S.D. in a. Statistics are calculated by One-way ANOVA with Dunnett’s multiple comparisons in c and by two-tailed unpaired Student’s t-test in d.
Extended Data Figure 5.
Extended Data Figure 5.. Gating strategy for different immune cells in human intestine.
a. Lineage markers included: CD19, CD94, CD14, CD123, FcεR1a, CD34. B cells were gated as CD45+CD19+CD3; Macrophages (Mac) were gated as CD45+CD19CD3CD64+MHCII+; cDCs were gated as CD45+CD19CD3CD64CD11hiMHCIIhi. CD4+ T cells were gated as CD45+CD3+CD4+; ILC3s were gated as CD45+LinCD3CD127+CD117+. b,c. Representative flow cytometry histogram of ZBTB46 staining and quantification of ZBTB46 MFI in indicated cells from human tonsils (n = 4 individual donors per group). FMO: full staining minus one; Isotype: Isotype control. Data are representative of two independent experiments in b,c, and shown as the means ± S.E.M. Statistics are calculated by One-way ANOVA with Dunnett’s multiple comparisons.
Extended Data Figure 6.
Extended Data Figure 6.. Zbtb46+ ILC3s and cDCs are distinct cell lineages.
a. Representative flow cytometry plots showing the YFP+ cells in cDCs and CCR6+ ILC3s from the large intestine of indicated fate-mapping mice. b. Schematic of progenitor cell transfer. pre-DC or CHILP were sort-purified from the bone marrow of Zbtb46GFP/+ and transferred into Rag2−/− Il2rg−/− recipient mice. Six weeks later, ILC3s and Zbtb46-GFP expression were analyzed in the intestine of recipient mice. PBS injection was used as a negative control. pre-DCs were gated as: (Ter119, CD19, B220, CD3, CD5, NK1.1, Ly6G, CD11b)CD127MHCIICD117CD16/32CD11c+Flt3+GFP+; CHILP were gated as (Ter119, B220, CD19, NK1.1, CD3, CD5, CD11b, CD11c, Ly6G)CD45+CD127+α4β7+Flt3CD25CD117+. c. Representative flow plots of recipient mice injected with indicated progenitor cells. γc staining was used to differentiate the host-derived and recipient-derived ILCs. d. Gating strategies for progenitors and LTi cells from the fetal tissue. e. RORγt (RORE) motif analysis of the Zbtb46 locus in ATAC-seq data from CCR6+ ILC3s. f. Zbtb46 expression relative to Hprt in sort purified CCR6+ ILC3s with or without exposure to the RORγt inhibitor GSK805 (n = 11 mice). g. Quantification of Zbtb46 MFI in CCR6+ or CCR6 ILC3s from the large intestine of indicated mice (n = 6 or 5 mice per group for both subsets). h. Quantification of cell numbers of Zbtb46-GFP+ cells in indicated ILC3 subsets from the large intestine of water or ABX-treated Zbtb46GFP/+ mice (n = 5 mice for all subsets). i. Correlation analysis of ZBTB46 expression and disease scores in Ulcerative colitis patients. Data are pooled from three or two individual experiments in f and g, data are representative of two independent experiments in h. Data are shown as means ± S.E.M in g and h. Statistics are calculated by two-tailed paired Student’s t-test in f, two-tailed unpaired Student’s t-test in g and h, and the correlation is determined by simple linear regression in i.
Extended Data Figure 7.
Extended Data Figure 7.. Comparison of naïve RorcCreZbtb46f/f mice relative to littermates.
a. Representative flow cytometry histograms and quantification of Zbtb46 MFI in double-negative (DN) or T-bet+ ILC3s from the large intestine of indicated mice (n = 4 mice per group for both subsets). b. Representative flow cytometry histograms of Zbtb46 in cDCs and different T cell subsets in the large intestine of indicated mice. c. Quantification of geometric MFI of Zbtb46 in cDCs and CD4+ T cells (n = 8 or 7 mice per group for both cell types). d. The frequency of cDCs in the large intestine of indicated mice (n = 8 or 7 mice per group). e. Quantification of CCR6+ ILC3 cell numbers in the large intestine of indicated mice (n = 5 mice per group). f. Quantification of the frequencies of IL-22+ ILC3s in indicated mice (n = 8 or 7 mice per group). g. Quantification of the frequencies of IL-17A+ ILC3s in indicated mice (n = 4 or 5 mice per group). h. Quantification of the cell numbers of IL-22+ ILC3s in indicated mice (n = 4 mice per group). i. Quantification of the cell numbers of IL-17A+ ILC3s (n = 4 or 5 mice per group) in indicated mice. j,k. Representative flow plots and quantification of the frequencies of MHCII+ CCR6+ ILC3s in the large intestine of indicated mice (n = 5 mice per group). l. Quantification of MHCII MFI in CCR6+ ILC3s in indicated mice (n = 5 mice per group). m. Quantification of mLN weight and the numbers of Peyer’s patches in indicated mice (n = 9 mice per group). n. Go pathway analysis of the upregulated genes in the RorcCreZbtb46f/f mice compared to Zbtb46f/f mice. o. Quantification of the frequencies of COX-2+ (n = 4 or 5 mice per group) or IL-6 MFI (n = 4 or 5 mice per group) in ILC3s in the large intestine of indicated mice. p. Zbtb46 motif analysis of the Tnfsf4 and Ptgs2 loci in ATAC-seq data from CCR6+ ILC3s. Data are representative of three independent experiments in a, b, e, g-l, o. Data are pooled from two independent experiments in c, d, f, m. Data are shown as the means ± S.E.M. Statistics are calculated by two-tailed unpaired Student’s t-test.
Extended Data Figure 8.
Extended Data Figure 8.. Zbtb46 regulates ILC3s in a cell-intrinsic manner.
a. Schematic of mixed bone marrow (BM) chimera. The BM of CD45.2 Zbtb46GFP/GFP and CD45.1 C57BL/6 mice was equally mixed and transferred into Rag2−/−Il2rg−/− recipient mice. Mice were analyzed 6-8 weeks after transplantation. b,c. Representative flow plots of the composition of ILC3s or ILC2s, and quantification of the ratio of CD45.2 to CD45.1 cells in ILC3s or ILC2s in the large intestine of recipient mice (n = 4 mice). d. Representative flow plots of the composition of CD4+ T cells in non-transplanted (control) or BM chimera mice. e. Quantification of the frequencies of indicated CD4+ T cells in the large intestine of BM chimera mice (n = 5 mice). f. Quantification of the frequencies of indicated RORγt+ CD4+ T cells in the large intestine of BM chimera mice (n = 5 mice). g. Quantification of the frequencies of IL-17A+ CD4+ T cells in indicated congenic T cells of BM chimera mice (n = 4 mice). h. Representative flow cytometry histograms of Zbtb46 in CD4+ T cells in the large intestine of indicated mice. i. Quantification of the frequencies of Th17 cells in indicated mice (n = 6 or 3 mice per group). j. Quantification of the frequencies of IL-17A+ CD4+ T cells in indicated mice (n = 6 or 3 mice per group). k-s, Mice were orally infected with C. rodentium for two weeks prior to analysis. k. Representative flow cytometry histograms of Zbtb46 in cDCs and different T cell subsets. l. Quantification of the frequencies of ILC3 subsets in the large intestine of indicated mice (n = 5 or 4 mice per group for both subsets). m,n. Quantification of the frequencies of Ki67+ ILC3 (n = 4 or 5 mice per group) and Ki67+ CCR6+ ILC3s (n = 4 or 5 mice per group) in the large intestine of indicated mice. o-r, Quantification of the frequencies of IL-22+ (n = 5 mice per group), GMCSF+ (n = 4 or 5 mice per group), IL-17A+ (n = 4 or 5 mice per group), and IL-17F+ (n = 4 or 5 mice per group) ILC3s in the large intestine of indicated mice. s. Quantification of the frequencies of IFNγ+ CD4+ T cells in the large intestine of indicated mice (n = 6 or 5 mice per group). Data are representative of two or three independent experiments in b-s. Data are shown as the means ± S.E.M. Statistics are calculated by two-tailed unpaired Student’s t-test.
Extended Data Figure 9.
Extended Data Figure 9.. Zbtb46+ ILC3s are a dominant source of tissue protective IL-22.
a. UMAPs show the expression of Il22 or Zbtb46 in all clusters of RORγt+ immune cells from the large intestine of RORγtEGFP mice. The dash circle indicates IL-22+ ILC3s. b. Representative flow plot of IL-22 and Zbtb46 expression in the large intestine of Zbtb46GFP/+ mice. c. Quantification of CCR6+ ILC3s in total Il22-YFP+ cells from the large intestine of Il22CreROSA26lsl-YFP mice (n = 4 mice). d. Representative flow plots presenting unbiased gating for Il22-YFP+ cells in the large intestine of Il22CreROSA26lsl-EYFP fate-mapping mice. Lineage 1: CD3, CD5, NK1.1, TCRγδ, Ly6G. Lineage 2: F4/80 and B220. e. Representative flow plots and quantification of CCR6+ cells in the large intestine of indicated mice. Cells were gated from LineageCD90.2+CD127+ cells (n = 4 or 5 mice per group). f. Quantification of the frequencies of cDCs in the large intestine of indicated mice (n = 5 mice per group). g. Quantification of the frequencies of RORγt+ CD4+ T Cells in the large intestine of indicated mice (n = 9 or 8 mice per group). h, i. Representative flow plots and quantification of Th17 or IL-17A+ CD4+ T cells in the large intestine of indicated mice (n = 5 mice per group). j,k. Representative flow plots and quantification of the frequencies of RORγt+ γδ T cells in the large intestine of indicated mice (n = 9 or 8 mice per group). l. Representative flow plots and quantification of the frequencies of IL-22+ cells in the large intestine of indicated mice (n = 4 or 5 mice per group). Cells were gated from LineageCD90.2+CD127+ cells. m. Quantification of the frequencies IL-22+ ILC3s in the large intestine of indicated mice (n = 4 or 5 mice per group). Cells were gated from LineageCD90.2+CD127+RORγt+ ILC3s. n. Quantification of the frequencies IL-22+ CD4+ T cells in the large intestine of indicated mice (n = 4 or 5 mice per group). o-q. Mice were orally infected with C. rodentium for two weeks prior to analysis. o. Quantification of the frequencies of CCR6+ ILCs in the large intestine of indicated mice (n = 5 or 3 mice per group). Cells were gated from LineageCD90.2+CD127+ cells. p. Quantification of survival rate of indicated mice following C. rodentium infection (n = 21 or 23 mice per group). q. Quantification of the frequencies of RORγt+ γδ T cells out of total CD45+ cells in the large intestine of indicated mice (n = 10 or 6 mice per group). Data are representative of two independent experiments in b-d, and three independent experiments in e,f, h, i, l-o. Data are pooled from two independent experiments in g, k, and q. Data are pooled from four independent experiments in p. Data are shown as the means ± S.E.M. in c, e, f, g, i, k-o, q, and means ± S.D. in h. Statistics are calculated by two-tailed unpaired Student’s t-test in e-g, i, k-o, q, and by Log-rank (Mantel-Cox) test in p.
Extended Data Figure 10.
Extended Data Figure 10.. Regulation and function of Zbtb46+ ILC3s.
a. Representative flow cytometry histogram of RORγt expression in CD4+ ILCs from the large intestine of indicated mice. Cells were gated from LineageCD90.2+CD127+CD4+ cells. b,c. Representative flow cytometry histogram of Zbtb46 expression and quantification of Zbtb46 MFI in CD4+ ILCs from the large intestine of indicated mice (n = 4 or 5 mice per group). Cells were gated from LineageCD90.2+CD127+CD4+ cells. d. Representative flow cytometry histogram of RORγt expression in CCR6+ ILC3s from the large intestine of indicated mice. Cells were gated from LineageCD90.2+CD127+RORγt+CCR6+ cells. e,f. Representative flow cytometry histogram of Zbtb46 expression and quantification of Zbtb46 MFI in CCR6+ ILC3s from the large intestine of indicated mice (n = 4 or 5 mice per group). Cells were gated from LineageCD90.2+CD127+RORγt+CCR6+ cells. Data are representative of two independent experiments in a-f. Data are shown as the means ± S.E.M. Statistics are calculated by two-tailed unpaired Student’s t-test. g. Zbtb46 defines and regulates group 3 innate lymphoid cells that protect the intestine.
Figure 1.
Figure 1.. A single cell atlas of RORγt+ immune cells identifies Zbtb46 expression in ILC3s.
a. scRNA-seq UMAP projection of RORγt+ immune cells from the large intestine of RORγtEGFP mice. b. Violin plots of selected genes. c. Dot plot of selected gene. d. Dot plot of cDC markers. e. Zbtb46 mRNA relative to Hprt in indicated cells from the large intestine of C57BL/6 mice (n = 5 mice for cDCs or 6 for all others). f, g. Histogram of GFP (f), GFP+ cell frequency (g) (n = 4 mice), of indicated cells in the large intestine of Zbtb46GFP/+ mice. h. Flow cytometry plots of indicated ILC3 subsets in the large intestine of Zbtb46GFP/+ mice (n = 4 mice). i. Quantification of YFP+ cells of indicated cells in the large intestine of Zbtb46CreROSA26lsl-EYFP mice (n = 4 mice). j,k. Flow cytometry histogram (j) of Zbtb46 staining and quantification of geometric mean fluorescence intensity (MFI) in indicated cells (k) (n = 3 mice). The dash line indicates Zbtb46 MFI in CCR6+ ILC3s from Zbtb46GFP/GFP mice. l. ZBTB46 mRNA relative to ACTB in indicated cells sorted from the non-inflamed human intestine (n = 5 individual donors for ILC3s or 6 for all others). m. Quantification of ZBTB46 MFI in indicated cells from the healthy human intestine (n = 19 individual donors). MFI in CD4+ T cells was normalized to 0. Data in e are pooled from two independent experiments; data in f, g, h, i, j, and k are representative of two or three independent experiments. Data are shown as the means ± S.E.M in e, g, i, k, l, m, and means ± S.D. in h. Statistics are calculated by one-way ANOVA with Dunnett’s multiple comparisons in e, g, i, and k; one-way ANOVA Kruskal-Wallis test with Dunn’s multiple comparisons in l, and m.
Figure 2.
Figure 2.. Zbtb46+ ILC3s are distinct from cDCs and modulated by RORγt, microbes, and cytokines.
a. Histogram of indicated markers. FMO: full staining minus one. b. Quantification of YFP+ cells in the large intestine of indicated fate-mapping mice (n = 3 or 4 mice). c. Representative histograms for indicated cells from the bone marrow. d. ILC3 frequency (left, n = 4 or 6 mice) and Zbtb46-GFP+ ILC3s (right, n = 4 or 6 mice) from the intestine of Rag2−/−Il2rg−/− recipient mice. e,f. Representative plots and quantification from fetal gut of Zbtb46GFP/+ mouse embryos at E14.5 (each dot represents 2 pooled embryos, n = 8 embryos). g. Quantification of frequencies of cells from fetal liver of Zbtb46GFP/+ mouse embryos at E14.5 (n = 7 embryos). h. Zbtb46 mRNA relative to Hprt in cells sorted from the large intestine by qPCR (n = 5 mice). i. Quantification of cells from the large intestine of Zbtb46GFP/+ mice (n = 6 or 7 mice). j. Zbtb46 mRNA relative to Hprt in cells from the large intestine (n = 4 or 3 mice). k. Zbtb46 mRNA relative to Hprt of ex vivo stimulated CCR6+ ILC3s (n = 4 mice). l. Quantification of ZBTB46 MFI in ILC3s from the intestine of CD, UC, or matched healthy donors (n = 14 individual healthy donors versus 15 CD donors; n = 7 individual healthy versus UC donors). Data in a, b, c, e-k are representative of two or three independent experiments; data in d are pooled from two independent experiments. Data are shown as the means ± S.E.M. Statistics are calculated by two-tailed unpaired Student’s t-test in d (left panel), f, g, i, and j; two-tailed Mann-Whitney test in d (right panel); one-way ANOVA with Dunnett’s multiple comparisons in h and k; two-tailed Wilcoxon test in l.
Figure 3.
Figure 3.. Zbtb46 restrains ILC3s and limits intestinal inflammation.
a. Quantification of Zbtb46 MFI among cells (n = 5 mice). b. Frequency of ILC3s among LinCD90+CD127+ cells (n = 8 or 7 mice). c. Quantification of CCR6+ ILC3s (n = 8 or 7 mice). d. Differential gene expression in CCR6+ ILC3s. Red points are significantly different. e. qPCR of indicated genes (n = 5 mice). f,g. Quantification of OX40L+CCR6+ ILC3s (n = 6 or 8 mice). h. Quantification of Th17 cells gated on FoxP3CD4+ T cells (n = 4 or 5 mice). i. Quantification of IL-17A+CD4+ T cells (n = 4 or 5 mice). j. Quantification of Th17 cells (n = 4, 5, or 5 mice). k. Quantification of IL-17A+CD4+ T cells (n = 4, 5, or 5 mice). l-p. Mice were orally infected with C. rodentium. l. Quantification of Th17 cells at day 13 post infection (dpi) gated on FoxP3CD4+ T cells (n = 5 or 4 mice). m. Quantification of IL-17A+CD4+ T cells from infected mice (n = 5 or 4 mice). n. Quantification of fecal colony-forming units (CFU) at 8 dpi (n = 5 mice). o. Colon length (n = 5 mice) at 13 dpi. p. H&E staining of the distal colon at 13 dpi. All data are on cells isolated from the large intestine unless otherwise noted. Data in a, e, h, i, j, k, l-p are representative of 3 or 4 independent experiments. Data are pooled from two independent experiments in b, c, and g. Data are shown as the means ± S.E.M in a-c, e, g, i-o, and means ± S.D. in h. Statistics are calculated by two-tailed unpaired Student’s t-test in a-c, e, g, i, l-o; one-way ANOVA with Dunnett’s multiple comparisons in j and k. Scale bar: 100 μm.
Figure 4.
Figure 4.. Zbtb46+ ILC3s are non-redundant in controlling intestinal inflammation.
a. UMAP of Il22 expression among RORγt+ immune cells from the large intestine. Dash circle indicates Zbtb46+ ILC3s. b. Quantification of IL-22+ cells among Zbtb46+ versus Zbtb46 ILC3s (n = 5 mice). c. Zbtb46 mRNA relative to Hprt in ILC3s sorted from the large intestine of Il22-eGFP reporter mice (n = 5 mice). d,e. Flow plots and the frequency of ILC3s in LinCD90+CD127+ cells from the large intestine (n = 4 or 5 mice). f,g. Flow plots and quantification of ILC3 subsets in the large intestine (n = 4 or 5 mice). h, Cell numbers of ILC3 subsets in the large intestine (n = 4 or 5 mice). i-o. Mice were orally infected with C. rodentium. i. The frequency of ILC3s in LinCD90+CD127+ cells from the large intestine at 14 dpi (n = 4 or 7 mice). j. Quantification of ILC3 subsets in the large intestine at 14 dpi (n = 4 or 7 mice). k. Fecal CFU at 10 dpi (n = 5 mice). l. Flow plots and quantification of Th17 cells gated on FoxP3CD4+ T cells from the large intestine at 14 dpi (n = 5 mice). m. Quantification of IL-17A+ cells in CD4+ T cells from the large intestine at 14 dpi (n = 5 mice). n. Colon length at 14 dpi (n = 4 or 7 mice). o. H&E staining of the distal colon at 14 dpi. Data in b-n are representative of two or three independent experiments. Data are shown as the means ± S.E.M in b, c, e, g-k, m, n, and means ± S.D. in l. Statistics are calculated by two-tailed unpaired Student’s t-test in b, e, g-k, m, n, and two-tailed paired t-test in c. Scale bar: 100 μm.

Comment in

References

    1. Eberl G et al. An essential function for the nuclear receptor RORgamma(t) in the generation of fetal lymphoid tissue inducer cells. Nat Immunol 5, 64–73, doi:10.1038/ni1022 (2004). - DOI - PubMed
    1. Eberl G & Littman DR Thymic origin of intestinal alphabeta T cells revealed by fate mapping of RORgammat+ cells. Science 305, 248–251, doi:10.1126/science.1096472 (2004). - DOI - PubMed
    1. Ivanov II et al. The orphan nuclear receptor RORgammat directs the differentiation program of proinflammatory IL-17+ T helper cells. Cell 126, 1121–1133, doi:10.1016/j.cell.2006.07.035 (2006). - DOI - PubMed
    1. Ivanov II, Zhou L & Littman DR Transcriptional regulation of Th17 cell differentiation. Semin Immunol 19, 409–417, doi:10.1016/j.smim.2007.10.011 (2007). - DOI - PMC - PubMed
    1. Luci C et al. Influence of the transcription factor RORgammat on the development of NKp46+ cell populations in gut and skin. Nat Immunol 10, 75–82, doi:10.1038/ni.1681 (2009). - DOI - PubMed