. 2022 Sep;609(7926):408-415.
doi: 10.1038/s41586-022-04928-2. Epub 2022 Jul 13.

Structure-function analysis of the SHOC2-MRAS-PP1C holophosphatase complex

Affiliations

Structure-function analysis of the SHOC2-MRAS-PP1C holophosphatase complex

Jason J Kwon et al. Nature. 2022 Sep.

Abstract

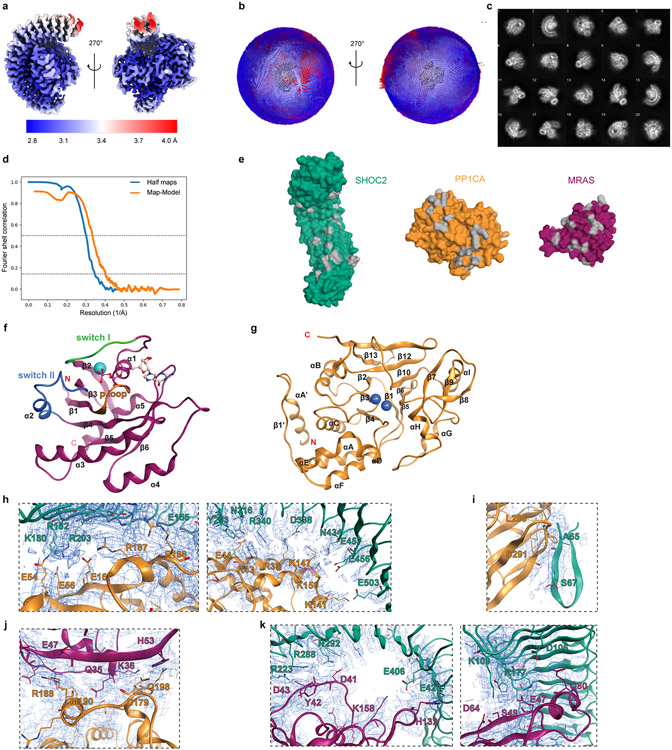
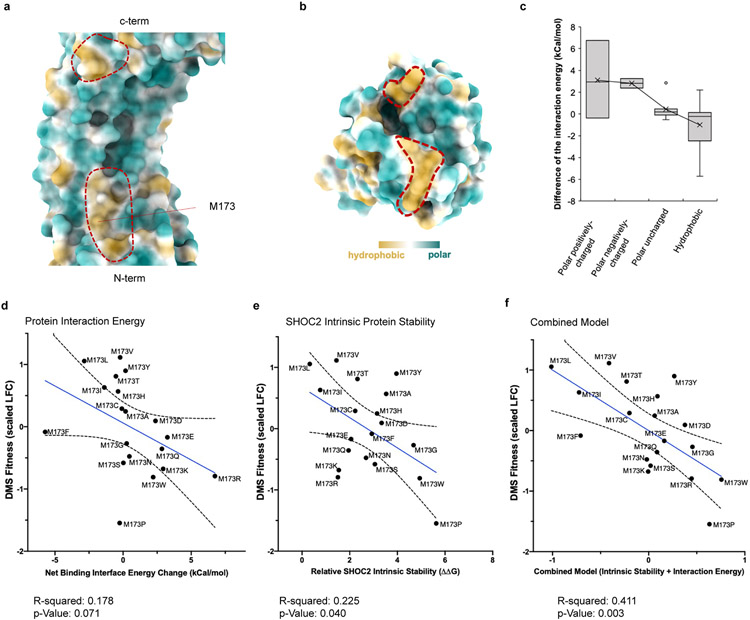
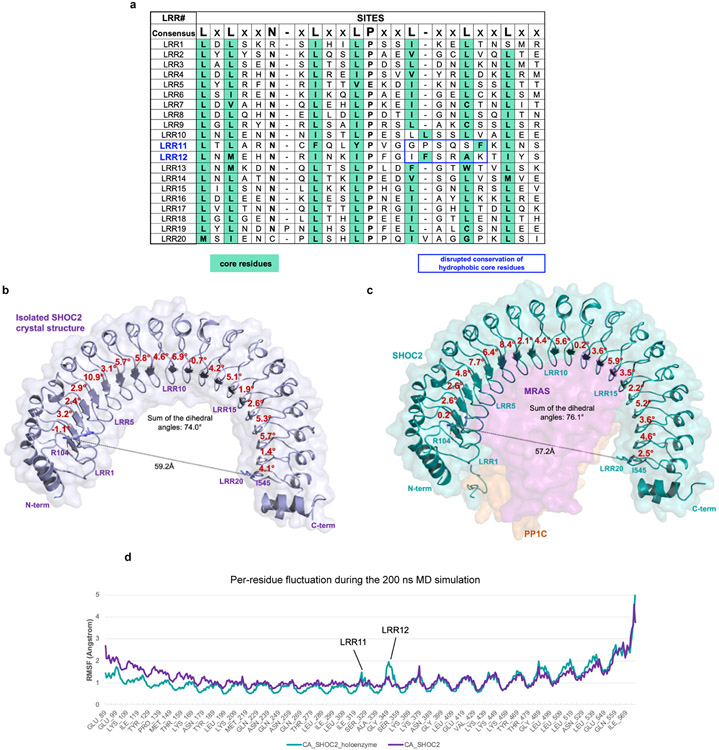
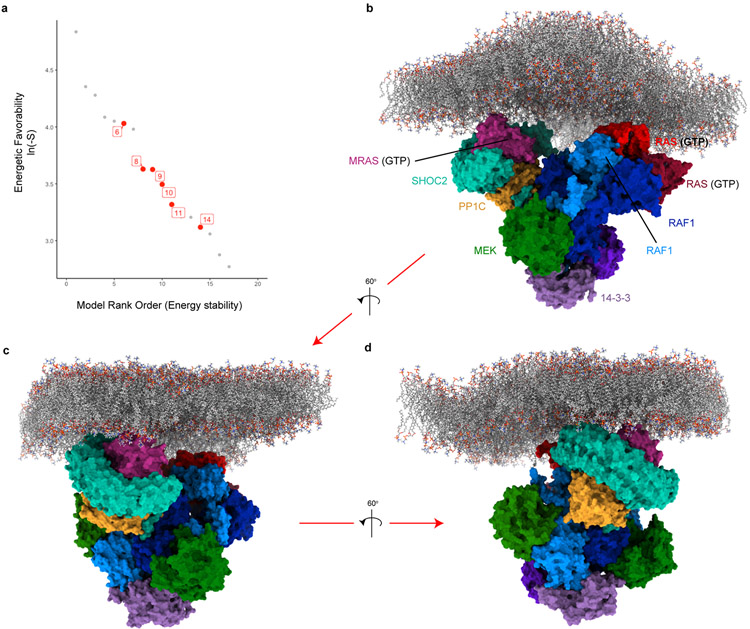
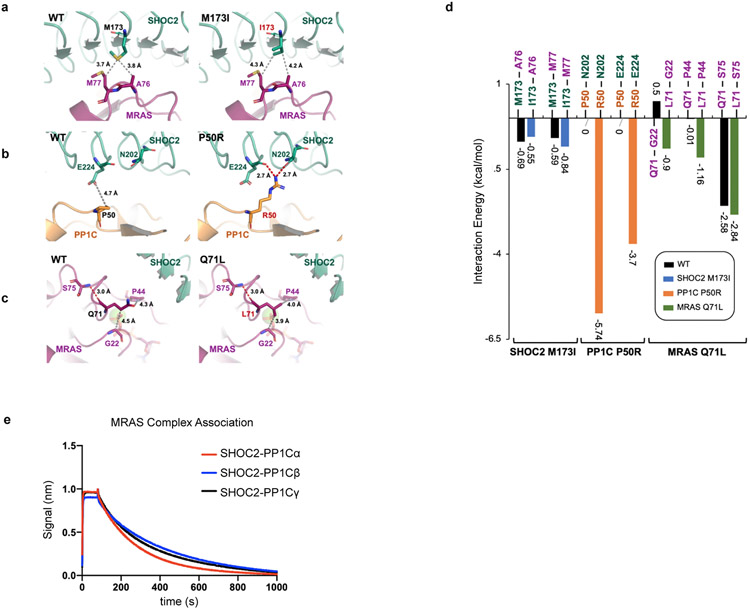
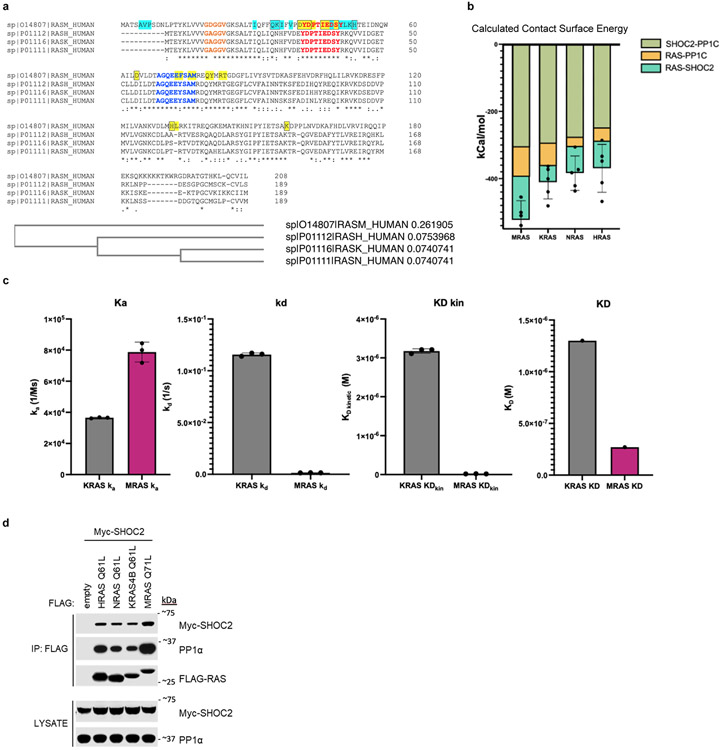
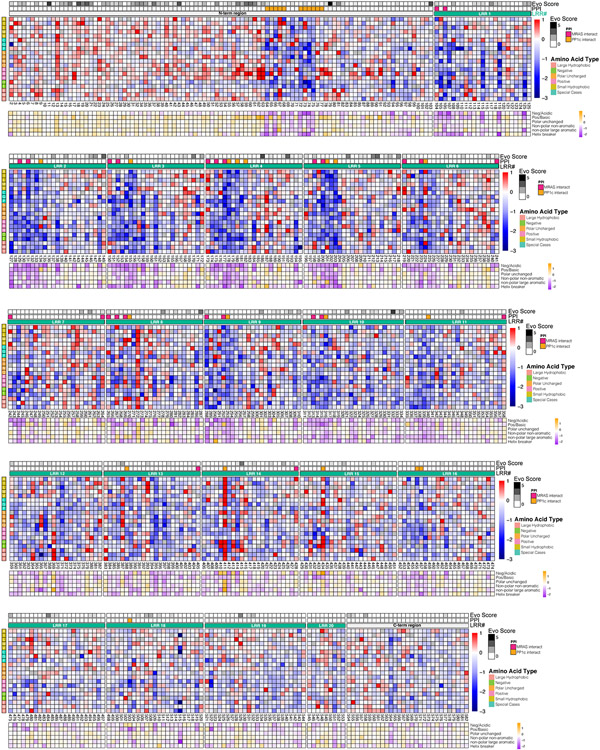
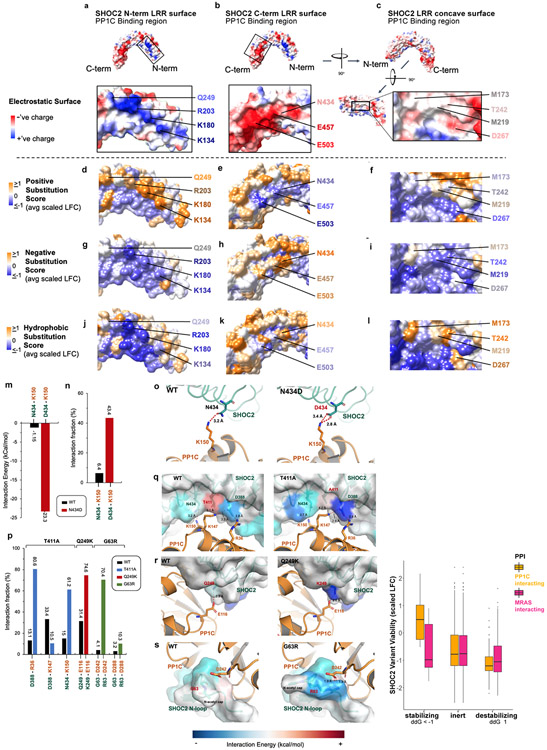
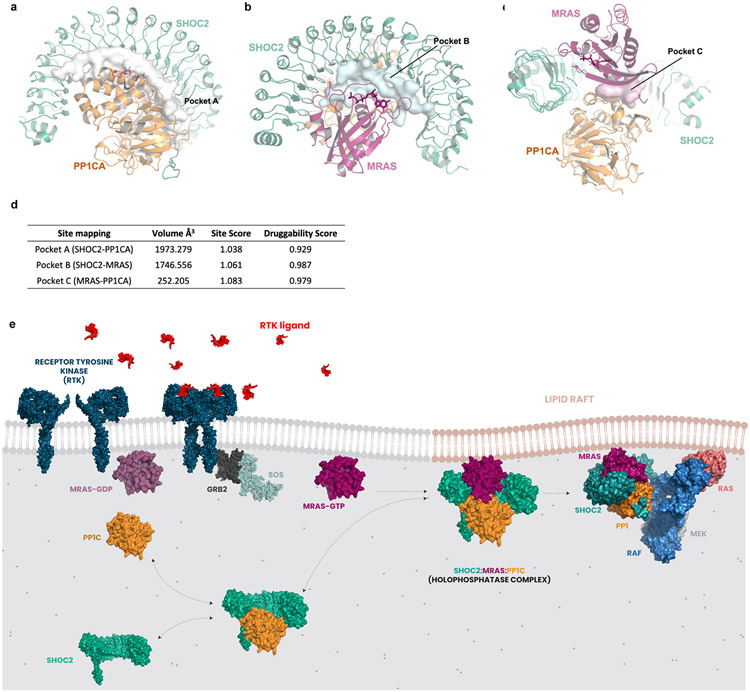
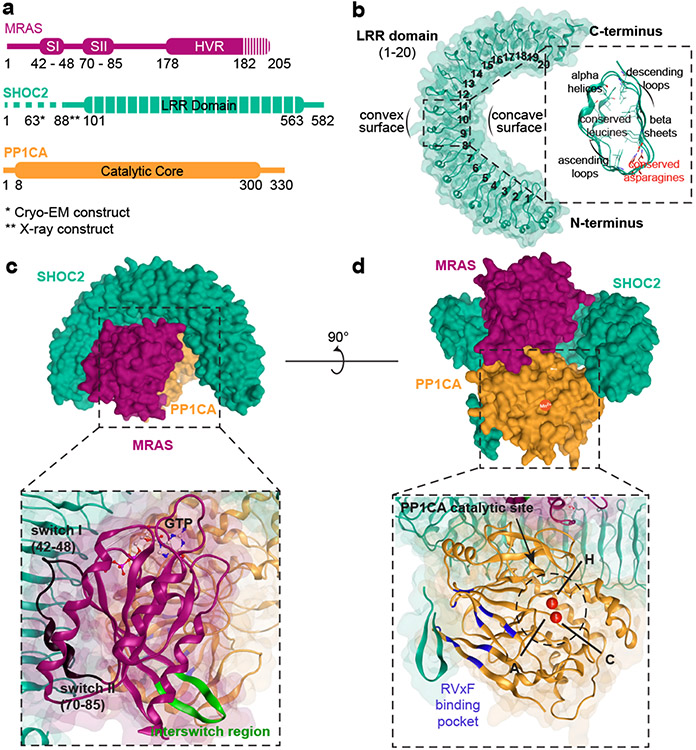
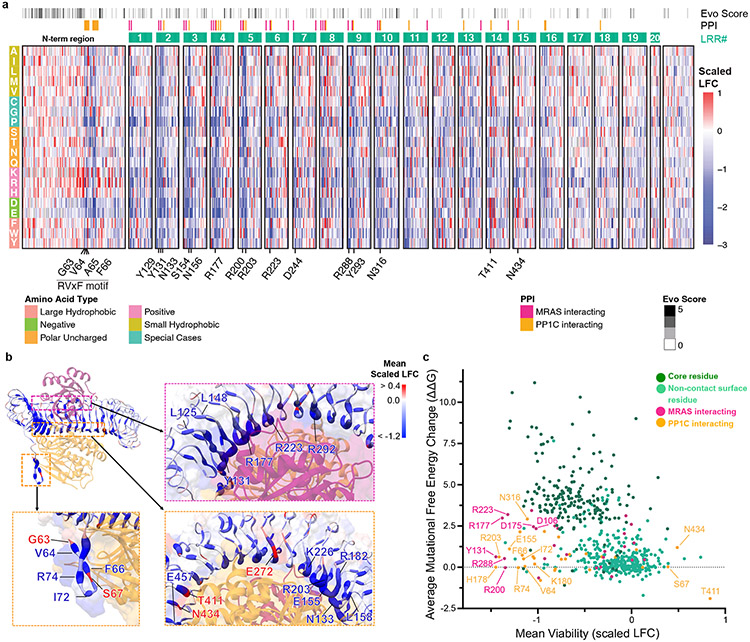
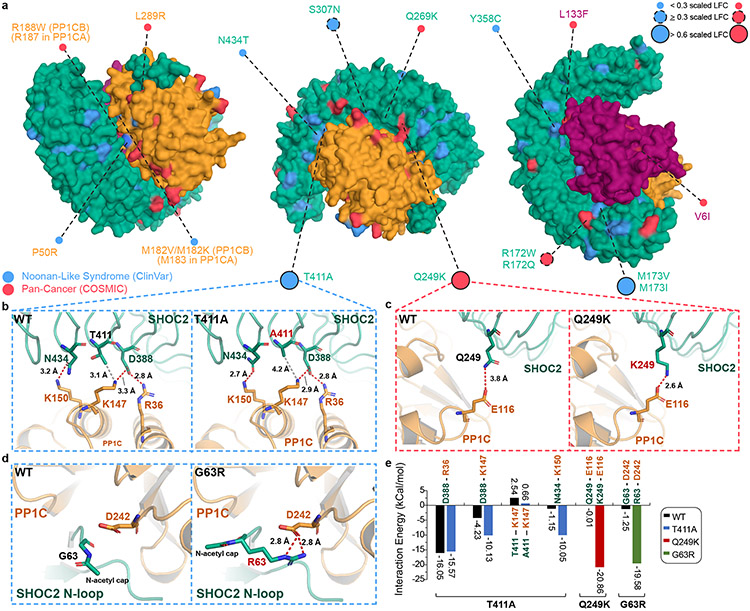
Receptor tyrosine kinase (RTK)-RAS signalling through the downstream mitogen-activated protein kinase (MAPK) cascade regulates cell proliferation and survival. The SHOC2-MRAS-PP1C holophosphatase complex functions as a key regulator of RTK-RAS signalling by removing an inhibitory phosphorylation event on the RAF family of proteins to potentiate MAPK signalling1. SHOC2 forms a ternary complex with MRAS and PP1C, and human germline gain-of-function mutations in this complex result in congenital RASopathy syndromes2-5. However, the structure and assembly of this complex are poorly understood. Here we use cryo-electron microscopy to resolve the structure of the SHOC2-MRAS-PP1C complex. We define the biophysical principles of holoenzyme interactions, elucidate the assembly order of the complex, and systematically interrogate the functional consequence of nearly all of the possible missense variants of SHOC2 through deep mutational scanning. We show that SHOC2 binds PP1C and MRAS through the concave surface of the leucine-rich repeat region and further engages PP1C through the N-terminal disordered region that contains a cryptic RVXF motif. Complex formation is initially mediated by interactions between SHOC2 and PP1C and is stabilized by the binding of GTP-loaded MRAS. These observations explain how mutant versions of SHOC2 in RASopathies and cancer stabilize the interactions of complex members to enhance holophosphatase activity. Together, this integrative structure-function model comprehensively defines key binding interactions within the SHOC2-MRAS-PP1C holophosphatase complex and will inform therapeutic development .


Figures

Extended Data Figure 1
Extended Data Figure 1. Cryo-EM map of the SHOC2 holophosphatase complex, surface model of contact surfaces and secondary structure annotations.
a, The cryo-EM map used for modeling the complex, colored according to local resolution using the color map shown. The map was sharpened by an automatically determined B-factor of −90.7922 Å2 and filtered to local resolution, both determined by the methods implemented in Relion. b, A 3D histogram of the angular distribution in the final particle set as determined during the final 3D map refinement. Both the size and color of the bins correspond to particle counts. The views are the same as shown in (a), with the map itself rendered in the center of the histograms in grey. c, Reference-free 2D class averages generated from the final particle set. d, The fourier shell correlation (FSC) for the independently refined half maps from the final 3D map refinement (blue), and the full map and atomic model (orange). The “gold standard” half-maps FSC was calculated and corrected for masking effects using Relion; the map-model FSC was calculated by Phenix using a mask around the model based on the 2.9 Å global resolution. FSC=0.5 and 0.143 thresholds are marked by dashed lines. The half-maps FSC crosses the 0.143 threshold at 2.8925 Å resolution, and the map-model FSC crosses the 0.5 threshold at 3.01 Å resolution. e, Surface model of unbound SHOC2, PP1CA, and MRAS. Grey indicates the interacting surfaces. f, MRAS cartoon representation with secondary structured labeled. g, PP1CA cartoon representation with secondary structured labeled. h, SHOC2 LRR and PP1C interactions i, SHOC2 N-term region and PP1C j, PP1C and MRAS k, SHOC2 LRR and MRAS shown in local electron density map corresponding to protein-protein interaction sites in Figure 4. SHOC2 is shown in teal, PP1CA in yellow and MRAS in magenta. The map (2Fo-Fc) is at 4.5 sigma.
Extended Data Figure 2
Extended Data Figure 2. 200ns MD simulation of the SHOC2 complex, cryo-EM maps of SHOC2 T411 and proximal interactions with PP1C, SHOC2 N-term region degenerate RVxF motif and PP1C RVxF binding pocket, and AUC analysis of PP1C pair-wise interactions with complex members.
a, An overview of the MD simulation system for the SHOC2 complex. b, Root-mean-square-deviation (RMSD) of the protein α-carbon throughout the simulation. c, Interaction fraction of contacting residue pairs between SHOC2 and PP1C. d, Interaction fraction of contacting residue pairs between SHOC2 and MRAS. e, Interaction fraction of contacting residue pairs between MRAS and PP1C. f, Local electron density map for T411 of SHOC2 (teal) and K147 of PP1CA (orange) and their neighboring residues (left) and SHOC2 N-terminal residues interacting with RVxF binding pocket of PP1c (right). The map (2Fo-Fc) is at 4.5 sigma. g, Sedimentation Velocity Analytical Ultracentrifugation (SV-AUC) analysis of PP1C binding to SHOC2 or MRAS-GppCp compared to PP1C alone, and with the presence of SHOC2 and MRAS-GppCp.
Extended Data Figure 3
Extended Data Figure 3. Surface view of SHOC2 M173 and in silico energy calculations of variant substitutions and correlation of intrinsic protein stability and interaction energies of SHOC2 M173 mutations with DMS functional scores.
Structural view of a, SHOC2 and b, MRAS with hydrophobicity (yellow) and polar (teal) surfaces colored, and red outlines indicate hydrophobic interaction surfaces. c, Box and whisker plot for calculated differences of SHOC2-MRAS interaction energy between wildtype M173 and models of variants. In silico mutagenesis modeling grouped based on their hydrophobicity and charge states: hydrophobic (n = 8 residue calculated energies: I, V, L, F, M, A, W, and P); polar uncharged group includes (n = 7 residue calculated energies: C, G, T, S, Y, N, and Q); polar negatively-charged (n = 2 residue calculated energies: D, and E); polar positively-charged (n = 3 residue calculated energies: H, K, and R). Center line represents median, whiskers represent the first and fourth quartiles, box edges represent the second and third quartiles. All other observed data points outside the boundary of the whiskers are plotted as outliers. Mean and outliers are shown in crosses and dots respectively. SHOC2 M173 variant fitness scores in the DMS screen are presented on the x-axes and d, calculated protein interaction energy between SHOC2 and complex members; e, impact on intrinsic protein stability; and f, combined multiple linear model (0.12*contact energy + 0.25*intrinsic protein stability − 0.75) are represented on the y-axes. Line (blue) represent linear regression model, 95% confidence interval of best fit line (dashed black lines), R2 (goodness of fit), and linear model p-value (analysis of regression coefficient significantly non-zero) indicated.
Extended Data Figure 4
Extended Data Figure 4. The comparison of crystal SHOC2 and the SHOC2 in the Cryo-EM holoenzyme.
a, Primary sequence analysis of highly conserved SHOC2 LRRs with consensus sequence indicated above. The canonical highly conserved leucine-rich repeat motif is indicated above; boxes of hydrophobic residues based on structure data (teal); and disruption in core hydrophobic core residues within LRR11 and LRR12 are indicated (blue box). b, Measurements of dihedral angles between each two neighboring LRRs (red text) and the distance between alpha carbons of R104 at LRR1 and I545 on LRR20 for crystal SHOC2 (indicated by line), and c, the SHOC2 in the Cryo-EM holoenzyme. d, Per-residue fluctuation reflected from 200ns MD simulations for crystal SHOC2 and SHOC2-MRAS-PP1C holoenzyme.
Extended Data Figure 5
Extended Data Figure 5. In Silico modeling of SHOC2 complex interaction with RAS-RAF dimeric multimer unit.
a, Rank order of 17 established models with preferred van der Waals, electrostatic, and solvation energies (natural log of negative S-score) were manually annotated for spatial accommodation of RAS members to be oriented/embedded within a plasma membrane (indicated red dots). The top energetically favorable model that accommodates RAS orientation within the membrane (model 6) was selected. b, Structural model of SHOC2 complex interacting with dimeric multimer unit (2x RAS, 2x RAF, 2x MEK, and 2x 14-3-3) is presented with c & d, additional rotational views of the docked complex. Individual protein units are colored and labeled.
Extended Data Figure 6
Extended Data Figure 6. In silico modeling and energy calculation for SHOC2 M173I, PP1C P50R, and MRAS Q71L mutations and evaluation of PP1C isoforms in MRAS Complex Association.
a, Zoom-in views for SHOC2 M173 and modeled M173I mutation with distance measurement to contacting residues on MRAS. b, Zoom-in views for PP1C P50 and modeled P50R mutation with distance measurement to contacting residues on SHOC2. c, Zoom-in views for MRAS Q71 and modeled Q71L mutation with distance measurement to surrounding residues. d, Predicted interaction energy for the WT and mutated residues. e, Sedimentation Velocity Analytical Ultracentrifugation (SV-AUC) analysis of SHOC2 holoenzyme with PP1C isoforms (PP1Cα/β/γ) formation in the presence of MRAS-GppCp. Line trace of 1 technical replicate, representative of 3 biological replicates.
Extended Data Figure 7
Extended Data Figure 7. Evaluation of RAS isoforms in context of SHOC2 holophosphatase complex formation.
a, Multiple sequence alignment analysis (EMBL-EBI ClustalW) of RAS isoforms (MRAS, KRAS, HRAS, NRAS). Switch I (red), Switch II (blue), and P-loop (orange) are annotated. MRAS residues that interact with PP1C (cyan highlighted) and SHOC2 (yellow highlighted) are boxed if they contribute ≤ −1.5kcal/mol of calculated paired interaction. b, Mean interaction energy calculated through molecular dynamic simulation of RAS isoforms (n = average of 5 representative frames/RAS isoform) and error bars represent standard deviation of the mean. c, BLI experimentation of MRAS and KRAS complex with activated SHOC2-PP1C. Mean (n= 3 technical replicates, representative of 3 independent experiments) for binding constants (Ka, kd, KD kin) and error bars (standard deviation) are presented. d, Immunoprecipitation of various exogenously expressed oncogenic RAS isoforms from 293T cells co-transfected with FLAG-tagged RAS and Myc-tagged SHOC2 (representative of 3 biological replicates).
Extended Data Figure 8
Extended Data Figure 8. High resolution heatmap of SHOC2 DMS screen.
High resolution heat map representation of log2-fold change (LFC) allele enrichment and depletion between trametinib treatment and vehicle control, centered on mean of wildtype (silent mutants) and scaled to mean of nonsense mutants (scaled LFC), providing relative enrichment (red) vs depletion (blue) relative to SHOC2 WT. SHOC2 positional evolutionary sequence variation (Evo Score; higher value = less conserved) and protein-protein interacting residues (PPI) from cryo-EM data are indicated (Methods). An additional heatmap is provided below which depicts the average scaled LFC score of residues that have been grouped according to biophysical characteristics (orange = GOF; purple = LOF), including negative-charge (D/E), positive-charge (K/R), and hydrophobic (G/A/V/L/I/M), polar uncharged (S/T/C/Y/N/Q), non-polar large aromatic (F/W/Y/H) and helix breaker (P/G).
Extended Data Figure 9
Extended Data Figure 9. Analysis of mutational tolerance of SHOC2 residues based on deep mutational scanning and residue contact points within SHOC2 complex, Impact of SHOC2 variants on growth in low attachment, and Impact of SHOC2 variants on MAPK signaling, and Impact of SHOC2 variants on MAPK signaling in response to MEK inhibition.
a, Violin plot of SHOC2 mean positional viability for surface contacting residues between complex members, PP1C (green, n = 28 positions) and MRAS (maroon, n = 26 positions), compared to core-residues (brown, n = 198 positions) and surface non-contacting residues (yellow, n = 329). Center line represents median, whiskers represent the first and fourth quartiles, box edges represent the second and third quartiles. b, MIA PaCa-2 with knock-out of endogenous SHOC2 and stably re-expressing various SHOC2 gain-of-function (red) and loss-of-function (blue) variants were seeded in ultra-low attachment plates and cultured for 7 days. Viability endpoint via cell titer glow is presented on x-axis along scaled LFC from fitness screen with PaTu-8902. Error bars represent standard deviation of GILA CTG viability (n=6 technical replicates; representative of 3 biological replicates). Line (green) represent simple linear regression model, 95% confidence interval (black dashed lines), R2 (goodness of fit), and linear model p-value < 0.0001 (analysis of regression coefficient significantly non-zero) indicated. c, Wild type (WT) and gain- or loss-of-function (GOF/LOF) variants were stably expressed in KRAS mutant cell line MIA PaCa-2 with knock-out of endogenous SHOC2. d, Densitometry quantification of P-S259 RAF1 relative to total RAF1 and normalized to levels from wildtype expressing cells. Center line represents median and whiskers represent interquartile range. ***p<0.001, two-sided t-test between LOF (n = 5 variants) and GOF (n = 6 variants) SHOC2 alleles, representative of 3 biological replicates. e, Wild type (WT) and gain- or loss-of-function (GOF/LOF) variants were stably expressed in KRAS mutant cell line MIA PaCa-2 with knock-out of endogenous SHOC2. Cells were treated with the MEK1/2 inhibitor trametinib (10nM) for 24 hours prior to Western blot. f, Densitometry quantification of P-S259 RAF1 relative to total RAF1 and normalized to levels from wildtype expressing cells. Center line represents median and whiskers represent interquartile range. ***p<0.001, two-sided t-test between LOF (n = 6 variants) and GOF (n = 6 variants) SHOC2 alleles, representative of 3 biological replicates. g, Immunoprecipitation of V5-tagged SHOC2 variants in 293T cells co-transfected with HA-MRAS. h, Densitometry analysis of relative prey including endogenous PP1CB (yellow) and MRAS (maroon) normalized to V5 bait (y-axis) and DMS fitness score (LFC Z-score) (x-axis). Lines represent simple linear regression model, R2 (goodness of fit), and linear model p-value < 0.0001 (analysis of regression coefficient significantly non-zero) indicated, representatitve of 3 biological replicates. i, Deep mutational scanning results for N-terminal region of SHOC2 (residues 60-68) depicted via sequence logo plot per amino acid substitution at respective positions (ggseqlogo).
Extended Data Figure 10
Extended Data Figure 10. Functional consequence of mutations in SHOC2 LRR surface based on biophysical attributes of amino acid substitutions, In silico mutagenesis study of N434D, 200ns MD simulations for SHOC2 T411A, Q249K, and G63R mutations.
Three major regions of SHOC2 LRR that mediated complex member binding: (1) C-term PP1C binding region - left; (2) N-term PP1C binding region - middle; (3) Concave MRAS binding surface - right are presented in columns. Electrostatic surface depiction of SHOC2 (red = negative; blue = positive) for a & b, SHOC2 LRR region surfaces that bind PP1C and c, MRAS are presented (1st row), along with select protein-protein interacting residues of SHOC2 labeled. Subsequently, the SHOC2 Deep Mutational Scanning (DMS) screen functional score (Scaled LFC) was averaged for every surface residue of SHOC2 based on the biophysical characteristics of substituted residues at each given surface position and projected onto the SHOC2 surface with colorimetric scale (orange = GOF; purple = LOF). The average functional impact (mean scaled LFC) of positively charged residues (K/R) are presented (2nd row) for d, C-term PP1C binding region - left; e, N-term PP1C binding region - middle; f, Concave MRAS binding surface – right. The average functional impact of negatively charged residues (D/E) are presented (3rd row) for g, C-term PP1C binding region - left; h, N-term PP1C binding region - middle; i, Concave MRAS binding surface – right. The average functional impact of hydrophobic residues - non-polar, non-aromatic (G/A/V/L/I/M) are presented (4th row) for j, C-term PP1C binding region - left; k, N-term PP1C binding region - middle; l, Concave MRAS binding surface. m, Predicted interaction energy towards the K150 on PP1C for the SHOC2 WT and N434D mutation. n, Interaction fraction of contacting residue pairs for WT and the N434D mutation during the 200ns MD simulation. Zoom-in views for SHOC2 N434 o, and modeled N434D mutation with distance measurement to PP1C K150. p, Interaction fraction of contacting residue pairs for WT and mutations. r, Zoom-in views for SHOC2 T411 and modeled T411A mutation with distance measurement to contacting residues on PP1C. s, Zoom-in views for SHOC2 Q249 and modeled Q249K mutation with distance measurement to contacting residues on PP1C. t, Zoom-in views for modeled SHOC2 G63 and modeled G63R mutation with distance measurement to contacting residues on PP1C. The calculated interaction energy is colored to the SHOC2 protein surface for visualization. u, Boxplot of SHOC2 variants with mutations at protein interaction sites that are stabilizing (ddG ≤ −1), inert (ddG: >−1 and <1), destabilizing (ddG ≥ 1) by FoldX computations. Center line represents median, whiskers represent the first and fifth quartiles, box edges represent the second and fourth quartiles of SHOC2 variants with mutations in residues interacting with PP1C that are stabilizing (n = 18 variants), inert (n = 912 variants), destabilizing (n = 134 variants) or interacting with MRAS that are stabilizing (n = 13 variants), inert (n = 779 variants), and destabilizing (n = 196 variants) that were functionally evalulated in the DMS screen.
Extended Data Figure 11
Extended Data Figure 11. Druggability analysis of SHOC2 holophosphatase complex and schematic diagram of proposed model for SHOC2 holophosphatase complex assembly.
a, SiteMap analysis of SHOC2 complex identifying druggable binding pockets between SHOC2-PP1C, b, SHOC2-MRAS and c, PP1C-MRAS. d, SiteScore is capped at 1.0 to limit the impact of hydrophilicity in charged and highly polar sites. A SiteScore of 0.80 has been found to accurately distinguish between drug-binding and non-drug-binding sites. For Dscore, the hydrophilic score is not capped. This one of the keys for distinguishing “difficult” and “undruggable” targets from “druggable” ones. e, Hypothesized model of the SHOC2 holophosphatase complex. MRAS is GDP bound and PP1C and SHOC2 exist in bound/unbound equilibrium in cytoplasm. Upon RTK stimulation and MRAS-GTP activation, the SHOC2-PP1C complex binds with MRAS at the plasma membrane to produce stable complex formation, and likely localizes the SHOC2 holophosphatase to lipid domains with concentrated RAS-bound RAF1 to dephosphorylate ‘S259’ on RAF and enable MAPK signaling.
Figure 1:
Figure 1:. Structure of apo-SHOC2 and SHOC2-MRAS-PP1C holophosphatase complex.
a. Schematic diagram of complex members. Truncation of constructs is indicated in dashed lines. *Indicates 2-88 deletion SHOC2 construct utilized for X-ray crystallography and **2-63 deletion construct for cryo-EM. b. Overview of apo-SHOC2 crystal structure along with cross-sectional representation of LRR domain. c & d. Side views of Cryo-EM structure of SHOC2 complex with SHOC2 (teal), MRAS (maroon), and PP1C (yellow). A ribbon representation and view of MRAS (c) and PP1C (d) with relevant structural features annotated. d. Manganese ions (red), Hydrophobic (H), C-terminal (C), and Acidic (A) grooves are shown.
Figure 2:
Figure 2:. Detailed contacts between ternary SHOC2 complex members informs mechanism of assembly.
a. Enlarged images show surface contacting residues between SHOC2 LRR domains and PP1C (top left and middle) or MRAS (bottom), and residues of SHOC2 unstructured N-terminus contacting PP1C (top right). b. Energy contribution of key contact-residues between complex members (bars) and cumulative energy of interaction interface by Amber10 force field-based energy calculation (red line). c. Conformational comparison of MRAS switch I ‘open’ and ‘closed’ confirmation. d. Sedimentation Velocity Analytical Ultracentrifugation (SV-AUC) analysis of SHOC2-MRAS-PP1C holoenzyme formation in the presence of MRAS-GDP (red line) MRAS-GppCp (blue line). Line trace represents n = 1 technical replicate and is representative of 3 biological replicates. Bio-Layer Interferometry (BLI) analysis of SHOC2 complex order of assembly for apo-SHOC2 with MRAS-GTP and PP1C (e) and SHOC2-PP1C activated engagement of MRAS-GTP binding (f). Line traces represents n = 1 technical replicate and is representative of 2 biological replicates. g. Schematic diagram of proposed model for SHOC2-MRAS-PP1C holophosphatase complex assembly whereby SHOC2 (teal) and PP1C (yellow) first engage in binding followed by MRAS-GTP (maroon) to stabilize and slow down dissociation of the complex. AUC and BLI experiments were repeated two or more times and representative is shown.
Figure 3:
Figure 3:. Systematic deep mutational scanning (DMS) reveals structural constraints of SHOC2 complex function.
a. Heat map representation of log2-fold change (LFC) allele enrichment (red) and depletion (blue) between trametinib treatment and vehicle control, centered on SHOC2 wildtype (silent) and normalized to the mean of non-sense mutations (scaled LFC). SHOC2 positional evolutionary sequence variation (Evo Score) and protein-protein interacting residues (PPI) from cryo-EM data are indicated. b. Projections of observed DMS allele abundance on N-terminal unstructured region (bottom left), and MRAS (top right) and PP1C interface (bottom right) onto Cryo-EM structure. Color indicates mean positional Scaled LFC in the DMS fitness screen and size of residue indicates number of variants that score as GOF/LOF. c. Scatter plot showing position-level calculated, mean free-energy change upon mutation (intrinsic SHOC2 stability) and corresponding average scaled LFC for fitness in the SHOC2 DMS screen, with higher ddG values correspond to greater instability. Positive DMS scaled LFC: positive selection, GOF. Negative DMS Z-score: negative selection, LOF.
Figure 4:
Figure 4:. Structure-function analysis identifies disease-associated mutations.
a. Clinical missense mutations of SHOC2 complex members in Noonan-like Syndrome (NL-S) (ClinVar) and cancer (COSMIC database) with interface mutant alleles annotated. Lollipop size of interface mutants is proportional to DMS scaled LFC. b-c. Dynamic change in interaction surface between SHOC2 and PP1C in WT and novel NL-S (SHOC2 T411A) (b) or cancer associated mutations (SHOC2 Q249K) (c). d. Modeling of anticipated GOF G63R SHOC2 mutant. e. Contact surface energy of SHOC2 complex for novel functional pathogenic variants SHOC2 T411A, Q249K, and G63R, as predicted by Amber10 force field-based energy calculation.

Comment in

References

    1. Rodriguez-Viciana P, Oses-Prieto J, Burlingame A, Fried M & McCormick F A phosphatase holoenzyme comprised of Shoc2/Sur8 and the catalytic subunit of PP1 functions as an M-Ras effector to modulate Raf activity. Mol. Cell 22, 217–230 (2006). - PubMed
    1. Cordeddu V et al. Mutation of SHOC2 promotes aberrant protein N-myristoylation and causes Noonan-like syndrome with loose anagen hair. Nat. Genet 41, 1022–1026 (2009). - PMC - PubMed
    1. Higgins EM et al. Elucidation of MRAS-mediated Noonan syndrome with cardiac hypertrophy. JCI Insight 2, e91225 (2017). - PMC - PubMed
    1. Gripp KW et al. A novel rasopathy caused by recurrent de novo missense mutations in PPP1CB closely resembles Noonan syndrome with loose anagen hair. Am. J. Med. Genet. A 170, 2237–2247 (2016). - PMC - PubMed
    1. Ma L et al. De novo missense variants in PPP1CB are associated with intellectual disability and congenital heart disease. Hum. Genet 135, 1399–1409 (2016). - PMC - PubMed

MeSH terms