. 2022 Dec;29(12):2519-2530.
doi: 10.1038/s41418-022-01037-5. Epub 2022 Jul 13.

Epigenetic modulators of B cell fate identified through coupled phenotype-transcriptome analysis

Affiliations

Epigenetic modulators of B cell fate identified through coupled phenotype-transcriptome analysis

Isabella Y Kong et al. Cell Death Differ. 2022 Dec.

Abstract

High-throughput methodologies are the cornerstone of screening approaches to identify novel compounds that regulate immune cell function. To identify novel targeted therapeutics to treat immune disorders and haematological malignancies, there is a need to integrate functional cellular information with the molecular mechanisms that regulate changes in immune cell phenotype. We facilitate this goal by combining quantitative methods for dissecting complex simultaneous cell phenotypic effects with genomic analysis. This combination strategy we term Multiplexed Analysis of Cells sequencing (MAC-seq), a modified version of Digital RNA with perturbation of Genes (DRUGseq). We applied MAC-seq to screen compounds that target the epigenetic machinery of B cells and assess altered humoral immunity by measuring changes in proliferation, survival, differentiation and transcription. This approach revealed that polycomb repressive complex 2 (PRC2) inhibitors promote antibody secreting cell (ASC) differentiation in both murine and human B cells in vitro. This is further validated using T cell-dependent immunization in mice. Functional dissection of downstream effectors of PRC2 using arrayed CRISPR screening uncovered novel regulators of B cell differentiation, including Mybl1, Myof, Gas7 and Atoh8. Together, our findings demonstrate that integrated phenotype-transcriptome analyses can be effectively combined with drug screening approaches to uncover the molecular circuitry that drives lymphocyte fate decisions.


Conflict of interest statement

The Johnstone laboratory (SJV and RWJ) has received project support from AstraZeneca, Roche, MecRx, and BMS. RWJ is a paid consultant and shareholder of MecRx.

Figures
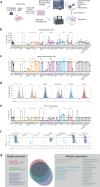
Fig. 1
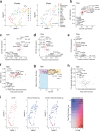
Fig. 1. Flow cytometry analysis identifies B cell parameters affected by epigenetic modifying compounds.
a Experimental workflow. CTV-labeled naïve murine B cells were cultured in LPS and treated with various compounds(1 µM). Half of the culture was harvested for flow cytometry analysis and transcriptome analysis was performed on 5000 cells per condition at 24 hr and 72 hr. b Total cell number and c mean division number at 72 hr post culture. d Representative CTV profiles for YKL-5-124, JQ1, A485, Vorinostat, GSK503 and ML324. Untreated controls are in gray. e Percentage of CD138+ cells at 72 hr. f Representative plots of CD138 expression for untreated, YKL-5-124, JQ1, A485, Vorinostat, GSK503 and ML324. g Summary on the effect of compounds on parameters measured by flow cytometry. Data in d, f are representative of two independent replicates. Significant differences in b, c, e were determined using ANOVA Bonferroni corrections. *p ≤ 0.05, **p ≤ 0.01, ***p ≤ 0.001, ****p ≤ 0.0001.
Fig. 2
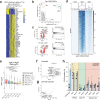
Fig. 2. MAC-seq analysis determines transcriptome changes due to epigenetic modifying compounds.
CTV-labeled naïve murine B cells were cultured in LPS and treated with various compounds(1 µM). Transcriptome analysis was performed on 5000 cells per condition at 24 hr and 72 hr. a UMAP plot for transcriptome data at 72 hr. b Expression of CD138 and ASC signature genes at 72 hr. Correlation between CD138 and fraction of (c) plasmablasts, (d) activated B cells and e naïve B cells at 72 hr determined using Cibersortx. f Total cell number and ASC signature at 72 hr. g CD138 expression and mean division number from Fig. 1 at 72 hr. h Total cell number and pro-apoptotic gene signature at 72 hr. i UMAP plots highlighting CD138 expression, total cell number (log) and CD138 and total cell number (log) overlapped. Each dot on the UMAP plot represents a compound. Red dots in (i) indicate high expression of CD138. Blue dots in i indicate high total cell number. Purple dots in i indicate high expression of both CD138 and total cell number. ASC signature in b, f was obtained from GSE60927.
Fig. 3
Fig. 3. In vitro and in vivo validation for flow cytometry data for Ezh2 inhibitors.
a CD138 expression and b Blimp1-GFP expression murine B cells 72 hr post-stimulation with LPS and indicated concentrations of GSK126. c C57BL/6 mice were immunized with NPKLH-Alum and treated with doses of GSK126 as indicated. Spleen and serum samples were analyzed 14 days after immunization. Proportion and total cell number normalized to the spleen for d, e antigen-specific IgG1 and f, g antigen-specific ASC. h Total antibody and i high-affinity antibody measured. j Total antibody secreting cells and k area of spots detected on ELISpot quantified. l Representative wells of ELISpot. m Representative images of GC. CD3: T cell zone B220 and IgD: B cell zone; GL-7: germinal center; Vehicle, n = 5, 5 mg/kg/day GSK126 treated group, n = 4, 10 mg/kg/day and 20 mg/kg/day GSK126 treated groups, n = 5. Bars in m represents 100 µm. Data in a, b are representative plots from triplicate samples. Error bars mean±s.e.m. Blinded analysis on germinal centre was performed. All data are representative of three independent experiments. Significant differences were determined using ANOVA with Bonferroni corrections. *p ≤ 0.05, **p ≤ 0.01, ***p ≤ 0.001, ****p ≤ 0.0001.
Fig. 4
Fig. 4. RNA-seq and ChIP-seq to validate MAC-seq data for Ezh2 inhibitors and identifying gene targets of Ezh2 inhibitors.
3’ RNA-Seq was performed on LPS stimulated murine B cells at indicated time points and concentrations of GSK126. a Gene expression of DEGs for 0µMvs4µM GSK126 at 71 hr with cut-off values of adj p-value ≤ 0.01 and logFC ≥ 1 or ≤ −1. b MDS plot for indicated time points and concentrations of GSK126. c Volcano plots showing DEGs for 0 µM vs 4 µM and 0µ M vs 8 µM at 71 hr. GSEA analysis of 0 µM vs 4 µM and 0 µM vs 8 µM at 71 hr compared to ASC gene signature (GSE60927). ChIP-sequencing was performed to examine the H3K27me3 occupancy upon treatment with GSK126. d H3K27me3 occupancy at TSS regions at 72 hr for untreated and 4 µM GSK126 treated samples. e Changes in RNA expression for all genes upon 8 µM GSK126 treatment. Groups are separated based on changes in H3K27me3 upon GSK126 treatment (8 µM). High down indicates logFC < −2. Mid down indicates logFC ≥ −2 and < −1. Low down indicates logFC ≥ −1 and <0. Low up indicates logFC>0 ≤ 1. Mid up indicates logFC>1 and ≤2. High up indicates logFC > 2. f Genes that result in an increase in ASC differentiation upon deletion. g Genes that abolishes GSK126-mediated ASC differentiation upon deletion. h CD138 expression for B cells deleted for the indicated genes for untreated and 4 µM GSK126 treated. Significant differences in e were determined using Wilcoxon test. *p ≤ 0.05, ***p ≤ 0.001, ****p ≤ 0.0001.

References

    1. Trezise S, Nutt SL. The gene regulatory network controlling plasma cell function. Immunol Rev. 2021;303:23–34. - PubMed
    1. Nebbioso A, Tambaro FP, Dell’Aversana C, Altucci L. Cancer epigenetics: Moving forward. PLoS Genet. 2018;14:e1007362. doi: 10.1371/journal.pgen.1007362. - DOI - PMC - PubMed
    1. Heerboth S, Lapinska K, Snyder N, Leary M, Rollinson S, Sarkar S. Use of epigenetic drugs in disease: an overview. Genet Epigenet. 2014;6:9–19. doi: 10.4137/GEG.S12270. - DOI - PMC - PubMed
    1. Yee AJ, Raje NS. Panobinostat and Multiple Myeloma in 2018. Oncologist. 2018;23:516–7. doi: 10.1634/theoncologist.2017-0644. - DOI - PMC - PubMed
    1. Waibel M, Christiansen AJ, Hibbs ML, Shortt J, Jones SA, Simpson I, et al. Manipulation of B-cell responses with histone deacetylase inhibitors. Nat Commun. 2015;6:6838. doi: 10.1038/ncomms7838. - DOI - PubMed

Publication types

Substances