. 2022 Aug 15;149(16):dev200312.
doi: 10.1242/dev.200312. Epub 2022 Aug 15.

Integrated analysis of Wnt signalling system component gene expression

Affiliations

Integrated analysis of Wnt signalling system component gene expression

Paula Murphy et al. Development. .

Abstract

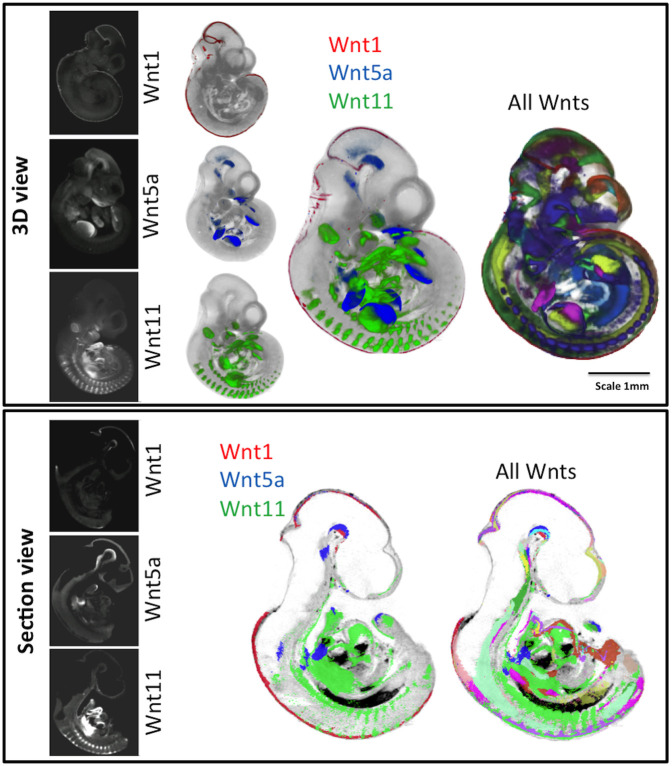
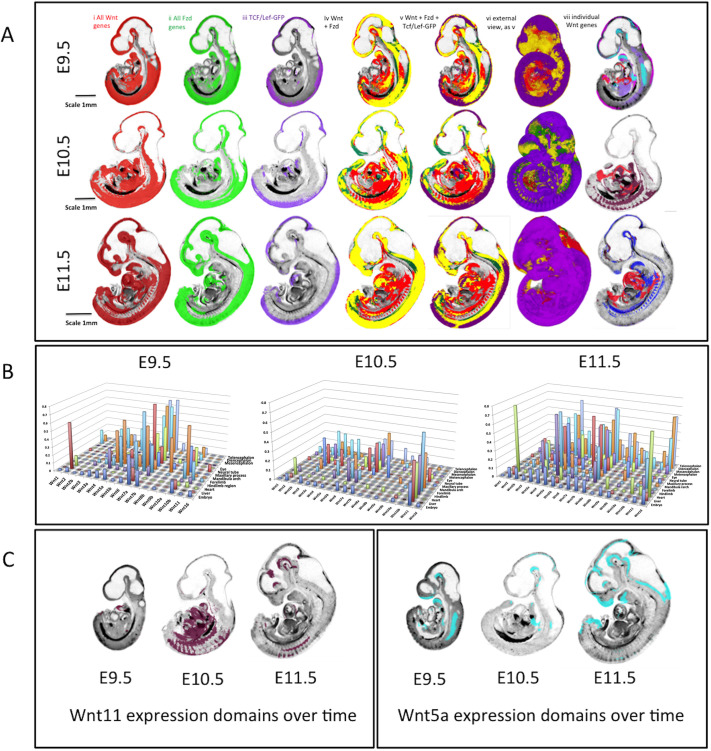
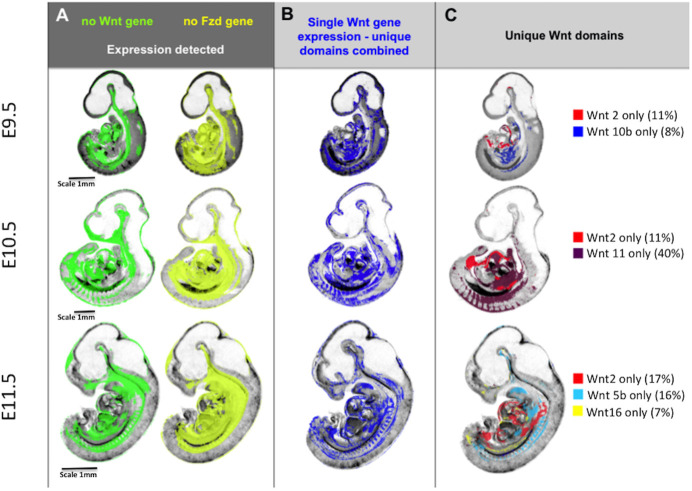
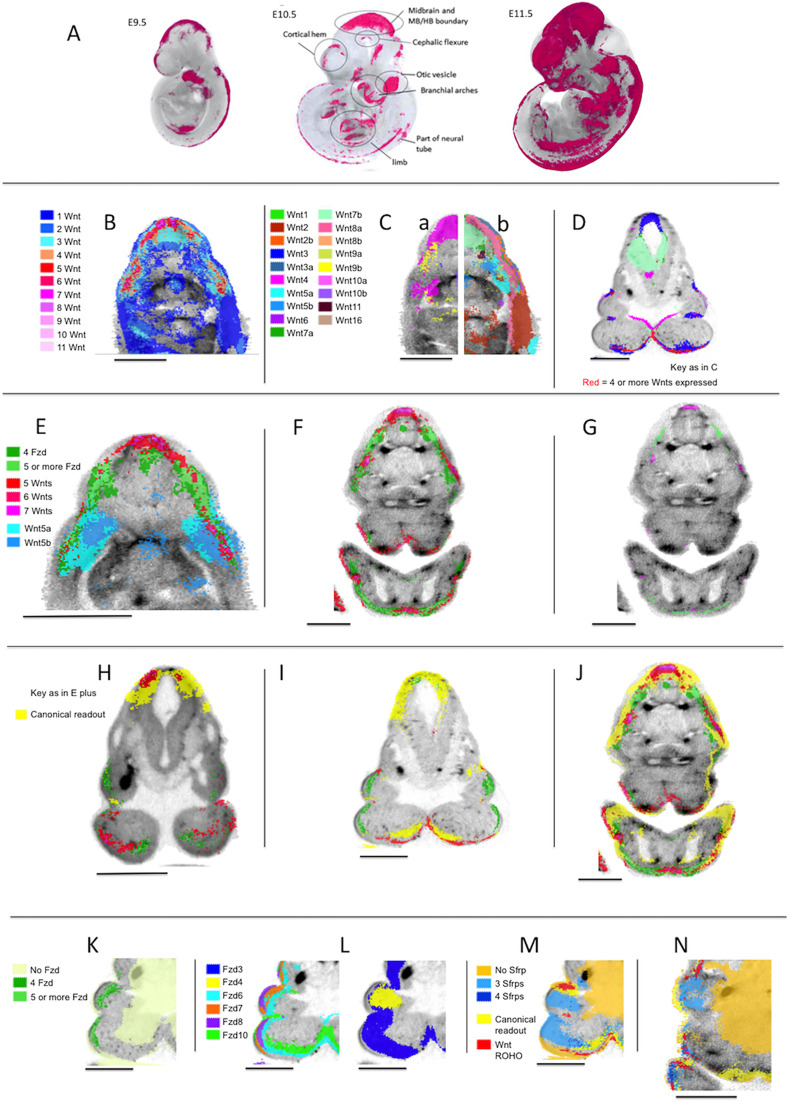
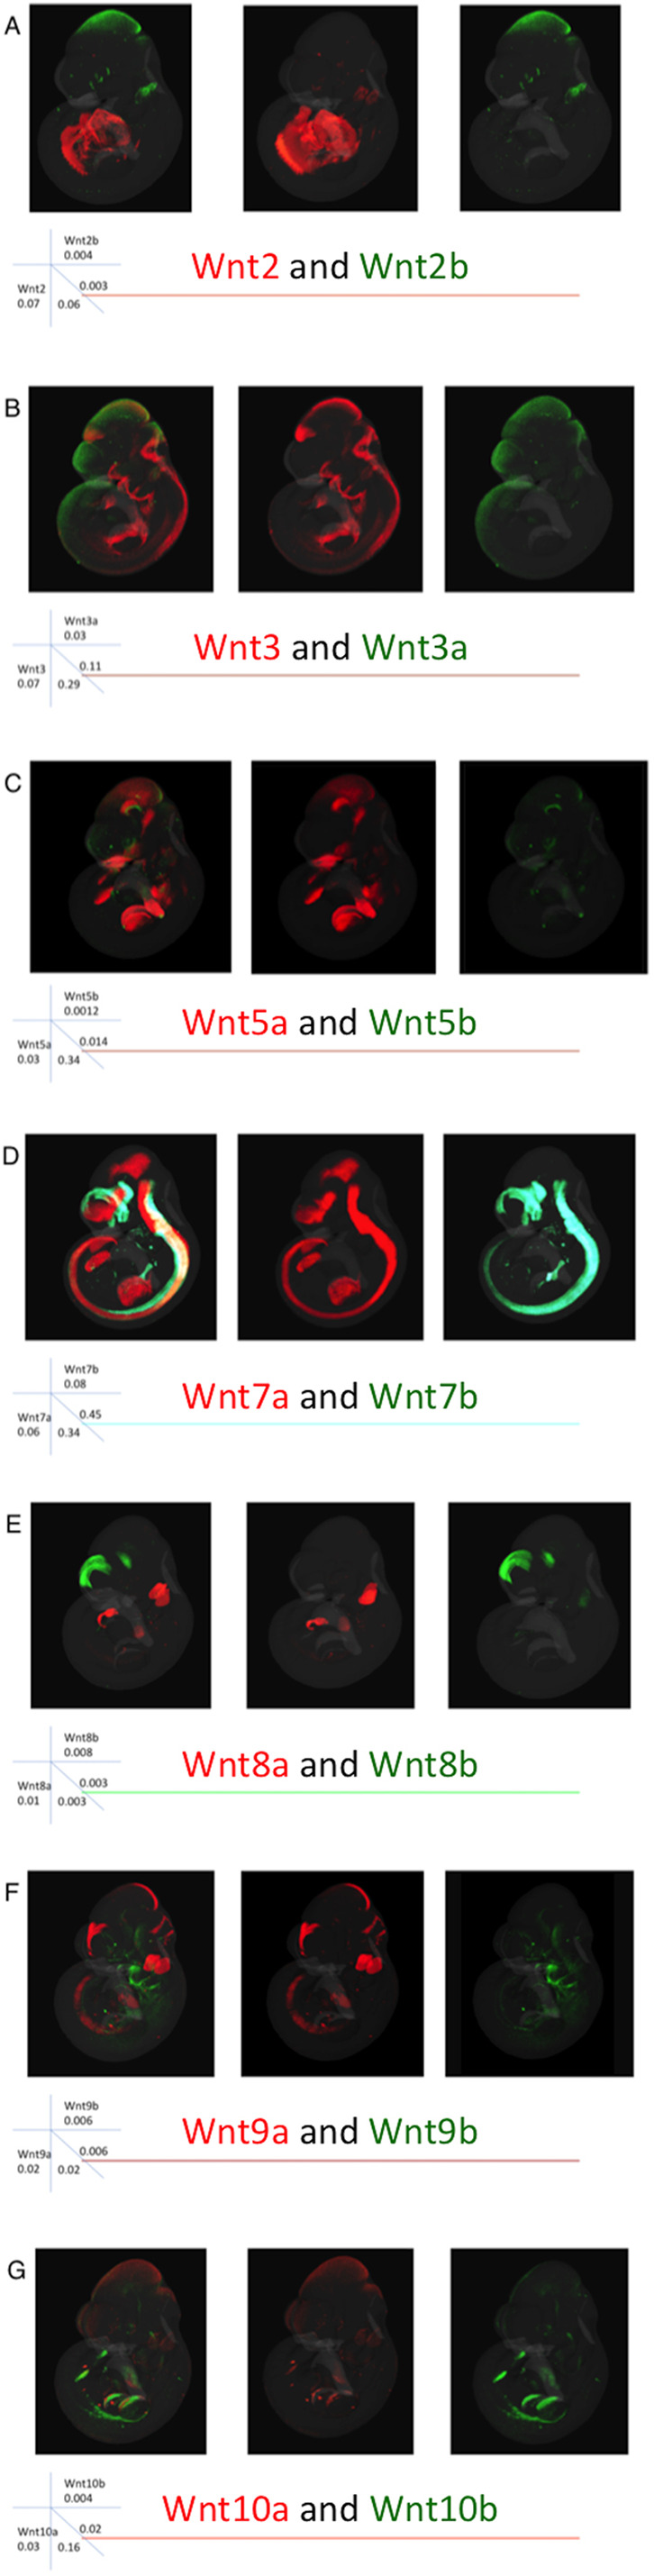
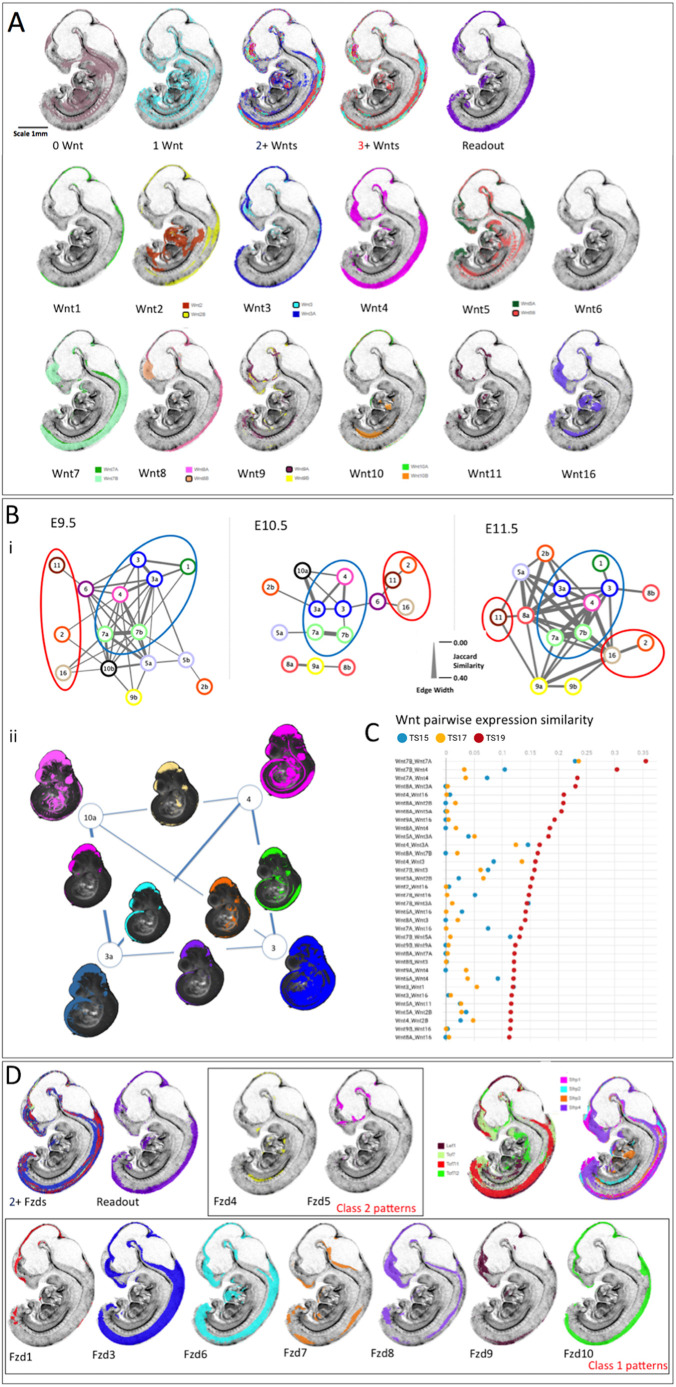
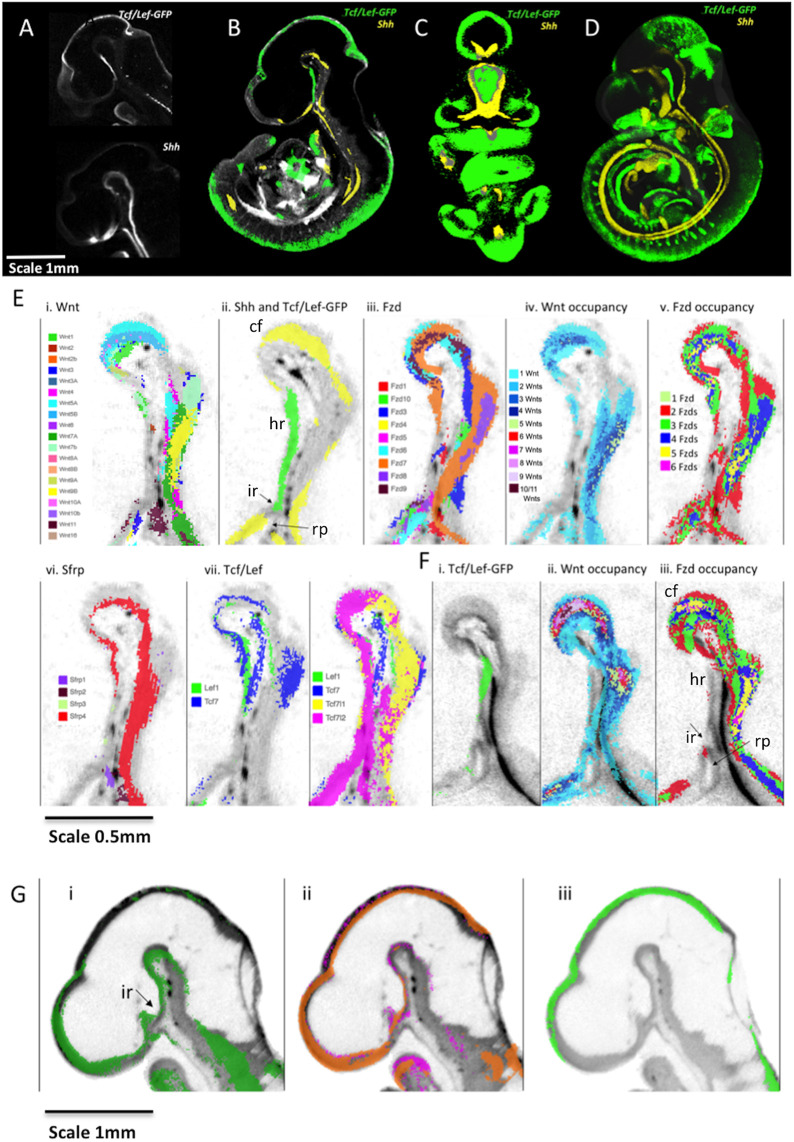
Wnt signalling controls patterning and differentiation across many tissues and organs of the developing embryo through temporally and spatially restricted expression of multi-gene families encoding ligands, receptors, pathway modulators and intracellular components. Here, we report an integrated analysis of key genes in the 3D space of the mouse embryo across multiple stages of development. We applied a method for 3D/3D image transformation to map all gene expression patterns to a single reference embryo for each stage, providing both visual analysis and volumetric mapping allowing computational methods to interrogate the combined expression patterns. We identify territories where multiple Wnt and Fzd genes are co-expressed and cross-compare all patterns, including all seven Wnt paralogous gene pairs. The comprehensive analysis revealed regions in the embryo where no Wnt or Fzd gene expression is detected, and where single Wnt genes are uniquely expressed. This work provides insight into a previously unappreciated level of organisation of expression patterns, as well as presenting a resource that can be utilised further by the research community for whole-system analysis.

Keywords: 3D imaging; Computational analysis; Integrated analysis; Wnt signalling.


Conflict of interest statement

Competing interests The authors declare no competing or financial interests.

Figures

Fig. 1.
Fig. 1.
Visualisation of mapped and integrated gene expression patterns, exemplified at E10.5. Top: Whole embryo external views of 3D data. The original OPT reconstructions showing the expression of Wnt1, Wnt5a and Wnt11 are on the left and individually mapped to the same reference model in the next column (see full 3D movies of each in Movies 1-3). The right-hand columns show the three patterns integrated and all Wnt expression patterns integrated (see 3D Movies 4, 5). Bottom: Virtual sagittal section views through the same 3D data, showing original OPT data and mapped data as above. Red, Wnt1; green, Wnt11; blue, Wnt5a. For more detail on visualisation of each pattern, see Movie 5.
Fig. 2.
Fig. 2.
Overview of integrated expression patterns. (A) Union of the expression of all Wnt genes (red, i), all Fzd genes (green, ii) and the canonical pathway read-out reporter (purple, iii) across the three stages of development as indicated. Column iv shows the ‘all-Fzd’ domain overlaid on the ‘all-Wnt’ domain with overlap shown in yellow. Columns v and vi add the canonical read-out domain in purple (vi is an external view). Column vii shows individual Wnt expression patterns that contribute to the ventral Wnt domain (red, Wnt2; purple, Wnt10b; pink, Wnt4; pale blue, Wnt5a; dark red, Wnt11; dark blue, Wnt5b). (B) 3D graphs showing the extent (proportional size) of each Wnt gene domain in the whole embryo and in individual anatomical domains across stages as indicated; the y-axis shows the proportion of the anatomical domain (z-axis) occupied by each gene expression domain (x-axis). (C) Wnt11 and Wnt5a expression domains on midline sagittal sections across stages; these patterns illustrate the dynamic changes in extent of expression across stages.
Fig. 3.
Fig. 3.
Integrative mapping of all Wnt and Fzd domains allows visualisation of the territories where no Wnt or Fzd gene is expressed or where unique Wnt genes are expressed. (A) Domains across stages where no Wnt expression (green) or no Fzd expression (yellow) is detected. (B) Domains across stages where a single Wnt gene is detected, i.e. unique detection of a single Wnt gene transcript. (C) Individual Wnt gene domains that account for much of the single Wnt gene domain at each stage, i.e. much of the unique Wnt gene territory in the ventral embryo at E10.5 is occupied by Wnt2 and Wnt11 expression domains, whereas Wnt11 contributes little at E11.5 when Wnt5b is more prominent. The figures noted in brackets are the percentage of the unique Wnt gene expression domain at that stage contributed to by that gene. Note that the unique Wnt domains reported here were obtained by subtraction of multiple mapped expression domains and, as such, are sensitive to cumulative effects of noise in the data for each gene, in particular small differences in thresholding the original, continuously variable signals into binary (expressed versus not detected) values. Although the images show the general location of the domains, the boundaries should be considered approximate.
Fig. 4.
Fig. 4.
Regions of high occupancy Wnt and Fzd expression. (A) Regions of high occupancy of Wnt gene expression (magenta) at E9.5, E10.5 and E11.5. (B) Transverse section through an OPT reference model of an E11.5 embryo in the mid-flank region showing the distribution of occupancy of Wnt expression as indicated. This section reveals three ROHOs. (C) Same section as in B, showing the mapped expression of individual Wnt genes as indicated. For clarity, left (a) and right (b) halves of the section are shown with the expression of Wnt3, 4, 8b, 9b, 10a, 10b (a) and Wnt1, 2, 2b, 3a, 5a, 5b, 6, 7a, 7b, 8a, 9a, 11, 16 (b). (D) A section through an OPT reference model of an E10.5 embryo in the mandibular region. Regions of high occupancy of Wnt expression (red; four or more Wnts expressed) and individual Wnt gene expression domains are shown for Wnt3, 4, 7a, 7b, 10a and 10b (key as in C). (E) Transverse section through an OPT reference model of an E11.5 embryo in the mid-flank region showing Fzd ROHOs (key as indicated) in the context of Wnt ROHOs (key as in B showing only 5+ Wnt genes) and expression of Wnt5a and Wnt5b. (F) Transverse section through an OPT reference model of an E11.5 embryo in the mandibular region showing Wnt and Fzd ROHOs (key as in E). (G) The same section as in F, showing only the peaks of Wnt and Fzd occupancy (Wnt occupancy of seven or more; Fzd occupancy of six or more. (H-J) Sections through the mandibular region in OPT reference models of embryos at E9.5, E10.5 and E11.5, respectively. The images show the canonical pathway read-out (Tcf/Lef-GFP RNA) (yellow) in the context of Wnt and Fzd ROHOs (key as in E). (K) Section through the mandibular region of an OPT reference model of an E10.5 embryo showing Fzd ROHOs compared with where no Fzds are detected (as indicated). (L) The same section as in K showing the expression of individual Fzds genes as indicated (the section is repeated for clarity). (M) The same section as in K showing Sfrp occupancy of 0, 3 and 4 (as indicated) in the context of Wnt ROHOs (key as in E) and canonical pathway read-out (Tcf/Lef-GFP) in yellow. (N) The same key as M on a section through the maxillary and mandibular region of an OPT reference model of an E11.5 embryo. Scale bars: 500 µm.
Fig. 5.
Fig. 5.
Comparison of expression of paralogous pairs of Wnt genes at E10.5 mapped to the reference embryo model. Each row shows a different pair of the seven Wnt paralogues, as indicated. The combined image of both genes is shown on the left and the two individual patterns in the order listed from left to right (colour coded). The rubric indicates the relative size of each domain (e.g. Wnt2 occupies 7% of the embryo); the intersecting numbers show the proportion of one pattern overlapping the other so 6% of the Wnt2b domain overlaps the Wnt2 domain. Note the highest level of overlap for the Wnt7 paralogues, followed by the Wnt3 and Wnt5 paralogues.
Fig. 6.
Fig. 6.
Integrated comparison of gene expression pattern similarity across Wnt, Fzd and other pathway component genes. (A) E11.5 example of the visual analysis carried out; all virtual sections are identical, mid-sagittal. The top row shows the territories where zero Wnts are detected (0 Wnt), where individual Wnt genes are expressed uniquely (1 Wnt), where 2 or more (2+ Wnts) or 3 or more (3+ Wnts) genes are co-expressed and where canonical Wnt pathway read-out is detected (Tcf/Lef-GFP). Rows 2 and 3 represent mapped expression of each of the Wnt family genes as indicated. The analysis included viewing the full set of sections in all orientations and across stages. (Bi) Network diagrams representing the similarities between Wnt expression pattern across time. The lines connecting nodes represent the JI of similarity (intersection/union), with thickness scaled as shown. Each ‘node’ represents a Wnt gene as indicated (e.g. 3a=Wnt3a). For comparison of the network, thresholds were adjusted to show the 15 genes with expression patterns most similar to other Wnt genes at each stage. Blue circles enclose the group with most highly similar expression patterns, consistent across stages (Group 1). Red circles enclose the most divergent expression patterns (Group 3). (Bii) Visual illustration of the nature of the lines connecting genes in the network focussing on the most highly connected genes at E10.5; Wnt3, 3a, 4 and 10a. The mapped Wnt expression patterns are shown here in projection through a 3D view of the reference model embryo, at each corner of the network (as indicated). Intersection domains, where each pair of expression patterns intersect, are shown on the lines connecting that gene pair. (C) Top 34 similarity scores among all Wnt genes across stages. The horizontal axis refers to JI (red, E11.5; yellow, E10.5; blue, E9.5). (D) Domains of multiple Fzd expression patterns (2+ Fzds) correspond well to territories of canonical pathway read-out (Tcf/Lef-GFP). Fzd expression patterns fall within two classes: class 1 (row 2) are similar to canonical read-out, Tcf/Lef transcription factor and Sfrp family member expression patterns (row 1, right). Example patterns at E11.5 are shown.
Fig. 7.
Fig. 7.
Integrated expression patterns in the VD: complementary expression of Shh and canonical Wnt pathway read-out. (A) Tcf/Lef-GFP read-out pattern and Shh expression in virtual sagittal sections through the diencephalon of raw OPT data. (B-D) Mapped data with greyscale render of the 3D model showing anatomy. (B) Virtual sagittal section through the 3D model emphasising the complementary expression of Tcf/Lef-GFP read-out pattern (green) and Shh (yellow) in the VD. (C) Thick virtual coronal section (288 µm) through the 3D model of mapped data again showing complementarity in the patterns (absence of overlap verified on serial sections). (D) Full 3D representation (point-cloud render). (A-D) E10.5. Scale bar in A also applies to B-D. (E) Sagittal sections through the VD at E10.5 showing: (i) mapped expression of all Wnt genes as indicated by the key; (ii) canonical Wnt read-out (Tcf/Lef-GFP, green) and Shh (yellow) expression on the same section; (iii) mapped expression of all Fzd genes as indicated by the key; (iv) Wnt occupancy; the number of Wnt genes co-expressed as indicated (no colour indicates that no Wnts are detected); (v) Fzd occupancy, with the number of Fzd genes co-expressed as indicated (no colour indicates no genes detected); (vi) mapped expression of Sfrp genes as indicated by key; (vii) mapped expression of Tcf/Lef transcription factor genes as indicated by key. (F) Sagittal sections through the VD at E11.5 showing (i) canonical Wnt read-out (Tcf/Lef-GFP, green); (ii) the number of Wnt genes co-expressed (key as in Eiv) and (iii) the number of Fzd genes co-expressed (key as in Ev) (no colour indicates no genes detected). (G) Sagittal sections through the brain at E9.5 showing (i) mapped expression of Wnt7a (green), (ii) mapped expression of Fzd5 (magenta) and Fzd7 (orange) and (iii) canonical Wnt read-out (Tcf/Lef-GFP, green). cf, cephalic flexure; hr, hypothalamic region; ir, infundibular recess; rp, Rathke's pouch.

References

    1. Armit, C., Richardson, L., Hill, B., Yang, Y. and Baldock, R. A. (2015). eMouseAtlas informatics: embryo atlas and gene expression database. Mamm. Genome 26, 431-440. 10.1007/s00335-015-9596-5 - DOI - PMC - PubMed
    1. Armit, C., Richardson, L., Venkataraman, S., Graham, L., Burton, N., Hill, B., Yang, Y. and Baldock, R. A. (2017). eMouseAtlas: an atlas-based resource for understanding mammalian embryogenesis. Dev. Biol. 423, 1-11. 10.1016/j.ydbio.2017.01.023 - DOI - PMC - PubMed
    1. Arraf, A. A., Yelin, R., Reshef, I., Kispert, A. and Schultheiss, T. M. (2016). Establishment of the visceral embryonic midline is a dynamic process that requires bilaterally symmetric BMP signaling. Dev. Cell 37, 571-580. 10.1016/j.devcel.2016.05.018 - DOI - PubMed
    1. Baldock, R. A., Bard, J. B. L., Burger, A., Burton, N., Christiansen, J., Feng, G., Hill, B., Houghton, D., Kaufman, M., Rao, J.et al. (2003). EMAP and EMAGE: a framework for understanding spatially organized data. Neuroinformatics 1, 309-325. 10.1385/NI:1:4:309 - DOI - PubMed
    1. Bharti, K., Gasper, M., Bertuzzi, S. and Arnheiter, H. (2011). Lack of the ventral anterior homeodomain transcription factor VAX1 leads to induction of a second pituitary. Development 138, 873-878. 10.1242/dev.056465 - DOI - PMC - PubMed

Publication types