. 2022 May 29;12(10):4606-4628.
doi: 10.7150/thno.72760. eCollection 2022.

Single-cell transcriptome profiling of the immune space-time landscape reveals dendritic cell regulatory program in polymicrobial sepsis

Affiliations

Single-cell transcriptome profiling of the immune space-time landscape reveals dendritic cell regulatory program in polymicrobial sepsis

Ren-Qi Yao et al. Theranostics. .

Abstract

Rationale: Evident immunosuppression has been commonly seen among septic patients, and it is demonstrated to be a major driver of morbidity. Nevertheless, a comprehensive view of the host immune response to sepsis is lacking as the majority of studies on immunosuppression have focused on a specific type of immune cells. Methods: We applied multi-compartment, single-cell RNA sequencing (scRNA-seq) to dissect heterogeneity within immune cell subsets during sepsis progression on cecal ligation and puncture (CLP) mouse model. Flow cytometry and multiplex immunofluorescence tissue staining were adopted to identify the presence of 'mature DCs enriched in immunoregulatory molecules' (mregDC) upon septic challenge. To explore the function of mregDC, sorted mregDC were co-cultured with naïve CD4+ T cells. Intracellular signaling pathways that drove mregDC program were determined by integrating scRNA-seq and bulk-seq data, combined with inhibitory experiments. Results: ScRNA-seq analysis revealed that sepsis induction was associated with substantial alterations and heterogeneity of canonical immune cell types, including T, B, natural killer (NK), and myeloid cells, across three immune-relevant tissue sites. We found a unique subcluster of conventional dendritic cells (cDCs) that was characterized by specific expression of maturation- and migration-related genes, along with upregulation of immunoregulatory molecules, corresponding to the previously described 'mregDCs' in cancer. Flow cytometry and in stiu immunofluorescence staining confirmed the presence of sepsis-induced mregDC at protein level. Functional experiments showed that sepsis-induced mregDCs potently activated naive CD4+ T cells, while promoted CD4+ T cell conversion to regulatory T cells. Further observations indicated that the mregDC program was initiated via TNFRSF-NF-κB- and IFNGR2-JAK-STAT3-dependent pathways within 24 h of septic challenge. Additionally, we confirmed the detection of mregDC in human sepsis using publicly available data from a recently published single-cell study of COVID-19 patients. Conclusions: Our study generates a comprehensive single-cell immune landscape for polymicrobial sepsis, in which we identify the significant alterations and heterogeneity in immune cell subsets that take place during sepsis. Moreover, we find a conserved and potentially targetable immunoregulatory program within DCs that associates with hyperinflammation and organ dysfunction early following sepsis induction.

Keywords: dendritic cells; immunosuppression; sepsis; single-cell analysis.


Conflict of interest statement

Competing Interests: The authors have declared that no competing interest exists.

Figures
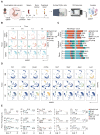
Figure 1
Figure 1
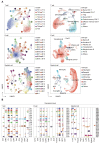
Single-cell analyses reveal major immune cell composition in polymicrobial sepsis. A. Schematic workflow depicting the experimental design of the current study. B. UMAP plots of major immune cell groups, across three immune-relevant tissue sites and time after cecal ligation and puncture (CLP) operation. C. Proportion and absolute counts of each major immune cell type in each sample. D. UMAPs showing expression of canonical annotation marker gene by color (blue, low expression; yellow, high expression). E. Proportion of major immune cell type at distinct time points among different tissue types, including bone marrow (BM), peripheral blood (PB), and spleen (SP).
Figure 2
Figure 2
Subtype analyses of T, B, and myeloid cells based on single-cell gene expression. A. UMAP projections of subclustered T, B, and myeloid cells, labeled by distinguishing colors (left panels). Phenotypic annotations of each subcluster were presented in independent UMAP plots (right panels). B. Violin plots revealed expression level of selected marker genes for immune cell subsets within each lineage color coded by the subclusters shown in A.
Figure 3
Figure 3
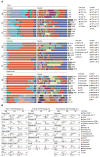
Proportional and numerical alterations of T, B, and myeloid cells in sepsis. A. Proportion and absolute counts of each subcluster of T, B, and myeloid cells, across three immune-relevant tissue sites and distinct time points after sepsis. B. Percentage of each annotated T/B/myeloid subtype at distinct time points across the anatomic sites.
Figure 4
Figure 4
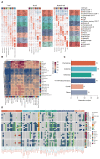
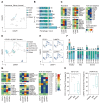
Composition and cell-cell interacting network of the immune cells in sepsis. A. Heatmaps displaying the relative expression level of cell type-specific genes across subclusters of T, B, and myeloid cells. B. Heatmap with double projection showing the cell-cell interacting density among all identified immune cell subtypes, which was proportional to the number of ligands when isogenic receptors were expressed in the recipient cell type (blue, low density of cell-cell interactions; purple, dense cell-cell interactions). C. Ligand-receptor pairs between T lymphocytes and DCs were categorized into six patterns in line with their biological functions, including chemokines, cytokines, adhesion, co-stimulatory/inhibitory, growth and others. Numbers of each pattern were ranked accordingly. D. Detailed analysis of the receptors expressed by each T lymphocyte and DC subtype and the cells expressing the cognate ligands primed to receive the signal. Statistical significance (P<0.05) was determined by permutation test using CellPhoneDB, with grey color indicating no statistical significance. The color gradient indicated the level of interaction (blue, low level of interaction; red, high level of interaction).
Figure 5
Figure 5
Characterization of conventional dendritic cell subset in sepsis. A. UMAP plot showing subclusters of conventional dendritic cells (cDCs) by color. B. UMAPs showing expression level of key lineage markers of cDCs, including Batf3, Irf4 and Lyz2, corresponding to cDC1s, cDC2s and monocyte-derived DCs (MoDCs), respectively. C. Violin plots displaying expression level of marker genes for cDC subsets within each lineage (blue, low expression; yellow, high expression). D. Proportion and absolute counts of each subcluster of cDCs, across three immune-relevant tissue sites and distinct time points. E. Percentage of each cDC subclusters at distinct time points among different tissue types. F. Heatmaps displaying the relative expression level of top 10 differentially expressed genes (DEGs) among all cDC subpopulations. G. Heatmaps of Luminex liquid suspension chip analysis indicating relative expression level of various cytokines/chemokines in serum and splenic interstitial fluid derived from mice underwent sham or CLP surgery. H. Histological scores (right panel) and representative images of hematoxylin and eosin (HE) staining (left panel) elucidating the pathological alterations in multiple organs of mice underwent sham or CLP surgery, including lung, liver, kidney, and heart. One-way analysis of variance (ANOVA) with Tukey HSD test was applied to testify the statistical significance. Data were expressed as means ± standard error of mean (SEM). *P<0.05; **P<0.01; ***P<0.001; ****P<0.0001.
Figure 6
Figure 6
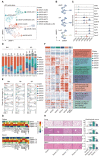
Sepsis-induced mregDCs exhibit unique transcriptional signatures. A. Heatmap showing relative expression level of mregDC signature genes among subclustered cDC subsets (blue, low expression level; red, high expression level). B. The developmental trajectory of cDCs inferred by Monocle2, colored-coded by the clusters and pseudotime (left panel). Putative trajectory for cell transition states of cDCs, with proportion of each subcluster (upper right panel). Composition of cells at disparate proliferative phases calculated by cell cycling scores (G1, G2M and S) (lower right panel). C. Heatmap displaying the dynamic transitions in expression level of cDC1, cDC2 and mregDC marker genes along with the pseudotime (left panel). Pseudotime plots illustrating expression of selected signature genes over pseudotime with distribution of cDC subclusters (right panel). D. Volcano plot showing upregulated genes in the cluster of mregDCs (left panel). Bar graph listed the enriched activated pathways in mregDCs by KEGG analysis (right panel).
Figure 7
Figure 7
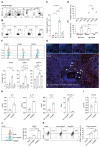
mregDCs are enriched upon sepsis induction with dual immunoregulatory and immunogenic functions on CD4+ T cell responses. A. Representative contour plots elucidating flow cytometry-based gating strategy for spleen-derived cDCs in wild-type mice. cDCs were defined as CD45+ Lin (CD3e, CD19, CD49b, Ly6C)- CD11c+ MHC-II+ cells, in which cDC1 and cDC2 were defined CD45+ Lin- CD11c+ MHC-II+ CD8a+ CD11b- and CD45+ Lin- CD11c+ MHC-II+ CD8a- CD11b+ cells, respectively. B, C. Frequency of splenic mregDCs as a proportion of total cDCs at disparate time points after CLP operation. mregDCs were defined as CD45+ Lin- CD11c+ MHC-II+ CD274hi CD80hi cells. Contour plots B. and quantitative bar charts C. showing alterations in mregDCs proportion upon sepsis induction measured by flow cytometry analysis. D. Scatter plot showing mregDCs proportion in cDC1 and cDC2 subsets independently between sham and sepsis groups. E. Quantitative bar plots displaying and comparing mregDCs proportion between wild-type, Batf3-/- and Irf4-/- mice. F. Histograms with quantitative bar charts showing proportion of CCR7, CD80, and CD274 positive cells measured by flow cytometry, across distinct time points after onset of sepsis, as a percentage of total cDCs. G. Multiplex immunofluorescence images demonstrating the in situ existence of mregDCs in spleen after septic challenge, using antibodies, including CD11c, MHC-II, CD80, and CD274. Scale bar, 100 μm. H. Quantitative bar charts showing the level of multiple cytokines in supernatants between mregDCs and non-mregDCs groups, including interleukin (IL)-2, IL-4, IL-10, IL-12, and IFN-γ. I. Quantitative bar chart displaying the results from cell counting kit-8 (CCK-8) assay. J. Histogram with quantitative bar plot illustrating and comparing the proliferative activity of naïve CD4+ T cells co-cultured with either mregDCs or non-mregDCs based on carboxyl fluorescein succinyl ester staining (CFSE) assay. K. Contour plots with quantitative bar chart showing the proportion of CD4+CD25+Foxp3+ Tregs between mregDCs and non-mregDCs groups. One-way ANOVA with Tukey HSD test C, F, J, K; Unpaired two-sided Student's t test D, H, I. Data were expressed as means ± SEM. *P<0.05; **P <0.01; ***P<0.001; ****P<0.0001.
Figure 8
Figure 8
Sepsis-associated mregDC program is initiated in a TNFRSF-NF-κB and IFNGR2-STAT3 dependent manner. A. Histogram indicating the relative expression level of selected genes related to JAK-STAT and NF-κB pathways from bulk RNA-seq analyses (blue, low expression level; red, high expression level). B. Histogram showing the cell-cell communication between mregDCs and other immune cell types, based on selected ligand-receptor pairs in association with TNFRSF-TNFSF and IFN-γ- IFNGR2. Statistical significance (P<0.05) was determined by permutation test from CellPhoneDB, with color of grey indicating no statistical significance. The color gradient indicated the level of interaction (blue, low level of interaction; red, high level of interaction). C. Representative Western blotting images of splenic CD11c+ DCs isolated from wild-type mice undergone sham or CLP operation at distinct time points. D. Quantitative bar charts displaying the results of Western blotting analyses. The values represent protein levels relative to the unphosphorylated form or β-actin level. The data shown are representative of 3 independent experiments. E. Inhibitory experiments were performed to validate the effect of TNFRSF-NF-κB and IFNGR2-STAT3 pathways on mregDC program using STAT3 and NK-κB inhibitors, JSH-23 and SH-4-54, respectively. Contour plots (left panel) with quantitative bar chart (upper right panel) showing the proportion of mregDCs upon inhibition of STAT3 and NK-κB. Western blot analysis of PD-L1 expression in splenic CD11c+ DCs after treatment with inhibitors (lower right panel). F. Proposed model of mregDC program upon sepsis induction. Graphs were created with BioRender.com. Statistical significance was calculated using one-way ANOVA with Tukey HSD test D, E. Data were expressed as means ± SEM. *P<0.05; **P<0.01; ***P<0.001.
Figure 9
Figure 9
Single-cell analyses of publicly available data demonstrate multiorgan and cross-species conservation of sepsis-induced upregulation of mregDCs. A. Single-cell analysis of previously published scRNA-seq dataset containing various immune cell subpopulations in lipopolysaccharide (LPS) challenged murine kidney projected in UMAP, with color-coded DC subtypes, including cDC1, cDC2, and plasmacytoid dendritic cell (pDC). B. Proportion and absolute counts of renal cDC2s as a percentage of total DCs, across distinct time points after the onset of endoxemia. C. Heatmap showing relative expression level of mregDC signature genes among subclustered DC subsets (blue, low expression level; red, high expression level). D. Unbiased Seurat-based clustering analysis of immune cells derived from bronchoalveolar lavage fluid (BALF) of the novel coronavirus disease (COVID-19) patients yielded four disparate clusters of DCs visualized by UMAP. E. Phenotypic annotations of each DC subcluster were presented in independent UMAP plots based on the relative expression level of cell-type specific genes, including CD1C, CLEC9A, LAMP3, and LILR4A (blue, low expression; yellow, high expression). F. Histogram indicating proportion and absolute counts of each DC subpopulation in BALF from healthy individuals and COVID-19 patients with disparate severity, as a percentage of total DCs. G. Heatmap displaying expression level of selected mregDC marker genes for each DC subset (blue, low expression level; red, high expression level). H. Quantitative box plots showing and comparing the proportion of CD1C+ DCs (left panel) and LAMP3+ DCs (right panel) among healthy participants and mild or severe cases of COVID-19. Statistical significance was determined using one-way ANOVA with Tukey HSD test H. Data were presented as means ± SEM. *P<0.05.

References

    1. Singer M, Deutschman CS, Seymour CW, Shankar-Hari M, Annane D, Bauer M. et al. The Third International Consensus Definitions for Sepsis and Septic Shock (Sepsis-3) JAMA. 2016;315(8):801–810. - PMC - PubMed
    1. Yao RQ, Ren C, Zheng LY, Xia ZF, Yao YM. Advances in immune monitoring approaches for sepsis-induced immunosuppression. Front Immunol. 2022;13:891024. - PMC - PubMed
    1. Rudd KE, Johnson SC, Agesa KM, Shackelford KA, Tsoi D, Kievlan DR. et al. Global, regional, and national sepsis incidence and mortality, 1990-2017: analysis for the Global Burden of Disease Study. Lancet. 2020;395(10219):200–211. - PMC - PubMed
    1. Cecconi M, Evans L, Levy M, Rhodes A. Sepsis and septic shock. Lancet. 2018;392(10141):75–87. - PubMed
    1. Rhodes A, Evans LE, Alhazzani W, Levy MM, Antonelli M, Ferrer R. et al. Surviving Sepsis Campaign: International Guidelines for Management of Sepsis and Septic Shock: 2016. Intensive Care Med. 2017;43(3):304–377. - PubMed

Publication types