Automated Measurement of Net Water Uptake From Baseline and Follow-Up CTs in Patients With Large Vessel Occlusion Stroke
- PMID: 35832178
- PMCID: PMC9271791
- DOI: 10.3389/fneur.2022.898728
Automated Measurement of Net Water Uptake From Baseline and Follow-Up CTs in Patients With Large Vessel Occlusion Stroke
Abstract
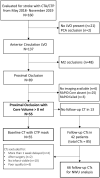
Quantifying the extent and evolution of cerebral edema developing after stroke is an important but challenging goal. Lesional net water uptake (NWU) is a promising CT-based biomarker of edema, but its measurement requires manually delineating infarcted tissue and mirrored regions in the contralateral hemisphere. We implement an imaging pipeline capable of automatically segmenting the infarct region and calculating NWU from both baseline and follow-up CTs of large-vessel occlusion (LVO) patients. Infarct core is extracted from CT perfusion images using a deconvolution algorithm while infarcts on follow-up CTs were segmented from non-contrast CT (NCCT) using a deep-learning algorithm. These infarct masks were flipped along the brain midline to generate mirrored regions in the contralateral hemisphere of NCCT; NWU was calculated as one minus the ratio of densities between regions, removing voxels segmented as CSF and with HU outside thresholds of 20-80 (normal hemisphere and baseline CT) and 0-40 (infarct region on follow-up). Automated results were compared with those obtained using manually-drawn infarcts and an ASPECTS region-of-interest based method that samples densities within the infarct and normal hemisphere, using intraclass correlation coefficient (ρ). This was tested on serial CTs from 55 patients with anterior circulation LVO (including 66 follow-up CTs). Baseline NWU using automated core was 4.3% (IQR 2.6-7.3) and correlated with manual measurement (ρ = 0.80, p < 0.0001) and ASPECTS (r = -0.60, p = 0.0001). Automatically segmented infarct volumes (median 110-ml) correlated to manually-drawn volumes (ρ = 0.96, p < 0.0001) with median Dice similarity coefficient of 0.83 (IQR 0.72-0.90). Automated NWU was 24.6% (IQR 20-27) and highly correlated to NWU from manually-drawn infarcts (ρ = 0.98) and the sampling-based method (ρ = 0.68, both p < 0.0001). We conclude that this automated imaging pipeline is able to accurately quantify region of infarction and NWU from serial CTs and could be leveraged to study the evolution and impact of edema in large cohorts of stroke patients.
Keywords: cerebral edema area; computed tomography; image segmentation; machine learning; stroke.
Copyright © 2022 Kumar, Chen, Corbin, Hamzehloo, Abedini, Vardar, Carey, Bhatia, Heitsch, Derakhshan, Lee and Dhar.
Conflict of interest statement
The authors declare that the research was conducted in the absence of any commercial or financial relationships that could be construed as a potential conflict of interest.
Figures


Similar articles
-
Imaging biomarkers of cerebral edema automatically extracted from routine CT scans of large vessel occlusion strokes.J Neuroimaging. 2023 Jul-Aug;33(4):606-616. doi: 10.1111/jon.13109. Epub 2023 Apr 24. J Neuroimaging. 2023. PMID: 37095592 Free PMC article.
-
Occult contrast retention post-thrombectomy on 24-h follow-up dual-energy CT: Associations and impact on imaging analysis.Int J Stroke. 2023 Dec;18(10):1228-1237. doi: 10.1177/17474930231182018. Epub 2023 Jun 19. Int J Stroke. 2023. PMID: 37260232
-
Correlation Between Computed Tomography-Based Tissue Net Water Uptake and Volumetric Measures of Cerebral Edema After Reperfusion Therapy.Stroke. 2022 Aug;53(8):2628-2636. doi: 10.1161/STROKEAHA.121.037073. Epub 2022 Apr 22. Stroke. 2022. PMID: 35450438
-
Review of net water uptake in the management of acute ischemic stroke.Eur Radiol. 2022 Aug;32(8):5517-5524. doi: 10.1007/s00330-022-08658-x. Epub 2022 Mar 12. Eur Radiol. 2022. PMID: 35278122 Review.
-
Automated quantitative assessment of cerebral edema after ischemic stroke using CSF volumetrics.Neurosci Lett. 2020 Apr 17;724:134879. doi: 10.1016/j.neulet.2020.134879. Epub 2020 Feb 29. Neurosci Lett. 2020. PMID: 32126249 Free PMC article. Review.
Cited by
-
Cerebral edema after ischemic stroke: Pathophysiology and underlying mechanisms.Front Neurosci. 2022 Aug 18;16:988283. doi: 10.3389/fnins.2022.988283. eCollection 2022. Front Neurosci. 2022. PMID: 36061592 Free PMC article. Review.
-
Contrast quality control for segmentation task based on deep learning models-Application to stroke lesion in CT imaging.Front Neurol. 2025 Feb 10;16:1434334. doi: 10.3389/fneur.2025.1434334. eCollection 2025. Front Neurol. 2025. PMID: 39995787 Free PMC article.
-
Early automated cerebral edema assessment following endovascular therapy: impact on stroke outcome.J Neurointerv Surg. 2025 Mar 17;17(4):354-359. doi: 10.1136/jnis-2024-021641. J Neurointerv Surg. 2025. PMID: 38637151
-
Semiautomated Detection of Early Infarct Signs on Noncontrast CT Improves Interrater Agreement.Stroke. 2023 Dec;54(12):3090-3096. doi: 10.1161/STROKEAHA.123.044058. Epub 2023 Nov 1. Stroke. 2023. PMID: 37909206 Free PMC article.
-
Evaluating the interaction between hemorrhagic transformation and cerebral edema on functional outcome after ischemic stroke.J Stroke Cerebrovasc Dis. 2024 Oct;33(10):107913. doi: 10.1016/j.jstrokecerebrovasdis.2024.107913. Epub 2024 Aug 3. J Stroke Cerebrovasc Dis. 2024. PMID: 39098362
References
Grants and funding
LinkOut - more resources
Full Text Sources
Research Materials

