

Identification of occupations susceptible to high exposure and risk associated with multiple toxicants in an observational study: National Health and Nutrition Examination Survey 1999-2014
- PMID: 35832257
- PMCID: PMC9266352
- DOI: 10.1093/exposome/osac004
Identification of occupations susceptible to high exposure and risk associated with multiple toxicants in an observational study: National Health and Nutrition Examination Survey 1999-2014
Abstract
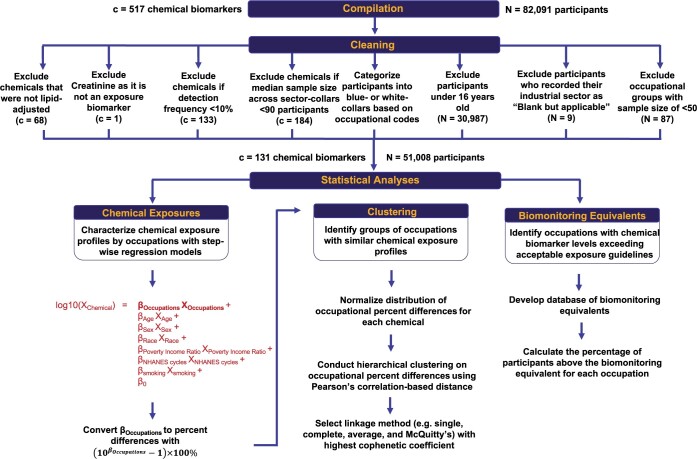
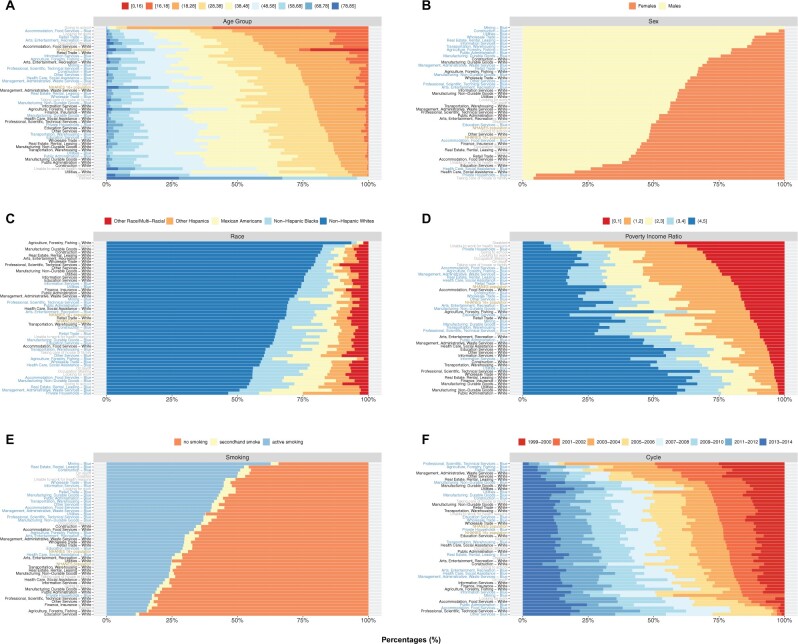
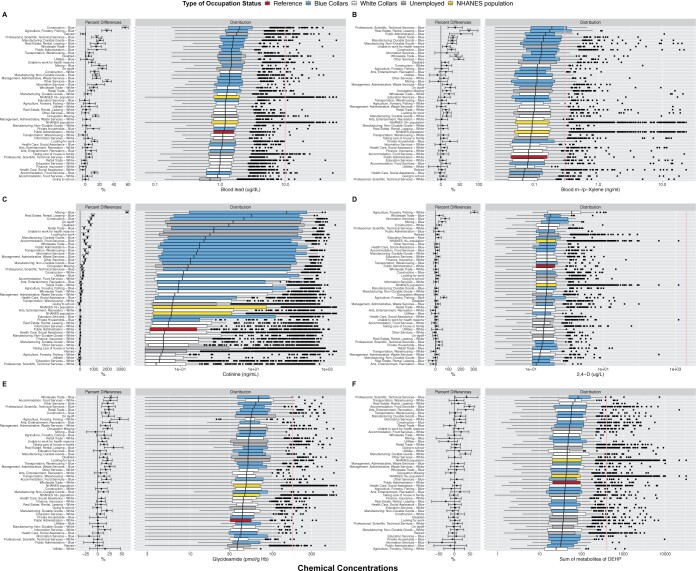
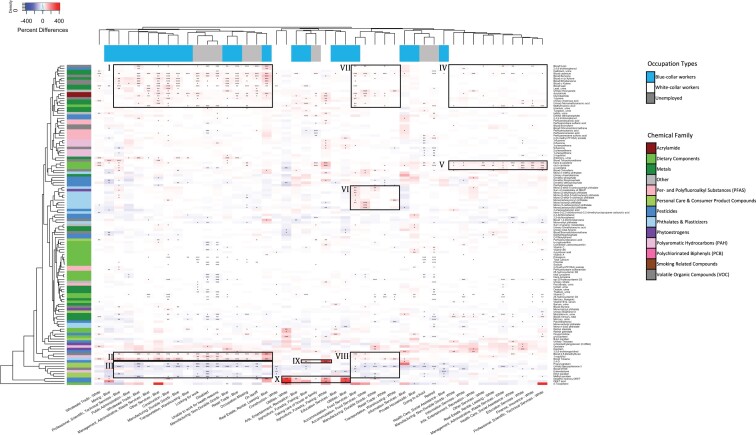
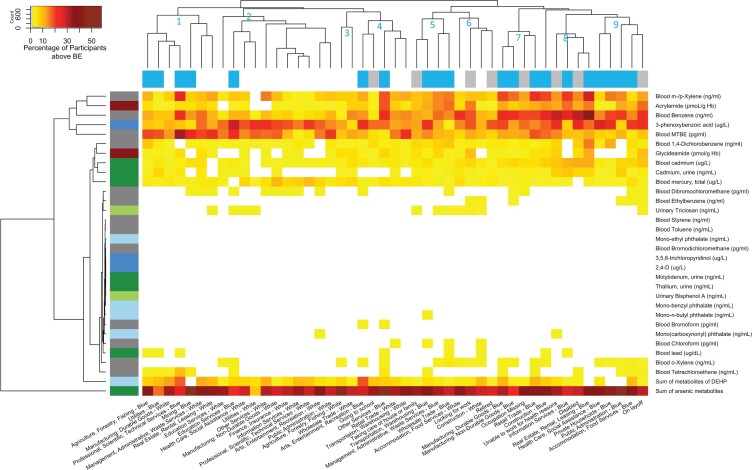
Occupational exposures to toxicants are estimated to cause over 370 000 premature deaths annually. The risks due to multiple workplace chemical exposures and those occupations most susceptible to the resulting health effects remain poorly characterized. The aim of this study is to identify occupations with elevated toxicant biomarker concentrations and increased health risk associated with toxicant exposures in a diverse working US population. For this observational study of 51 008 participants, we used data from the 1999-2014 National Health and Nutrition Examination Survey. We characterized differences in chemical exposures by occupational group for 131 chemicals by applying a series of generalized linear models with the outcome as biomarker concentrations and the main predictor as the occupational groups, adjusting for age, sex, race/ethnicity, poverty income ratio, study period, and biomarker of tobacco use. For each occupational group, we calculated percentages of participants with chemical biomarker levels exceeding acceptable health-based guidelines. Blue-collar workers from "Construction," "Professional, Scientific, Technical Services," "Real Estate, Rental, Leasing," "Manufacturing," and "Wholesale Trade" have higher biomarker levels of toxicants such as several heavy metals, acrylamide, glycideamide, and several volatile organic compounds (VOCs) compared with their white-collar counterparts. Moreover, blue-collar workers from these industries have toxicant concentrations exceeding acceptable levels: arsenic (16%-58%), lead (1%-3%), cadmium (1%-11%), glycideamide (3%-6%), and VOCs (1%-33%). Blue-collar workers have higher toxicant levels relative to their white-collar counterparts, often exceeding acceptable levels associated with noncancer effects. Our findings identify multiple occupations to prioritize for targeted interventions and health policies to monitor and reduce toxicant exposures.
Keywords: biomonitoring equivalents; environmental chemicals; occupational epidemiology; occupational exposures; risk assessment; unsupervised learning.
© The Author(s) 2022. Published by Oxford University Press.
Figures
Similar articles
-
Sexual Harassment and Prevention Training.2024 Mar 29. In: StatPearls [Internet]. Treasure Island (FL): StatPearls Publishing; 2025 Jan–. 2024 Mar 29. In: StatPearls [Internet]. Treasure Island (FL): StatPearls Publishing; 2025 Jan–. PMID: 36508513 Free Books & Documents.
-
Interventions to reduce harm from continued tobacco use.Cochrane Database Syst Rev. 2016 Oct 13;10(10):CD005231. doi: 10.1002/14651858.CD005231.pub3. Cochrane Database Syst Rev. 2016. PMID: 27734465 Free PMC article.
-
Risk characterization for silica-related silicosis and lung cancer in communities adjacent to sand and gravel extraction facilities: examining limitations in our current risk methods.Front Public Health. 2025 Jun 18;13:1558778. doi: 10.3389/fpubh.2025.1558778. eCollection 2025. Front Public Health. 2025. PMID: 40606098 Free PMC article.
-
Factors that influence parents' and informal caregivers' views and practices regarding routine childhood vaccination: a qualitative evidence synthesis.Cochrane Database Syst Rev. 2021 Oct 27;10(10):CD013265. doi: 10.1002/14651858.CD013265.pub2. Cochrane Database Syst Rev. 2021. PMID: 34706066 Free PMC article.
-
Interventions for preventing occupational irritant hand dermatitis.Cochrane Database Syst Rev. 2018 Apr 30;4(4):CD004414. doi: 10.1002/14651858.CD004414.pub3. Cochrane Database Syst Rev. 2018. PMID: 29708265 Free PMC article.
Cited by
-
Is Occupation a Risk Factor for Developing Inflammatory Bowel Disease? A Case-Control Study.Crohns Colitis 360. 2023 Oct 20;5(4):otad065. doi: 10.1093/crocol/otad065. eCollection 2023 Oct. Crohns Colitis 360. 2023. PMID: 37941599 Free PMC article.
-
Characterizing Important Dietary Exposure Sources of Perfluoroalkyl Acids in Inuit Youth and Adults in Nunavik Using a Feature Selection Tool.Environ Health Perspect. 2024 Apr;132(4):47014. doi: 10.1289/EHP13556. Epub 2024 Apr 29. Environ Health Perspect. 2024. PMID: 38683744 Free PMC article.
-
Exposome-wide association study of thyroid function using U.S. National Health and Nutrition Examination Survey data.Environ Res. 2025 Mar 15;269:120884. doi: 10.1016/j.envres.2025.120884. Epub 2025 Jan 17. Environ Res. 2025. PMID: 39828196 Free PMC article.
-
High-Throughput Transcriptomics of Nontumorigenic Breast Cells Exposed to Environmentally Relevant Chemicals.Environ Health Perspect. 2024 Apr;132(4):47002. doi: 10.1289/EHP12886. Epub 2024 Apr 3. Environ Health Perspect. 2024. PMID: 38568856 Free PMC article.
-
Global research trends on the human exposome: a bibliometric analysis (2005-2024).Environ Sci Pollut Res Int. 2025 Mar;32(13):7808-7833. doi: 10.1007/s11356-025-36197-7. Epub 2025 Mar 8. Environ Sci Pollut Res Int. 2025. PMID: 40056347 Free PMC article. Review.
References
-
- Lim SS, Vos T, Flaxman AD, et al. A comparative risk assessment of burden of disease and injury attributable to 67 risk factors and risk factor clusters in 21 regions, 1990–2010: A systematic analysis for the Global Burden of Disease Study 2010. Lancet Published online 2012; doi:10.1016/S0140-6736(12)61766-8 - PMC - PubMed
-
- Stanaway JD, Afshin A, Gakidou E, et al. Global, regional, and national comparative risk assessment of 84 behavioural, environmental and occupational, and metabolic risks or clusters of risks for 195 countries and territories, 1990–2017: a systematic analysis for the Global Burden of Disease Stu. Lancet 2018;392(10159):1923–1994. - PMC - PubMed
-
- Brenner SA, Neu-Baker NM, Caglayan C, Zurbenko IG.. Occupational exposure to airborne nanomaterials: an assessment of worker exposure to aerosolized metal oxide nanoparticles in semiconductor wastewater treatment. J Occup Environ Hyg. 2015;12(7):469–481. - PubMed
Grants and funding
LinkOut - more resources
Full Text Sources