. 2022 May;137(2):1139-1179.
doi: 10.1093/qje/qjab043. Epub 2021 Nov 13.

ORIGINS OF THE OPIOID CRISIS AND ITS ENDURING IMPACTS

Affiliations

ORIGINS OF THE OPIOID CRISIS AND ITS ENDURING IMPACTS

Abby Alpert et al. Q J Econ. 2022 May.

Abstract

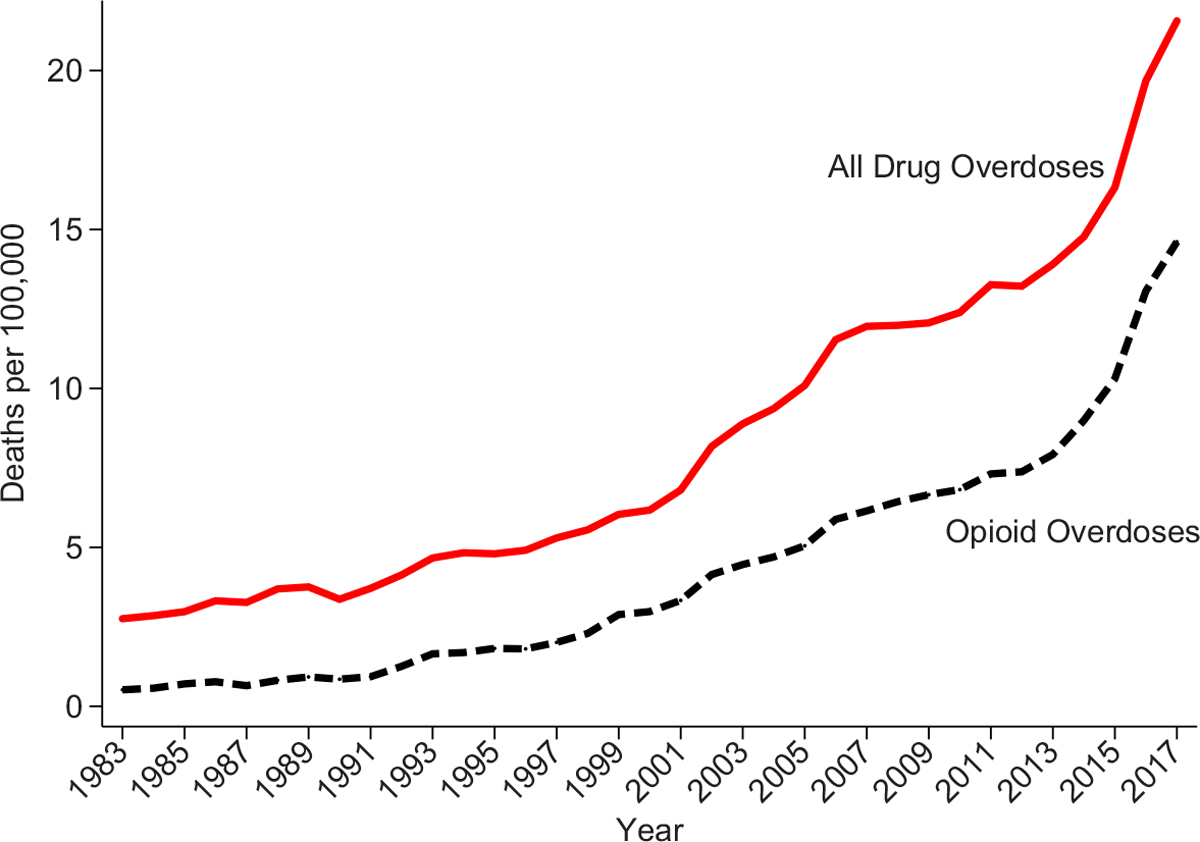
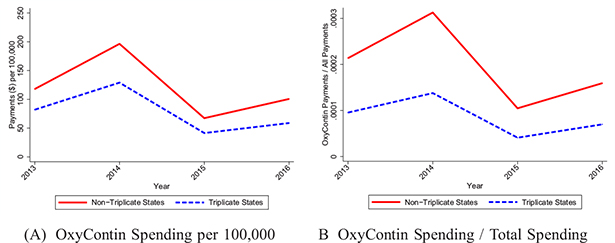
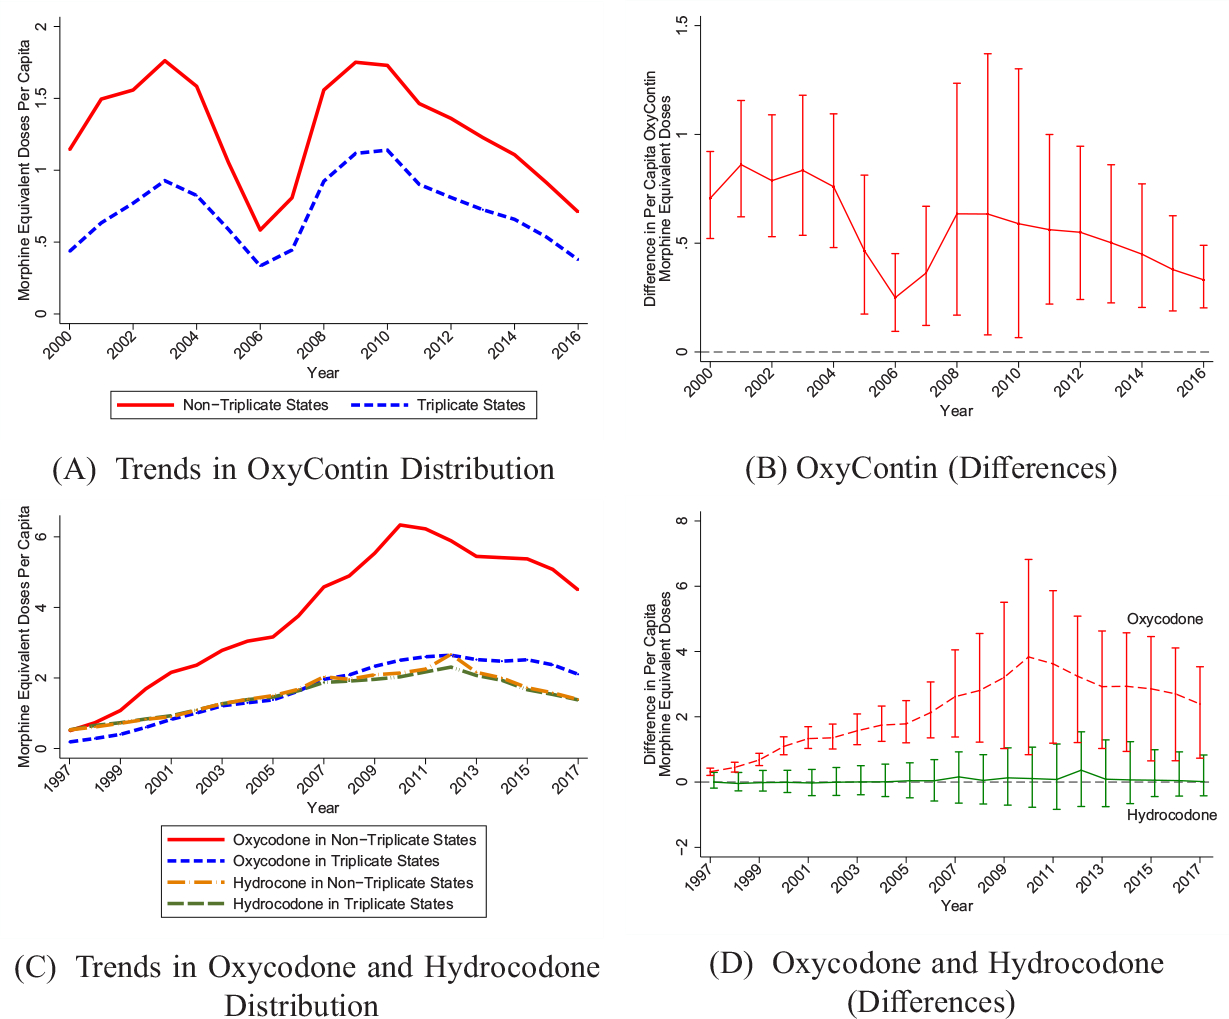
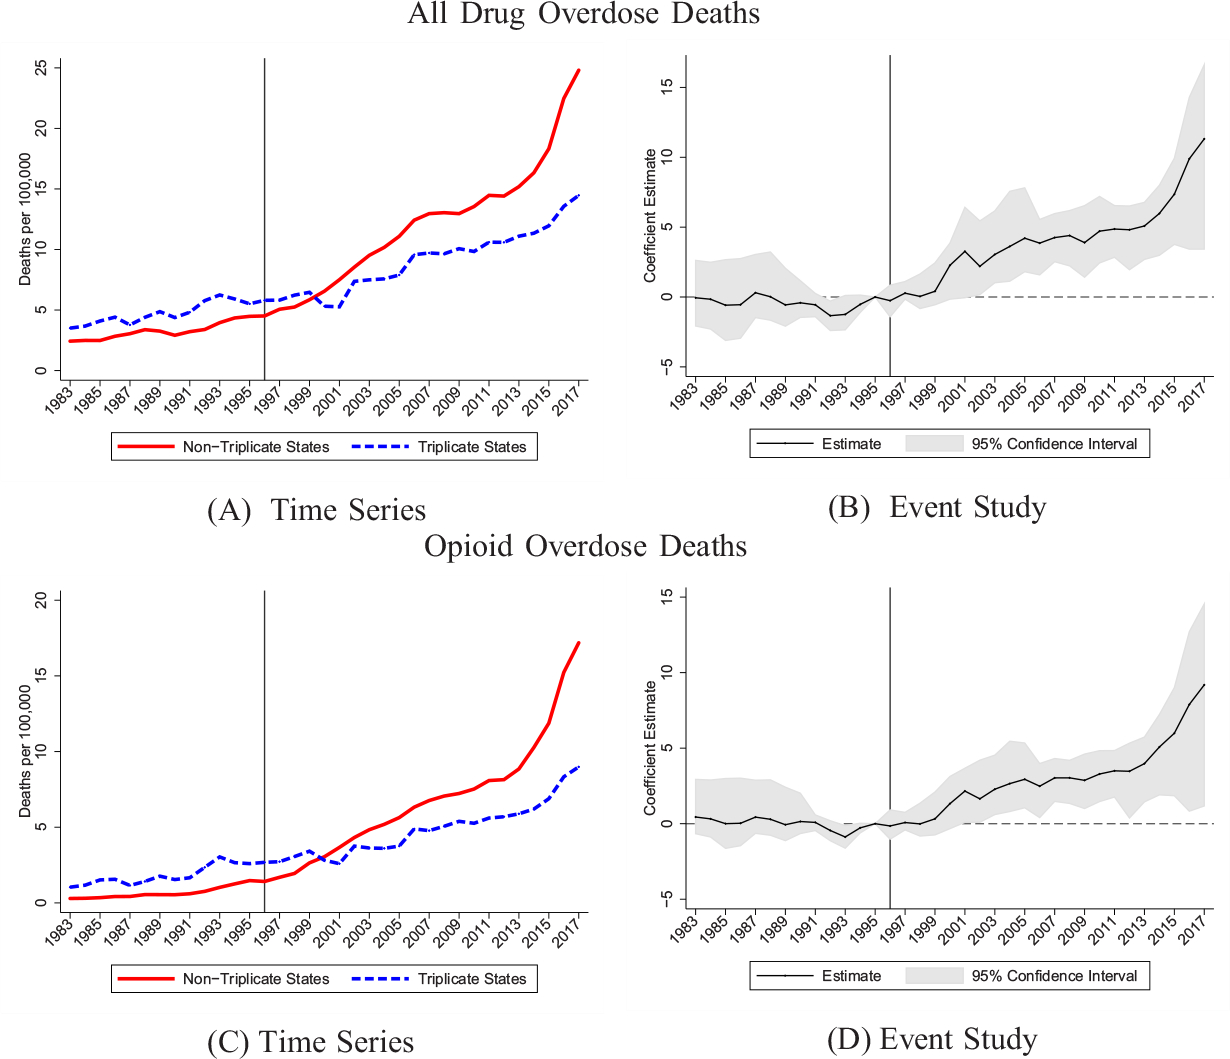
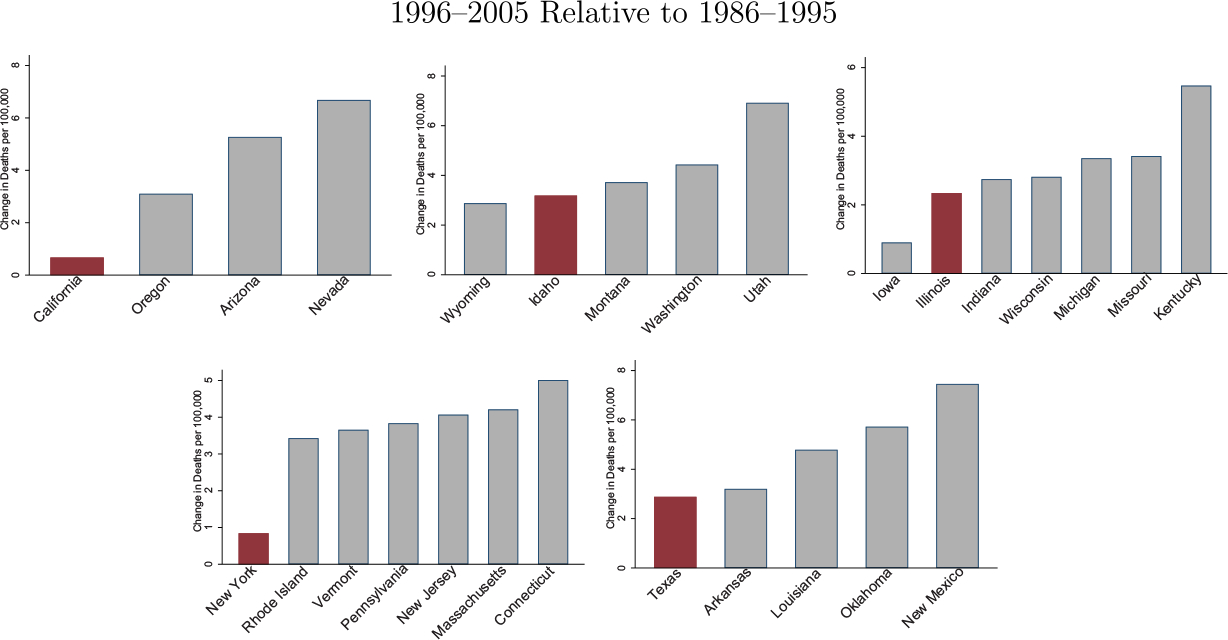
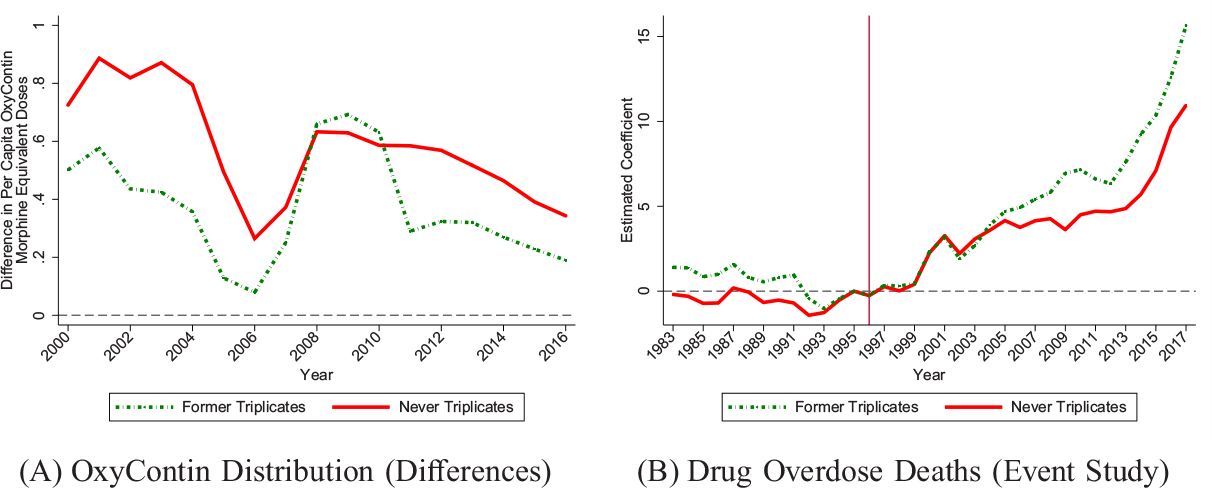
Overdose deaths involving opioids have increased dramatically since the 1990s, leading to the worst drug overdose epidemic in U.S. history, but there is limited empirical evidence about the initial causes. In this article, we examine the role of the 1996 introduction and marketing of OxyContin as a potential leading cause of the opioid crisis. We leverage cross-state variation in exposure to OxyContin's introduction due to a state policy that substantially limited the drug's early entry and marketing in select states. Recently unsealed court documents involving Purdue Pharma show that state-based triplicate prescription programs posed a major obstacle to sales of OxyContin and suggest that less marketing was targeted to states with these programs. We find that OxyContin distribution was more than 50% lower in "triplicate states" in the years after the drug's launch. Although triplicate states had higher rates of overdose deaths prior to 1996, this relationship flipped shortly after the launch and triplicate states saw substantially slower growth in overdose deaths, continuing even 20 years after OxyContin's introduction. Our results show that the introduction and marketing of OxyContin explain a substantial share of overdose deaths over the past two decades.

Keywords: I12; I18.


Figures

Figure I
Figure I
National Drug Overdose Death Rates We use geocoded NVSS data to construct all drug overdose and opioid overdose deaths per 100,000. See Section III.A for ICD codes used in each period. Opioid overdoses are defined as overdoses that report opioid involvement (including natural/semisynthetic opioids, methadone, heroin, and synthetic opioids). These overdoses may or may not also include nonopioid substances.
Figure II
Figure II
OxyContin Promotional Payments to Physicians We used CMS Open Payments Data to calculate total payments and gifts made to physicians regarding OxyContin (presented in nominal dollars). In Panel A, we scaled this measure by population. In Panel B, we scaled this measure by total promotional spending (across all drugs). The outcomes correspond to August 2013–December 2016. Because the 2013 data only cover a partial year, we annualize the rate in that year.
Figure III
Figure III
Differences in Opioid Distribution by Triplicate Status We use ARCOS data, converted to morphine equivalent doses. Panel A shows raw (per capita) means for OxyContin. Panel C shows raw (per capita) means for oxycodone and hydrocodone in separate trend lines. Estimates in Panels B and D represent cross-sectional differences corresponding to Panels A and C, respectively. 95% confidence intervals are generated using a clustered (at state) wild bootstrap. All figures are population weighted.
Figure IV
Figure IV
Drug Overdose Death Rates by Triplicate Status We use geocoded NVSS data to construct all drug overdose and opioid overdose deaths per 100,000. See Section III.A for exact ICD codes used in each period. Event study models include state and year fixed effects. 95% confidence intervals are generated using a clustered (at state) wild bootstrap. Estimates are normalized to zero in 1995. Weighted by population.
Figure V
Figure V
Drug Overdose Death Rate Changes: Triplicate States versus Bordering States We construct the change in all drug overdose deaths per 100,000 for 1996–2005 relative to 1986–1995. We plot this change for each triplicate state relative to its bordering states.
Figure VI
Figure VI
Former Triplicate States: OxyContin Distribution and Drug Overdose Deaths Panel A estimates the annual differences in OxyContin morphine equivalent doses per capita between never-triplicate and triplicate states and the annual differences between former-triplicate and triplicate states. Panel B estimates our main event study for all drug overdoses per 100,000 (as in Figure IV) using the triplicate states as the comparison group, allowing separate coefficients for never-triplicate states and former-triplicate states. The event study model estimated in Panel B includes state and year fixed effects. Regressions are population weighted.

References

    1. Abadie Alberto, Diamond Alexis, and Hainmueller Jens, “Synthetic Control Methods for Comparative Case Studies: Estimating the Effect of California’s Tobacco Control Program,” Journal of the American Statistical Association, 105 (2010), 493–505.
    1. ———, “Comparative Politics and the Synthetic Control Method,” American Journal of Political Science, 59 (2015), 495–510.
    1. Agha Leila, and Zeltzer Dan, “Drug Diffusion through Peer Networks: The Influence of Industry Payments,” American Economic Journal: Economic Policy (forthcoming). - PMC - PubMed
    1. Alexander Monica J., Kiang Mathew V., and Barbieri Magali, “Trends in Black and White Opioid Mortality in the United States, 1979–2015,” Epidemiology, 29 (2018), 707. - PMC - PubMed
    1. Alpert Abby, Evans William N., Lieber Ethan M. J., and Powell David, “Replication Data for: ‘Origins of the Opioid Crisis and Its Enduring Impacts,”‘ Harvard Dataverse (2021), 10.7910/DVN/P866NB. - DOI - PMC - PubMed