. 2022 Jun 22;25(7):104654.
doi: 10.1016/j.isci.2022.104654. eCollection 2022 Jul 15.

Contribution of septins to human platelet structure and function

Affiliations

Contribution of septins to human platelet structure and function

Oleg V Kim et al. iScience. .

Abstract

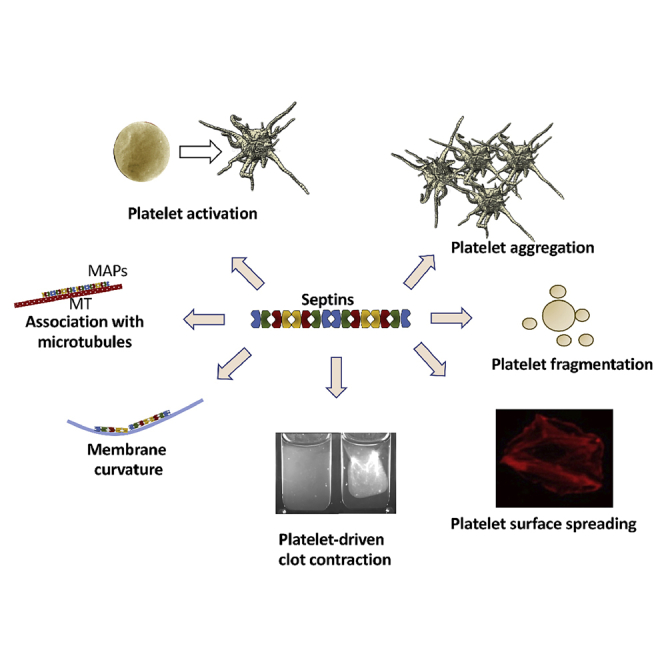
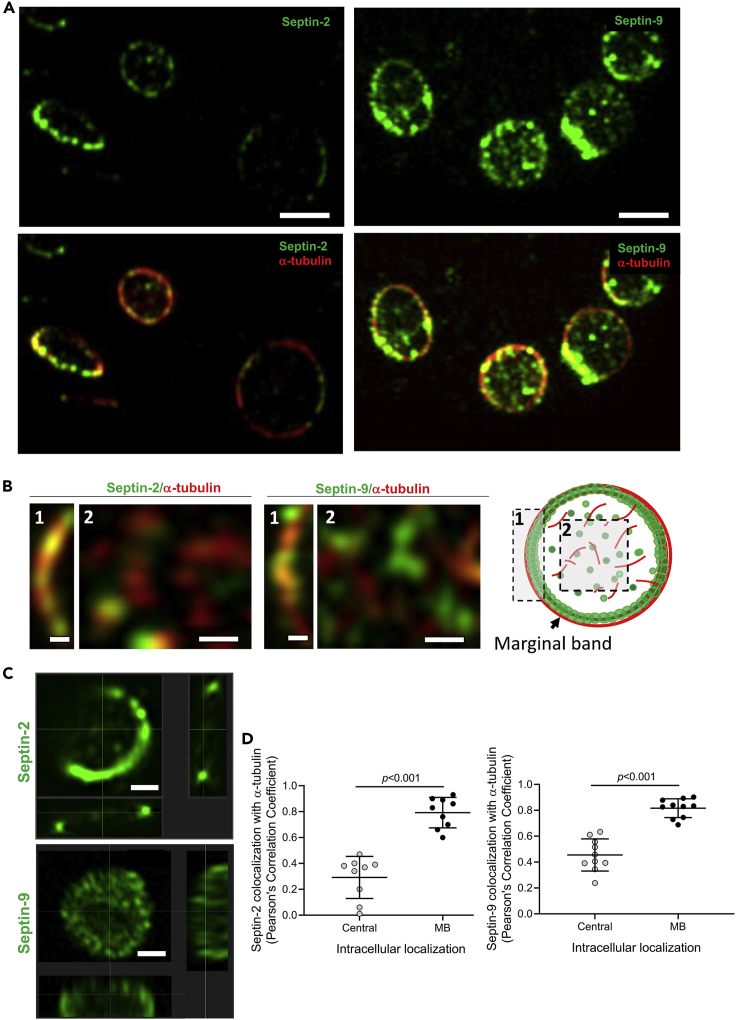
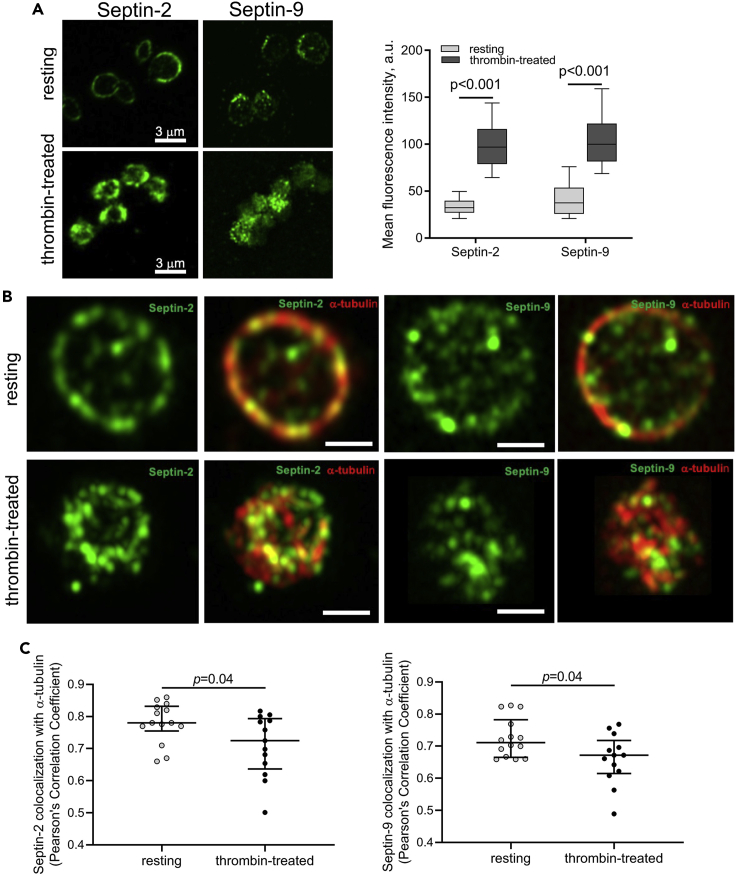
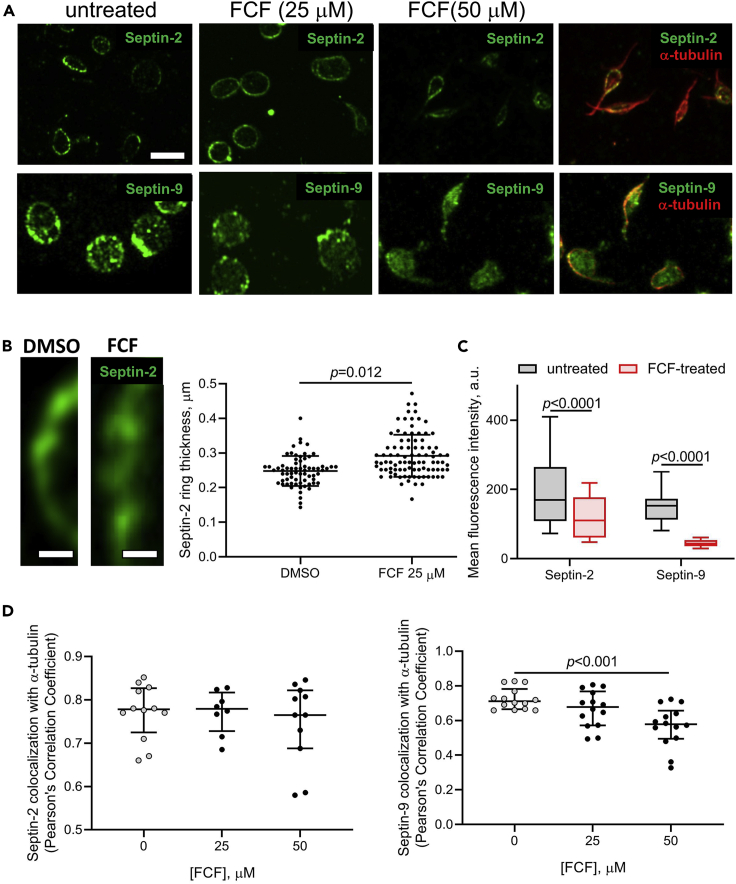
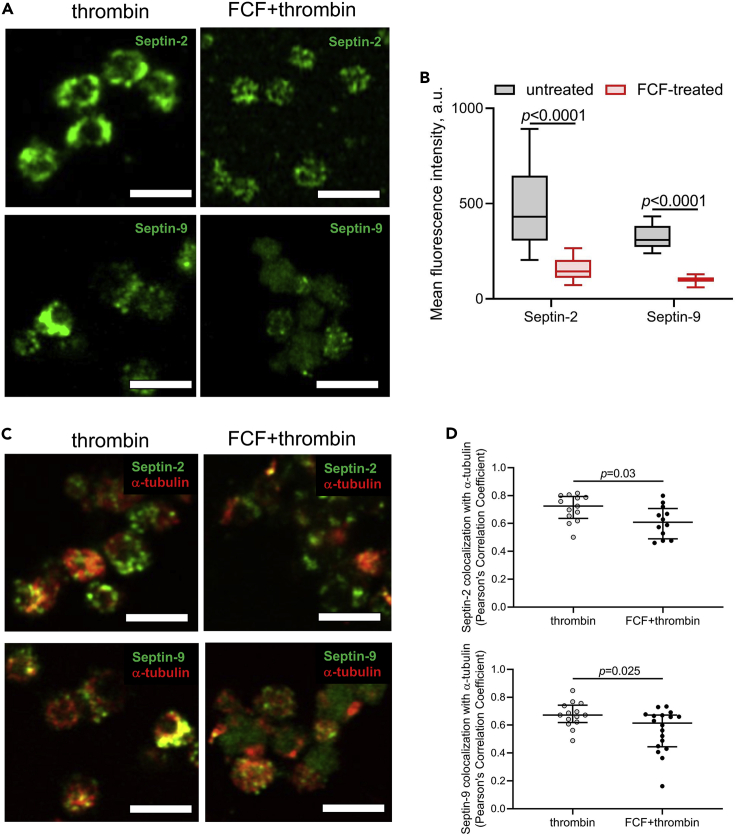
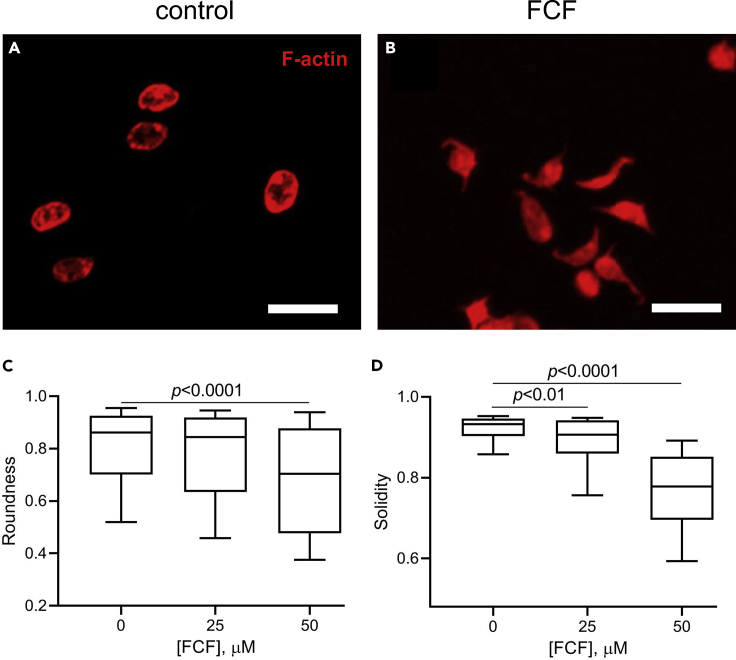
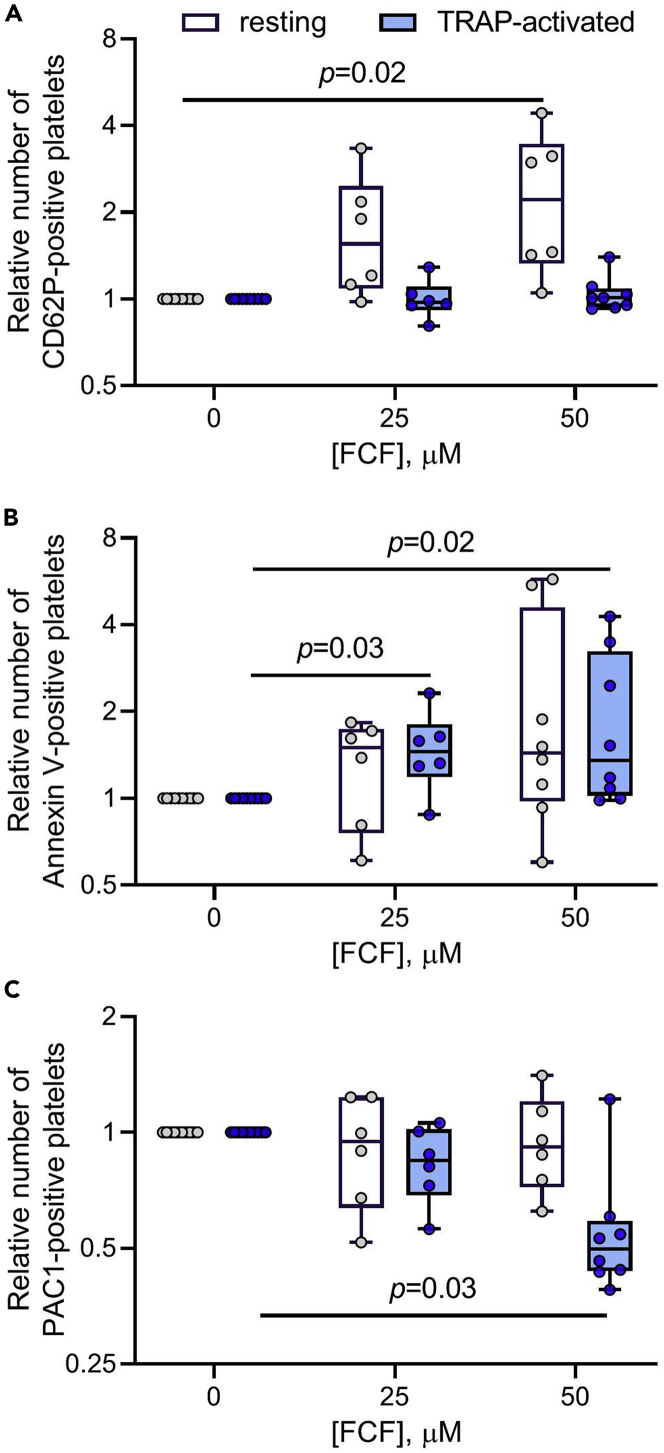
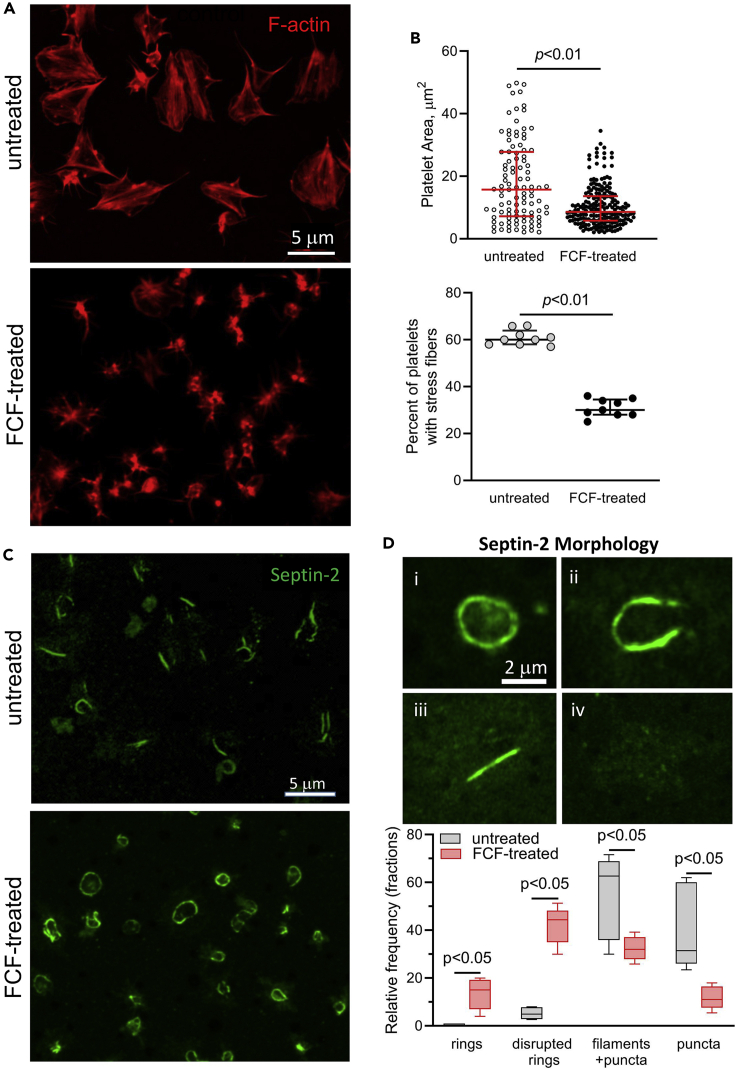
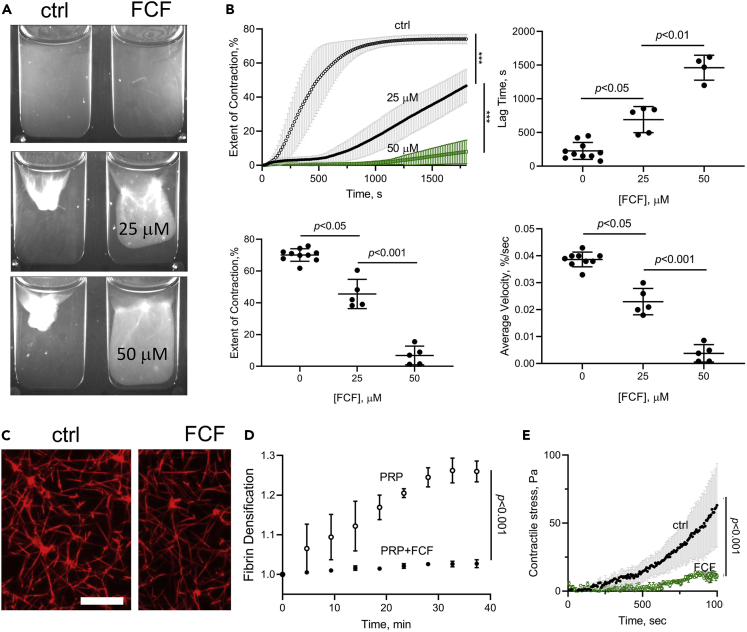
Although septins have been well-studied in nucleated cells, their role in anucleate blood platelets remains obscure. Here, we elucidate the contribution of septins to human platelet structure and functionality. We show that Septin-2 and Septin-9 are predominantly distributed at the periphery of resting platelets and co-localize strongly with microtubules. Activation of platelets by thrombin causes clustering of septins and impairs their association with microtubules. Inhibition of septin dynamics with forchlorfenuron (FCF) reduces thrombin-induced densification of septins and lessens their colocalization with microtubules in resting and activated platelets. Exposure to FCF alters platelet shape, suggesting that septins stabilize platelet cytoskeleton. FCF suppresses platelet integrin αIIbβ3 activation, promotes phosphatidylserine exposure on activated platelets, and induces P-selectin expression on resting platelets, suggesting septin involvement in these processes. Inhibition of septin dynamics substantially reduces platelet contractility and abrogates their spreading on fibrinogen-coated surfaces. Overall, septins strongly contribute to platelet structure, activation and biomechanics.

Keywords: Biological sciences; Cell biology; Functional aspects of cell biology; Integrative aspects of cell biology.


Conflict of interest statement

The authors declare no competing interests.

Figures

None
Graphical abstract
Figure 1
Figure 1
Schematic representation of the organization of septins and their involvement in cell functions (A) Septin domain structure comprises a GTP-binding domain, a phosphoinositide-binding polybasic region (PBR), a septin unique domain (SUD), and one or several coiled-coil domains (Cavini et al., 2021). The lengths of N- and C- terminus vary among different septins(Trimble, 1999). Septin inhibitor, forchlorfenuron (FCF), interacts with the Walker A motif, preventing septin binding and hydrolysis (Angelis et al., 2014). (B) Septin homology-based subgoups. Septins are classified into four distinct subgroups based on amino acid sequence similarity (Kinoshita, 2003). (C) Canonical heterooligomeric complexes of septins formed by alternate G-G and N-C interfaces and septins higher order structures (Sirajuddin et al., 2009). (D) The most well defined involvements of septins in cellular functions (Dolat et al., 2014a; Ivanov et al., 2021).
Figure 2
Figure 2
Differential distribution of Septin-2 and Septin-9 within resting platelets and their colocalization with microtubules (A) Confocal microscopy of unstimulated platelets immunostained for Septin-2, Septin-9, and α-tubulin. Septin-2 forms a ring-like circular structure strongly co-localized with the microtubule marginal band. Septin-9 is located both in the central part and cell periphery where it is co-localized with α-tubulin. Scale bar = 1 μm. The images are the projections of optical z stack slices. (B) Zoomed-in views of co-stained Septin-2/α-tubulin and Septin-9/α-tubulin (B left) at the platelet peripheral marginal band (MB, “1”) and central compartment (Central, “2”) regions, schematically illustrated in (B right). (C) Spatial distributions of Septin-2 and Septin-9 in a single platelet shown in orthogonal cross-sections of a reconstructed 3D image. Scale bar = 0.6 μm. (D) Quantification of the degree of colocalization between Septin-2 and α-tubulin and Septin-9 and α-tubulin for the platelet peripheral marginal band and the central part, schematically illustrated in (B). The fluorescence correlation between Septin-2, Septin-9 and α-tubulin shown as Pearson’s correlation coefficient (PCC) (D). The results are presented as a median and IQR; significance tested by the Wilcoxon matched-pairs signed rank test.
Figure 3
Figure 3
Redistribution of Septin-2 and Septin-9 in platelets upon thrombin-induced activation (A, left) Confocal microscopy of platelets stained for Septin-2 and Septin-9 in resting and thrombin-treated platelets. Scale bar = 3 μm. (A, right) Mean fluorescence intensity of a whole cell for Septin-2 (n = 110) and Septin-9 (n = 110) measured at the identical settings of a confocal fluorescent microscope, computed as the mean intensity value of all the non-background signal. A two-tailed Mann-Whitney U test. (B) Distributions of Septin-2, Septin-9 and α-tubulin in a platelet before (top row) and after (bottom row) treatment of platelets with thrombin. Scale bar = 1 μm. Projections of optical z stack slices. (C) Changes in colocalization between Septin-2 and tubulin in resting and thrombin-activated platelets. Quantification of colocalization between Septin-2, Septin-9 and α-tubulin based on the fluorescence intensity correlation analysis and presented in terms of Pearson correlation coefficients (PCC). The results are presented as a median and IQR. Significance tested by the Mann-Whitney U-test.
Figure 4
Figure 4
Structural rearrangements of Septin-2 and Septin-9 in resting platelets induced by FCF, the inhibitor of septin dynamics (A) Representative immunofluorescence images of Septin-2, Septin-9 and α-tubulin in DMSO-treated (control) and FCF-treated resting platelets showing dose-dependent intraplatelet structural alterations by FCF. Scale bar = 3 μm. Projections of optical z stack slices. (B) FCF-induced changes in the thickness of Septin-2-ring-like circular structures: (left) a segment of the Septin-2 ring in the absence and presence of FCF; (right) quantification of the Septin-2 ring thickness in untreated and FCF-treated platelets (n > 70, Mean ± SD). Scale bar = 0.4 μm. Significance tested by the two-tailed Mann-Whitney U test. (C) Mean fluorescence intensity of Septin-2 and Septin-9 in the absence (n = 110 cells) and presence (n = 110) of 50 μM FCF measured at the identical settings of a confocal fluorescent microscope. The results are presented as a median and IQR. Significance tested by the Mann-Whitney. (D) FCF-induced changes in the correlation of fluorescence intensity (Pearson) between Septin-2 and α-tubulin (D, left) and Septin-9 and α-tubulin (D, right), showing reduction of the spatial overlap between septins and α-tubulin in the presence of FCF. Data are presented as a median and IQR. Significance tested by the Kruskal-Wallis test with post hoc Dunn’s correction for multiple comparisons. Data in (C and D) are presented as a median and IQR.
Figure 5
Figure 5
Structural alterations induced by a septin inhibitor FCF in thrombin-activated platelets (A) Immunofluorescence confocal microscopy of Septin-2 and Septin-9 in thrombin-activated platelets in the absence and presence of 50 μM of FCF showing decrease of sepins compaction caused by FCF. Scale bar = 3 μm. Projections of optical z stack slices. (B) Images in A quantified in terms of the mean fluorescence intensity measured at the identical settings of a confocal fluorescent microscope (n = 80 cells, Median and IQR). (C) Immunofluorescence microscopy of Septin-2, Septin-9 and α-tubulin in thrombin-activated platelets in the absence and presence of 50 μM of FCF. (D) FCF-induced changes in the fluorescence correlation (Pearson) between Septin-2 and α-tubulin (D, top) and Septin-9 and α-tubulin (D, bottom), displaying reduced spatial association between septins and tubulin. The results are presented as a median and IQR. Significance tested by the Mann-Whitney U-test.
Figure 6
Figure 6
Changes in resting platelet morphology associated with septin perturbations induced by FCF (A and B)Representative confocal microscopy images of DMSO-treated control resting platelets (A) and platelets treated with 50 μM FCF (B). Scale bar = 5 μm. Projections of optical z stack slices. (C and D) Morphometry of FCF-treated resting platelets in terms of platelet roundness (C) and solidity (D) at various FCF concentrations (n = 100, Median and IQR). Gel-filtered platelets were incubated with various FCF concentration for 40 min, followed by fixation, staining for F-actin and imaging. Significance tested by the Kruskal-Wallis test with post hoc Dunn’s correction for multiple comparisons.
Figure 7
Figure 7
Effects of FCF on the expression of molecular markers of activation in resting and TRAP-activated platelets detected using flow cytometry (A) Ratios of the fractions of P-selectin-expressing (CD62-positive) platelets in the presence of FCF and in the absence of FCF (control) taken as 1. (B) Ratios of the fractions of phosphatidylserine expressing (Annexin V-positive) platelets in the presence of FCF and in the absence of FCF (control) taken as 1. (C) Ratios of the fractions of platelets expressing active αIIbβ3 (determined by PAC-1 binding) in the presence of FCF and in the absence of FCF (control) taken as 1. Data are presented as a median and IQR. Significance tested by the Kruskal-Wallis test with post hoc Dunn’s correction for multiple comparisons: significance is shown compared to DMSO-treated control platelets.
Figure 8
Figure 8
Abrogation of platelet spreading and supramolecular structural alterations of Septin-2 induced by FCF in spread platelets (A) Gel-filtered platelets spread on a fibrinogen-coated surface for 60 min, followed by fixation and staining for Septin-2 and F-actin. The images are the projections of optical z stack slices. (B) The degree of platelet spreading in the absence and presence of FCF (50 μM) were quantified in terms of the spread area per platelet. The effect of septin dynamics inhibition on formation of stress fibers in spread platelets was evaluated by calculating the fraction of platelets having stress fibers in the presence and absence of FCF (n > 100 cells, Median and IQR). Significance tested by two-tail Mann-Whitney. (C) Representative confocal microscopy images of Septin-2 in isolated platelets spread on fibrinogen for 60 min in the absence and presence of FCF, 50 μM. (D) Four types of Septin-2 structures identified in spread platelets: continuous subcortical rings (i), partially discontinued rings (ii), filamentous structures surrounded by fluorescent puncta (iii), single puncta stained for Septin-2 (iv). Quantification of Septin-2 structures in spread platelets in the absence and presence of FCF in terms of the relative frequency of Septin-2 structures defined in (i-iv). n = 50–80 cells per sample, N = 3 donors, Median and IQR. Significance tested by two-tail Mann-Whitney.
Figure 9
Figure 9
Impaired platelet-driven plasma clot contraction in the presence of FCF (A) Photographic images of contracted platelet-rich-plasma clots in the absence and presence of FCF. Control (left) and FCF-treated (right) PRP clots before (A top) and after (A middle, bottom) contraction at 25 and 50 μM of FCF (final concentration) after 30 min of pre-incubation. Clotting was induced by 1 U/mL thrombin and 26 mM CaCl2 followed by the optical tracking clot contraction. (B) Quantification of clot contraction at various concentrations of FCF. Averaged kinetic curves of clot contraction for PRP with and without FCF (B top, left). Parameters of clot contraction (Mean ± SD, n = 5–10): the lag time (B top, right), the extent of contraction (B bottom, left), the average velocity of contraction (B bottom, right). Significance tested by Kolmogorov-Smirnov (B top, left) and Kruskal-Wallis test with post hoc Dunn’s correction for multiple comparisons; significance shown with respect to control with DMSO (B top right, B bottom).(C and D) Reduced platelet-induced densification of fibrin in the absence and presence of FCF during clot contraction. PRP samples were preincubated without or with 50 μM FCF. (C) Representative fluorescence confocal microscopy images of fibrin networks for a control PRP clot and PRP clot with FCF after 40-min incubation. Projections of optical 10-μm thick z stack slices. Scale bar = 15 μm. (D) Temporal changes of fibrin network densification assessed in terms of its fluorescence intensity relative to fibrin fluorescence in the uncontracted clot at t = 0 (Mean ± SD, n = 4). (E) Temporal changes in platelet contractility in the absence and presence of 50 μM FCF. Significance tested by Kolmogorov-Smirnov test. PRP samples were preincubated without or with 50 μM FCF. Clots were formed between parallel plates of a rheometer and the contractile (normal) force on the movable upper plate was measured (Mean ± SD, n = 3). Clotting was induced with 1 U/mL thrombin and 26 mM CaCl2.

Similar articles

Cited by

References

    1. Aaron J.S., Taylor A.B., Chew T.-L. Image co-localization – co-occurrence versus correlation. J. Cell Sci. 2018;131:jcs211847. doi: 10.1242/jcs.211847. - DOI - PubMed
    1. Ageta-Ishihara N., Miyata T., Ohshima C., Watanabe M., Sato Y., Hamamura Y., Higashiyama T., Mazitschek R., Bito H., Kinoshita M. Septins promote dendrite and axon development by negatively regulating microtubule stability via HDAC6-mediated deacetylation. Nat. Commun. 2013;4:2532. doi: 10.1038/ncomms3532. - DOI - PMC - PubMed
    1. Angelis D., Karasmanis E.P., Bai X., Spiliotis E.T. In silico docking of forchlorfenuron (FCF) to septins suggests that FCF interferes with GTP binding. PLoS One. 2014;9:e96390. doi: 10.1371/journal.pone.0096390. - DOI - PMC - PubMed
    1. Beber A., Taveneau C., Nania M., Tsai F.-C., Di Cicco A., Bassereau P., Lévy D., Cabral J.T., Isambert H., Mangenot S., Bertin A. Membrane reshaping by micrometric curvature sensitive septin filaments. Nat. Commun. 2019;10:420. doi: 10.1038/s41467-019-08344-5. - DOI - PMC - PubMed
    1. Beites C.L., Peng X.-R., Trimble W.S. In: Methods in Enzymology, Regulators and Effectors of Small GTPases. Balch W.E., Der C.J., Hall A., editors. Academic Press; 2001. 52 - expression and analysis of properties of septin CDCrel-1 in exocytosis; pp. 499–510. - DOI - PubMed

LinkOut - more resources