. 2022 Jun 27:16:887713.
doi: 10.3389/fnins.2022.887713. eCollection 2022.

Altered Functional Network Connectivity of Precuneus and Executive Control Networks in Type 2 Diabetes Mellitus Without Cognitive Impairment

Affiliations

Altered Functional Network Connectivity of Precuneus and Executive Control Networks in Type 2 Diabetes Mellitus Without Cognitive Impairment

Jinjian Wu et al. Front Neurosci. .

Abstract

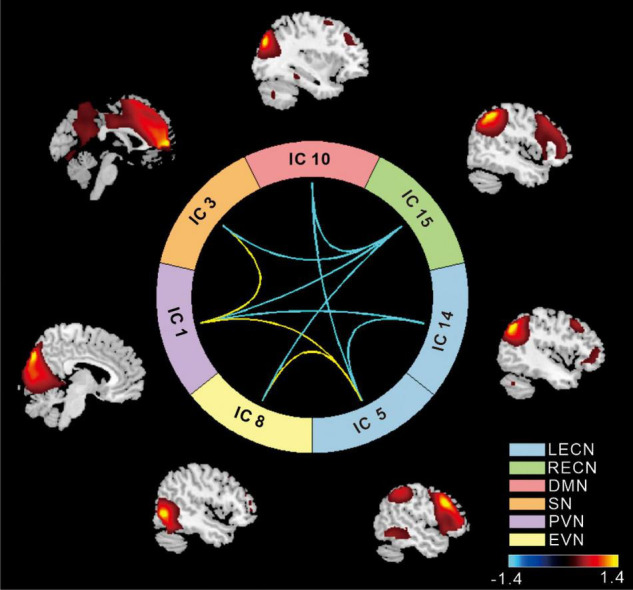
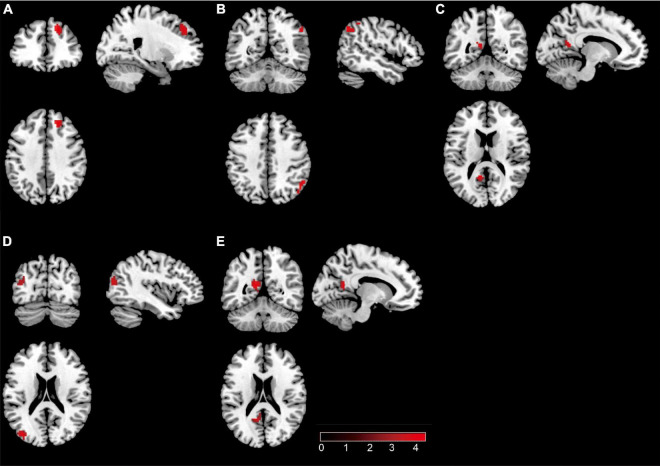
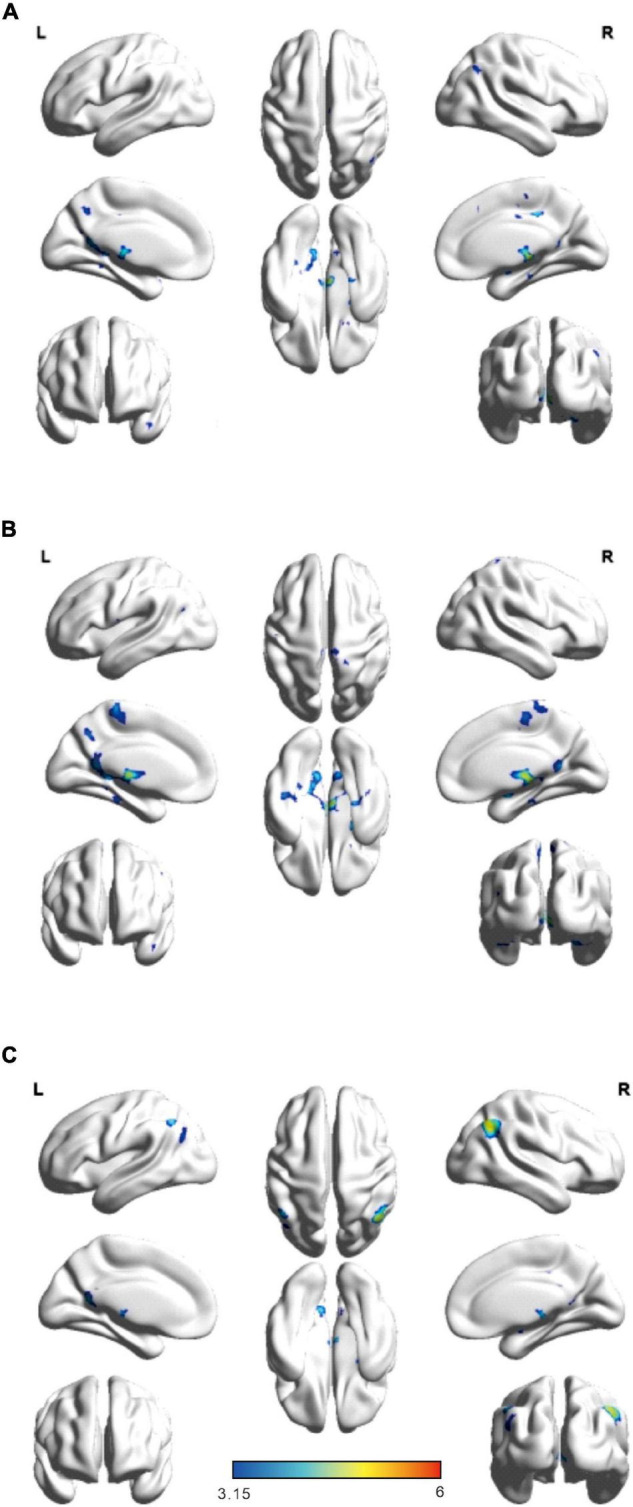
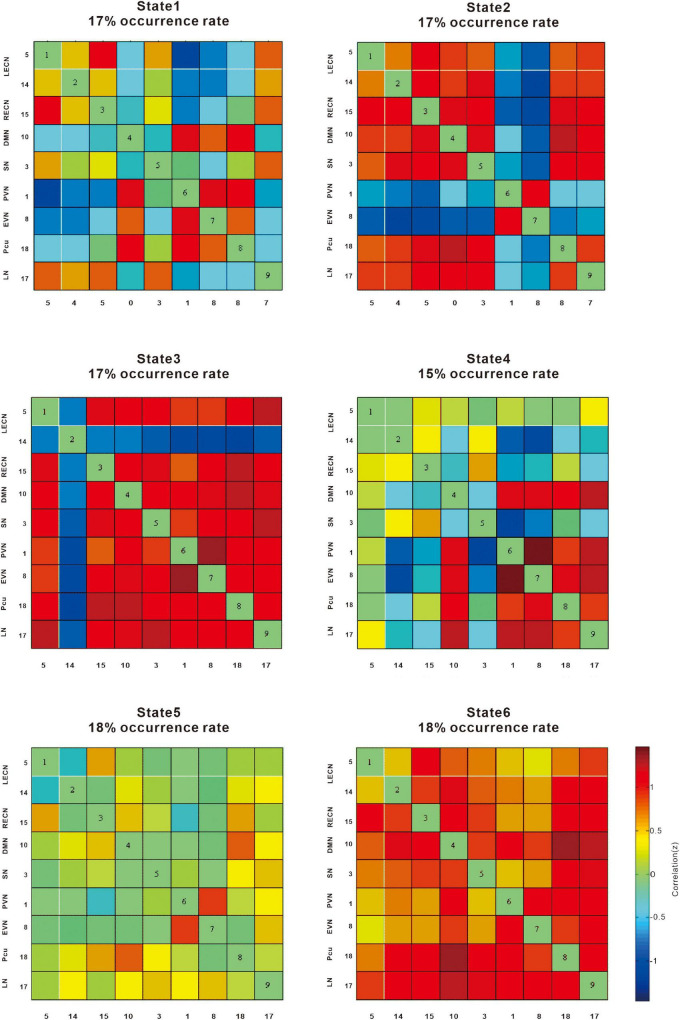
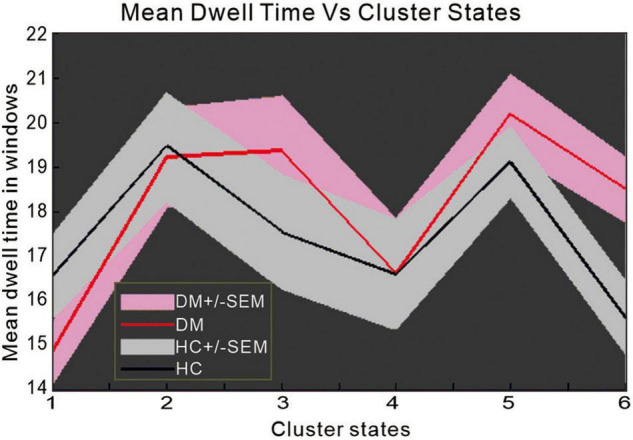
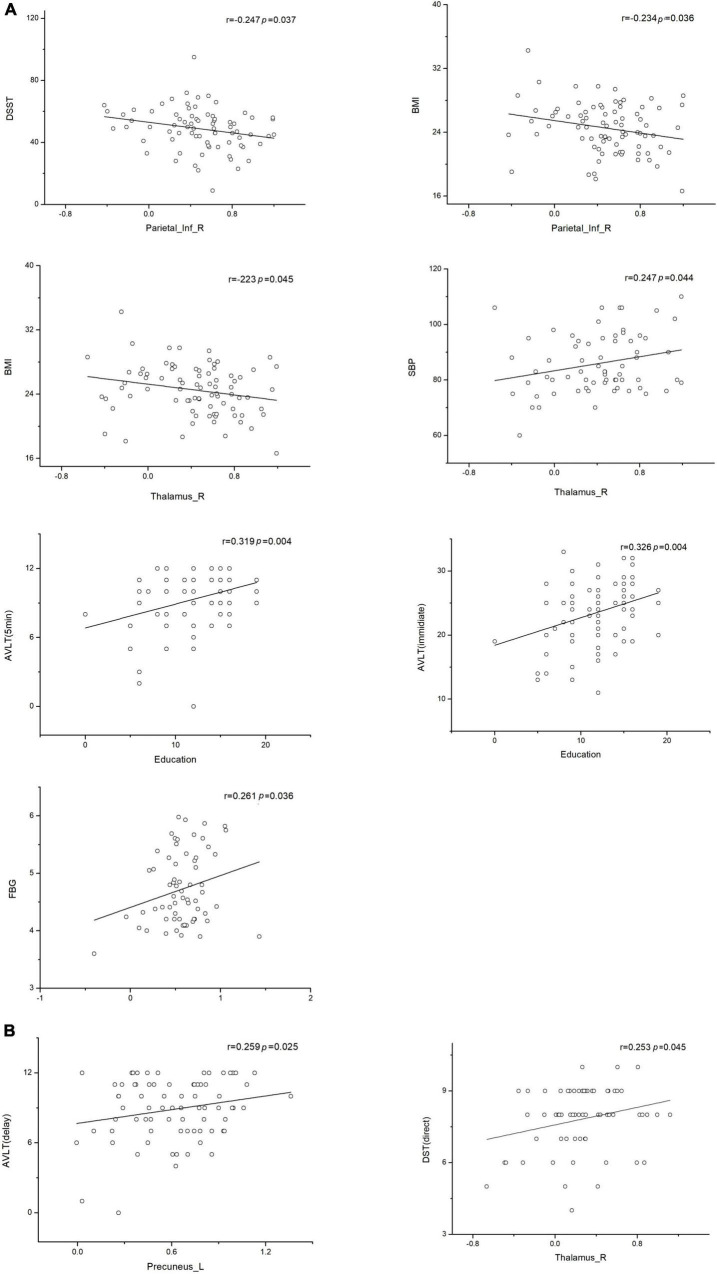
In epidemiological studies, type 2 diabetes mellitus (T2DM) has been associated with cognitive impairment and dementia, but studies about functional network connectivity in T2DM without cognitive impairment are limited. This study aimed to explore network connectivity alterations that may help enhance our understanding of damage-associated processes in T2DM. MRI data were analyzed from 82 patients with T2DM and 66 normal controls. Clinical, biochemical, and neuropsychological assessments were conducted in parallel with resting-state functional magnetic resonance imaging, and the cognitive status of the patients was assessed using the Montreal Cognitive Assessment-B (MoCA-B) score. Independent component analysis revealed a positive correlation between the salience network and the visual network and a negative connection between the left executive control network and the default mode network in patients with T2DM. The differences in dynamic brain network connectivity were observed in the precuneus, visual, and executive control networks. Internal network connectivity was primarily affected in the thalamus, inferior parietal lobe, and left precuneus. Hemoglobin A1c level, body mass index, MoCA-B score, and grooved pegboard (R) assessments indicated significant differences between the two groups (p < 0.05). Our findings show that key changes in functional connectivity in diabetes occur in the precuneus and executive control networks that evolve before patients develop cognitive deficits. In addition, the current study provides useful information about the role of the thalamus, inferior parietal lobe, and precuneus, which might be potential biomarkers for predicting the clinical progression, assessing the cognitive function, and further understanding the neuropathology of T2DM.

Keywords: cognitive impairment; functional magnetic resonance imaging; network connectivity; precuneus; type 2 diabetes mellitus.


Conflict of interest statement

The authors declare that the research was conducted in the absence of any commercial or financial relationships that could be construed as a potential conflict of interest.

Figures

FIGURE 1
FIGURE 1
The cool color scale represents negative values, indicating hypoconnectivity (decreased positive correlation, or greater anti-correlation) in patients with type 2 diabetes mellitus (T2DM) relative to normal controls (NCs); the hot color scale represents positive values, indicating hyperconnectivity (increased positive correlation or less anti-correlation) in patients with T2DM relative to NCs. LECN, left executive control network; RECN, right executive control network; PVN, primary visual network; EVN, extrastriate visual network; SN, salience network; DMN, default mode network (p < 0.05, false discovery rate-corrected).
FIGURE 2
FIGURE 2
The brain regions with a significant difference in patients with type 2 diabetes mellitus. (A) Significant difference in internal network connectivity in the SN. (B) Significant difference in internal network connectivity in the LECN. (C) Significant difference in internal network connectivity in the DMN. (D) Significant difference in internal network connectivity in the SN. (E) Significant difference in internal network connectivity in the precuneus network. The significance threshold was set at p < 0.05 (false discovery rate-corrected).
FIGURE 3
FIGURE 3
Significant brain network regions are rendered on the surface of the automated anatomical labeling atlas in BrainNet Viewer. (A) Significant difference network connectivity in the left executive control network with the whole brain. (B) Significant difference network connectivity in the right executive control network with the whole brain. (C) Significant difference network connectivity in the precuneus network with the whole brain. The significance threshold was set at p < 0.05 (false discovery rate-corrected, cluster size > 20). R, right; L, left.
FIGURE 4
FIGURE 4
The correlation (z) provides information on the effect size. The cool color scale represents negative values, indicating hypoconnectivity (decreased positive correlation, or greater anti-correlation) in patients with type 2 diabetes mellitus (T2DM) relative to normal controls (NCs); the hot color scale represents positive values, indicating hyperconnectivity (increased positive correlation or less anti-correlation) in patients with T2DM relative to NCs. LECN, left executive control network; RECN, right executive control network; Pcu, precuneus network; PVN, primary visual network; EVN, extrastriate visual network; LN, language network; SN, salience network, DMN, default mode network.
FIGURE 5
FIGURE 5
The difference in mean dwell time between patients with type 2 diabetes mellitus and normal controls.
FIGURE 6
FIGURE 6
Associations between functional connectivity and neuropsychological test scores. Pearson correlation was conducted on functional connectivity and neuropsychological test scores. (A) Correlation of functional connectivity with neuropsychological test scores in the type 2 diabetes mellitus group. (B) Correlation of functional connectivity with neuropsychological test scores in the normal control group (p < 0.05 indicates statistically significant differences). L, left; R, right.

References

    1. Adachi Y., Ota K., Minami I., Yamada T., Watanabe T. (2021). Lower insulin secretion is associated with hippocampal and parahippocampal gyrus atrophy in elderly patients with type 2 diabetes mellitus. J. Diabetes Investig. 12 1908–1913. 10.1111/jdi.13554 - DOI - PMC - PubMed
    1. Advocacy guide to the IDF Diabetes Atlas (2019). The International Diabetes Federation. Available online at: https://diabetesatlas.org/upload/resources/material/20200302_133351_IDFA... (accessed October 01, 2021).
    1. Ali M. K., Chwastiak L., Poongothai S., Emmert-Fees K. M. F., Patel S. A., Anjana R. M., et al. (2020). Effect of a collaborative care model on depressive symptoms and glycated hemoglobin, blood pressure, and serum cholesterol among patients with depression and diabetes in india. JAMA 324:651. 10.1001/jama.2020.11747 - DOI - PMC - PubMed
    1. Allen E. A., Damaraju E., Plis S. M., Erhardt E. B., Eichele T., Calhoun V. D. (2014). Tracking whole-brain connectivity dynamics in the resting state. Cereb. Cortex 24 663–676. 10.1093/cercor/bhs352 - DOI - PMC - PubMed
    1. Beeri M. S., Bendlin B. B. (2020). The link between type 2 diabetes and dementia: from biomarkers to treatment. Lancet Diabetes Endocrinol. 8 736–738. 10.1016/S2213-8587(20)30267-9 - DOI - PubMed

LinkOut - more resources