. 2022 Jun 27:16:834890.
doi: 10.3389/fnins.2022.834890. eCollection 2022.

Behavioral and Molecular Consequences of Chronic Sleep Restriction During Development in Fragile X Mice

Affiliations

Behavioral and Molecular Consequences of Chronic Sleep Restriction During Development in Fragile X Mice

R Michelle Saré et al. Front Neurosci. .

Abstract

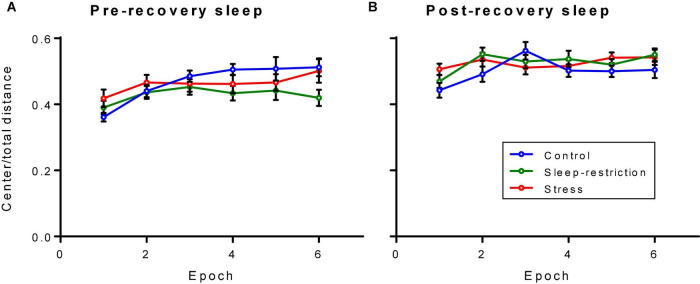
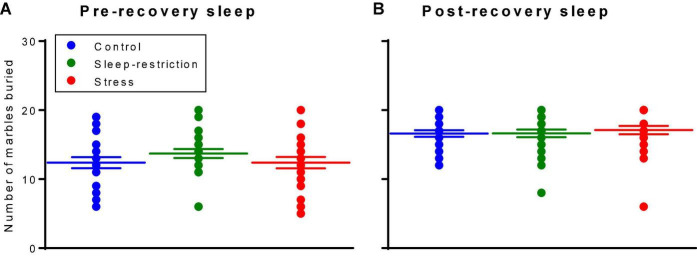
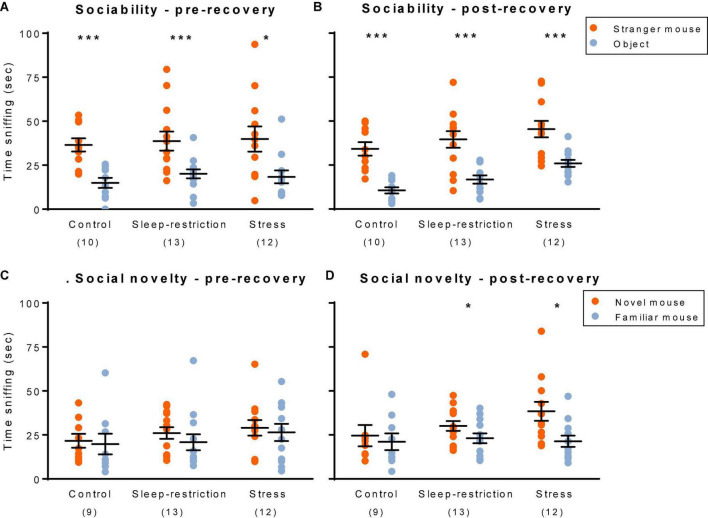
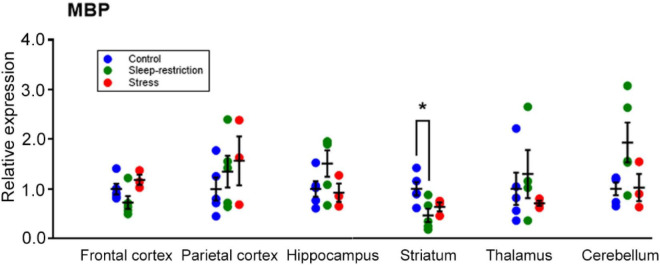
Sleep is critical for brain development and synaptic plasticity. In male wild-type mice, chronic sleep restriction during development results in long-lasting impairments in behavior including hypoactivity, decreased sociability, and increased repetitive behavior. Disordered sleep is characteristic of many neurodevelopmental disorders. Moreover, the severity of behavioral symptoms is correlated with the degree of disordered sleep. We hypothesized that chronic developmental sleep restriction in a mouse model of fragile X syndrome (FXS) would exacerbate behavioral phenotypes. To test our hypothesis, we sleep-restricted Fmr1 knockout (KO) mice for 3 h per day from P5 to P52 and subjected mice to behavioral tests beginning on P42. Contrary to our expectations, sleep restriction improved the hyperactivity and lack of preference for social novelty phenotypes in Fmr1 KO mice but had no measurable effect on repetitive activity. Sleep restriction also resulted in changes in regional distribution of myelin basic protein, suggesting effects on myelination. These findings have implications for the role of disrupted sleep in the severity of symptoms in FXS.

Keywords: autism; chronic sleep restriction; fragile X; gentle handling; mTOR; myelin; social behavior.


Conflict of interest statement

The authors declare that the research was conducted in the absence of any commercial or financial relationships that could be construed as a potential conflict of interest.

Figures

FIGURE 1
FIGURE 1
Mice were weighed every 3 days beginning at P10. Each point is the mean ± SEM for 2–5 controls, 2–5 sleep-restricted mice, and 2–11 stress mice. The exact number of mice at each age is designated for the three groups (i.e., control, sleep-restricted, and stress) as follows: P10 (3, 3, 5); P13 (3, 5, 11); P16 (5, 5, 11); P19 (4, 3, 9); P22 (5, 5, 11); P25 (5, 5, 7); P28 (5, 5, 11); P31 (5, 4, 11); P34 (5, 2, 11); P37 (5, 5, 11); P40 (3, 5, 11); and P42 (2, 4, 2). Data were analyzed by means of ANOVA with the condition as a between-subject factor and age as a within-subject factor. Condition/age mean values were substituted for missing values. Neither the condition × age interaction [F(22,198) = 1.563, p = 0.0581] nor the main effect of condition [F(2,198) = 0.1942, p = 0.1942] was statistically significant, but the main effect of age [F(11,198) = 590.3, p < 0.0001] was, indicating that mice gained weight regardless of condition.
FIGURE 2
FIGURE 2
Corticosterone levels at P9 (A) and P42 (B) were determined by means of a radioimmunoassay. The main effect of age was statistically significant (p < 0.001); mice at P42, regardless of the condition, had higher serum corticosterone levels than mice at P9. The condition × age interaction and main effect of condition were not statistically significant. Each point represents the serum corticosterone concentration in a single animal. Lines represent means ± SEMs for 5 control, 6 stress, and 6 sleep-restricted mice at P9 and 10 control, 9 stress, and 5 sleep-restricted mice at P42.
FIGURE 3
FIGURE 3
We assessed sleep duration during the recovery period beginning at P74. The main effect of phase was statistically significant (p < 0.001). Regardless of the condition, mice slept more in the inactive (light) phase than the active (dark) phase. The main effect of the condition and the condition × age interaction were not statistically significant. Each point represents the sleep duration in a single animal. Lines represent means ± SEMs for the number of mice indicated in parentheses.
FIGURE 4
FIGURE 4
Distance traveled in an open field pre-recovery (P42) (A) and post-recovery (P84) (B). The condition × epoch interaction was statistically significant (p < 0.001). Regardless of age, sleep-restricted mice were less active than control mice in epochs 1, 2, 4, and 5 (p < 0.001, p = 0.002, p = 0.025, and p = 0.030, respectively). Sleep-restricted mice were also less active than stress mice in epochs 1, 2, 4, 5, and 6 (p = 0.039, p = 0.016, p = 0.034, p = 0.011, and p = 0.05, respectively). Each point represents the mean ± SEM for 14, 23, and 22 mice in control, stress, and sleep-restricted groups, respectively.
FIGURE 5
FIGURE 5
Ratio of distance traveled in the center to the total distance traveled in an open field arena pre-recovery (P42) (A) and post-recovery (P84) (B). The condition × epoch interaction trended toward statistical significance (p = 0.059). Regardless of age, control mice traveled less relative distance in the center than stressed mice in epoch 1 (p = 0.051). Each point represents the mean ± SEM for 14, 23, and 22 in control, stress, and sleep-restricted groups, respectively.
FIGURE 6
FIGURE 6
Marble burying assay assessed pre-recovery (P45) and post-recovery (P87). The main effect of age was statistically significant (p < 0.001). Regardless of the condition, mice buried more marbles at P87. Neither the condition × age interaction nor the main effect of condition was statistically significant. Each point represents the number of marbles buried by a single animal. Lines represent means ± SEMs for 23, 26, and 25 in control, stress, and sleep-restricted groups, respectively.
FIGURE 7
FIGURE 7
Social behavior: sociability (A,B) and social novelty (C,D). Sociability pre-recovery (P48) (A) and post-recovery (P90) (B). All three groups showed a statistically significant preference for the stranger mouse both pre- and post-recovery. Social novelty pre-recovery (P48) (C) and post-recovery (P90) (D). Only the sleep-restricted and stress groups showed a preference for the novel mouse and only at the post-recovery time point. Sociability: each point represents the sniffing time for a single animal. Lines represent means ± SEMs for 10, 12, and 13 mice in control, stress, and sleep-restricted groups, respectively. Social novelty: each point represents the sniffing time for a single animal. Lines represent means ± SEMs for 9, 12, and 13 mice in control, stress, and sleep-restricted groups, respectively. Data were analyzed by means of paired t-tests comparing sniffing time for the stranger mouse vs. object pre- and post-recovery (sociability) and for novel vs. familiar mouse (social novelty). Significance levels are indicated on the figure as follows: *, 0.05 ≥ p ≥ 0.01; ***, 0.001 ≥ p.
FIGURE 8
FIGURE 8
Regional expression of MBP and effects of sleep restriction and stress in the frontal cortex, parietal cortex, hippocampus, striatum, thalamus, and cerebellum. Data were normalized to controls for each region. The region × condition interaction was statistically significant (p = 0.008). Bonferroni-corrected post hoc tests showed that sleep restriction resulted in significantly decreased MBP in the striatum relative to controls (p = 0.027). Each point is the normalized value in a single animal. Lines represent means ± SEMs for 5 control, 4 stress, and 5 sleep-restricted mice. *p ≤ 0.05.

Similar articles

Cited by

References

    1. Belmonte M. K., Allen G., Beckel-Mitchener A., Boulanger L. M., Carper R. A., Webb S. J. (2004). Autism and abnormal development of brain connectivity. J. Neurosci. 24 9228–9231. 10.1523/JNEUROSCI.3340-04.2004 - DOI - PMC - PubMed
    1. Boone C. E., Davoudi H., Harrold J. B., Foster D. J. (2018). Abnormal sleep architecture and hippocampal circuit dysfunction in a mouse model of fragile X Syndrome. Neuroscience 384 275–289. 10.1016/j.neuroscience.2018.05.012 - DOI - PubMed
    1. Frank M. G., Morrissette R., Heller H. C. (1998). Effects of sleep deprivation in neonatal rats. Am. J. Physiol. 275 R148–R157. - PubMed
    1. Kazdoba T. M., Leach P. T., Silverman J. L., Crawley J. N. (2014). Modeling fragile X syndrome in the Fmr1 knockout mouse. Intractable Rare Dis. Res. 3 118–133. 10.5582/irdr.2014.01024 - DOI - PMC - PubMed
    1. Kronk R., Bishop E. E., Raspa M., Bickel J. O., Mandel D. A., Bailey D. B., Jr. (2010). Prevalence, nature, and correlates of sleep problems among children with fragile X syndrome based on a large scale parent survey. Sleep 33 679–687. 10.1093/sleep/33.5.679 - DOI - PMC - PubMed