. 2022 Jun 27:9:879901.
doi: 10.3389/fmed.2022.879901. eCollection 2022.

(-)-Epicatechin Provides Neuroprotection in Sodium Iodate-Induced Retinal Degeneration

Affiliations

(-)-Epicatechin Provides Neuroprotection in Sodium Iodate-Induced Retinal Degeneration

Manjuan Peng et al. Front Med (Lausanne). .

Abstract

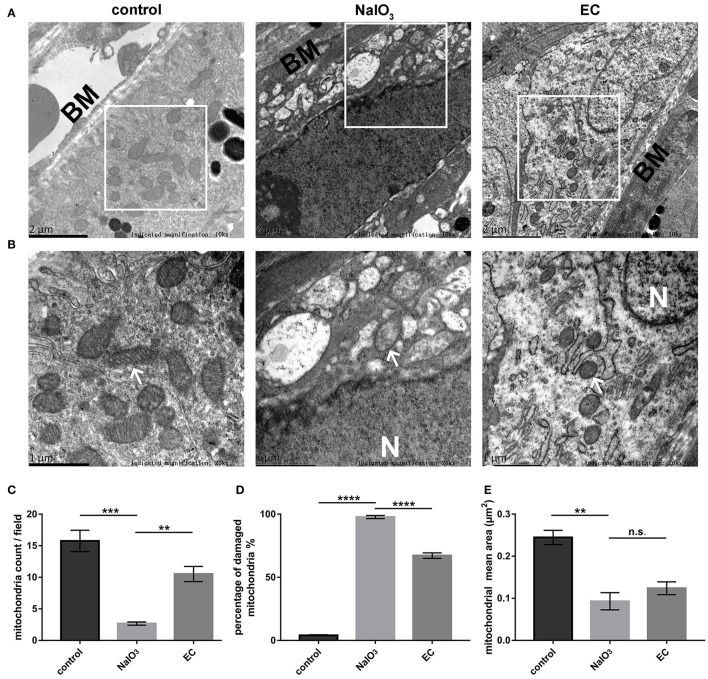
Oxidative stress, mitochondrial impairment, and pathological amyloid beta (Aβ) deposition are involved in the pathogenesis of dry age-related macular degeneration (AMD). The natural flavonoid (-)-epicatechin (EC) is known to be an antioxidant and neuroprotective compound. Whether EC plays a therapeutic role in AMD is unknown. In this work, we aimed to assess the efficacy and molecular mechanisms of EC against sodium iodate (NaIO3)-induced retinal degeneration in C57BL/6 mice via bioinformatic, morphological, and functional methods. We demonstrated that EC had no toxic effects on the retina and could ameliorate retinal deformation and thinning. EC treatment prevented outer retinal degeneration, reduced drusen-like deposits, increased b-wave amplitude in electroretinography, blocked retinal gliosis, and increased the number and quality of mitochondria. Importantly, EC increased the protein expression of OPA1 and decreased the expression of PINK1, indicating the role of EC in mitochondrial fusion that impaired by NaIO3. Moreover, EC downregulated APP and TMEM97 levels, upregulated PGRMC1 levels, and reduced subretinal Aβ accumulation. This study illustrated that EC, which may become a promising therapeutic strategy for AMD, prevented NaIO3-induced retinal degeneration, and this improvement may be associated with the mitochondrial quality control and the TMEM97/PGRMC1/Aβ signaling pathway.

Keywords: (–)-epicatechin; TMEM97; age-related macular degeneration; amyloid beta; mitochondrial dynamics; mitochondrial quality control.


Conflict of interest statement

The authors declare that the research was conducted in the absence of any commercial or financial relationships that could be construed as a potential conflict of interest.

Figures

Figure 1
Figure 1
Safety validation of EC on the retina of C57BL/6 mice. Representative images of (A) fundus photography, (B) OCT, and (C) HE stained sections show no lesions in the EC group, and there is no observable structural change between the two groups. (D) Quantification of the number of nuclei per μm in the ONL. GCL, Ganglion cell layer; INL, inner nuclear layer; ONL, outer nuclear layer; ELM, external limiting membrane; IS/OS, inner segment/outer segment; RPE, retinal pigment epithelium. Values are presented as the mean with SEM, n = 3; n.s., no significance. Scale bar: 50 μm.
Figure 2
Figure 2
EC protects against retinal degeneration caused by NaIO3 administration. (A) The ONL underwent deformation by day 7 after NaIO3 administration, but this damage was ameliorated by EC treatment. Yellow arrows indicate drusen-like melanin deposits. (B) The total area of drusen-like deposits tended to be smaller and reduced in the EC group. (C) The number of nuclei per μm in the ONL was significantly increased in the EC group. (D) Thickness of the ONL and (F) IS/OS layers were measured at 150 μm intervals from the optic nerve head (#, Control vs. NaIO3 group; *, NaIO3 vs. EC group). (E) Mean thickness of the ONL and (G) IS/OS layers. GCL, Ganglion cell layer; INL, inner nuclear layer; ONL, outer nuclear layer; IS/OS, inner segment/outer segment; RPE, retinal pigment epithelium. Values are presented as mean with SEM, n = 4; n.s., no significance; *p < 0.05, **p < 0.01, ***p < 0.001, ****p < 0.0001. Scale bar: 50 μm.
Figure 3
Figure 3
EC reduced outer retinal degeneration induced by NaIO3 administration. (A) Representative color fundus photographs taken at day 7 post-NaIO3 administration showed that EC reduced the number of yellow-white deposits. Black arrows indicate drusen-like deposits. (B) Color fundus photographs were converted to gray scale with retinal degeneration areas show in white. (C) The percentage of retinal degeneration (degeneration area/total area) were quantified. (D) Representative OCT images showed EC reduced hyperreflective foci in the outer retinal layers. White arrows indicate high reflex lesions. GCL, Ganglion cell layer; INL, inner nuclear layer; ONL, outer nuclear layer; ELM, external limiting membrane; RPE, retinal pigment epithelium. Values are presented as mean with SEM; n = 4 or 5. ***p < 0.001, ****p < 0.0001; Scale bar: 50 μm.
Figure 4
Figure 4
EC partially rescued retinal function impaired by NaIO3 administration. (A) Dark-adapted 3.0 ERGs of full-field ERG in the control, NaIO3, and EC groups. (B) A steep decline of a-waves was seen after NaIO3 injection, EC intervention did not exhibit significant benefits on a-wave amplitude. (C) EC exerted marked recovery effects on b-wave amplitude. Values are presented as mean with SEM, n = 5 or 6; n.s., no significance, *p < 0.05, ****p < 0.0001.
Figure 5
Figure 5
Bioinformatics analyses identified DEGs and enriched pathways in AMD (GEO: GSE135092). (A) The DEGs between the two groups are displayed by volcano map, including 344 upregulated genes and 204 downregulated genes (p < 0.05). (B) Enriched GO terms of interest were displayed after GO enrichment analysis of DEGs (p < 0.05). (C) GSEA of the mitochondria-related gene sets enriched in AMD retinas as compared to control retinas (q-value < 0.05). BP, biological process; CC, cellular component; MF, molecular function; NES, normalized enrichment score.
Figure 6
Figure 6
EC reduced astrogliosis and protected Müller cells in NaIO3-treated retinas. (A) Immunofluorescence images show GFAP intensity in the three groups. GFAP (green), DAPI (blue). (B) Quantification of GFAP fluorescence intensity. (C) Immunofluorescence images show GS intensity in the three groups. GS (green), DAPI (blue). (D) Quantification of GS fluorescence intensity. GCL, Ganglion cell layer; INL, inner nuclear layer; ONL, outer nuclear layer; RPE, retinal pigment epithelium; IOD, integrated optical density. Values are presented as the mean with SEM; n = 3. *p < 0.05, **p < 0.01.
Figure 7
Figure 7
RPE mitochondrial morphological changes detected by TEM 7 days after NaIO3 administration. (A) and (B) Representative TEM micrographs show decreased mitochondria numbers, loss of cristae, and mitochondrial vacuolization in the NaIO3 group; EC helped maintain normal mitochondrial morphology. Black BM indicates Bruch's membrane. White arrows indicate mitochondria. White N indicates nucleus. Magnification: 10,000 × (bar = 2 μm) and 20,000 × (bar = 1 μm), respectively. (C) Total number of mitochondria per field were increased in the EC group compared to the NaIO3 group. (D) Percentage of damaged mitochondria per field were decreased in the EC group compared to the NaIO3 group. (E) There was no apparent difference in size of mitochondria between the NaIO3 group and the EC group. Values are presented as mean with SEM; n = 4; n.s., no significance. **p < 0.01, ***p < 0.001, ****p < 0.0001.
Figure 8
Figure 8
Expression of mitochondrial quality control related proteins after EC and NaIO3 co-treatment. (A) Key proteins responsible for mitochondrial fission and fusion, and mitophagy-related proteins PINK1 were measured by Western blot. (B) Corresponding quantification of the relative expression of OPA1 demonstrated an enhancement with EC treatment, but no significant changes were found in (C) MFN2 and (D) DRP1. (E) Quantification analysis showed that the increase of PINK1 was lower with EC treatment. Values are presented as mean with SEM; n = 4; n.s., no significance. *p < 0.05, **p < 0.01.
Figure 9
Figure 9
Role of EC on the expression of APP, TMEM97, PGRMC1, and Aβ in retina treated with NaIO3. (A–D) Representative Western blot images and quantitative analysis of APP, TMEM97, and PGRMC1 levels. (E) Representative immunofluorescence images show sub-RPE Aβ accumulation in the three groups. (F) Quantification of Aβ fluorescence intensity in the RPE and sub-RPE layer. Aβ (red), DAPI (blue). White arrows indicate sub-RPE Aβ deposits. INL, inner nuclear layer; ONL, outer nuclear layer; RPE, retinal pigment epithelium. Values are presented as mean with SEM; n = 3 or 4. *p < 0.05, **p < 0.01, ***p < 0.001.

Similar articles

Cited by

References

    1. Jonas JB, Cheung CMG, Panda-Jonas S. Updates on the epidemiology of age-related macular degeneration. Asia Pac J Ophthalmol. (2017) 6:493–7. 10.22608/APO.2017251 - DOI - PubMed
    1. Wong WL, Su X, Li X, Cheung CM, Klein R, Cheng CY, et al. . Global prevalence of age-related macular degeneration and disease burden projection for 2020 and 2040: a systematic review and meta-analysis. Lancet Glob Health. (2014) 2:e106–16. 10.1016/S2214-109X(13)70145-1 - DOI - PubMed
    1. Khan KN, Mahroo OA, Khan RS, Mohamed MD, McKibbin M, Bird A, et al. . Differentiating drusen: drusen and drusen-like appearances associated with ageing, age-related macular degeneration, inherited eye disease and other pathological processes. Prog Retin Eye Res. (2016) 53:70–106. 10.1016/j.preteyeres.2016.04.008 - DOI - PubMed
    1. Chan CM, Huang DY, Sekar P, Hsu SH, Lin WW. Reactive oxygen species-dependent mitochondrial dynamics and autophagy confer protective effects in retinal pigment epithelial cells against sodium iodate-induced cell death. J Biomed Sci. (2019) 26:40. 10.1186/s12929-019-0531-z - DOI - PMC - PubMed
    1. Feher J, Kovacs I, Artico M, Cavallotti C, Papale A, Balacco Gabrieli C. Mitochondrial alterations of retinal pigment epithelium in age-related macular degeneration. Neurobiol Aging. (2006) 27:983–93. 10.1016/j.neurobiolaging.2005.05.012 - DOI - PubMed

LinkOut - more resources