. 2022 Jun 27:13:868361.
doi: 10.3389/fimmu.2022.868361. eCollection 2022.

Immune Responses Against SARS-CoV-2 WT and Delta Variant in Elderly BNT162b2 Vaccinees

Affiliations

Immune Responses Against SARS-CoV-2 WT and Delta Variant in Elderly BNT162b2 Vaccinees

Michael Jäger et al. Front Immunol. .

Abstract

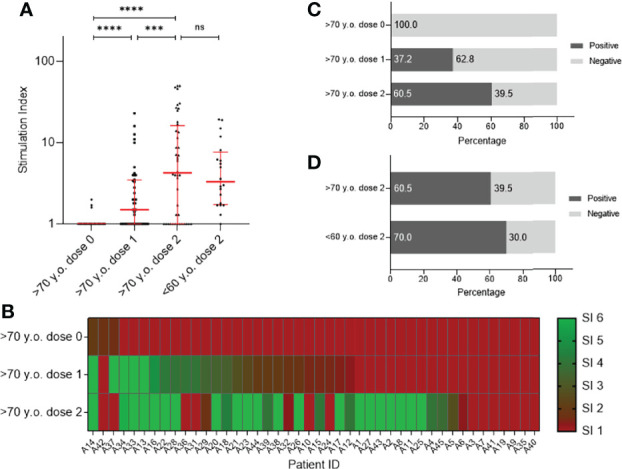
Background: Residents of nursing homes are one of the most vulnerable groups during the severe acute syndrome coronavirus 2 (SARS-CoV-2) pandemic. The aim of this study was to characterize cellular and humoral immune responses in >70-year-old participants before vaccination, after first and second vaccination with BNT162b2, in contrast to second-dose-vaccinated participants younger than 60 years.

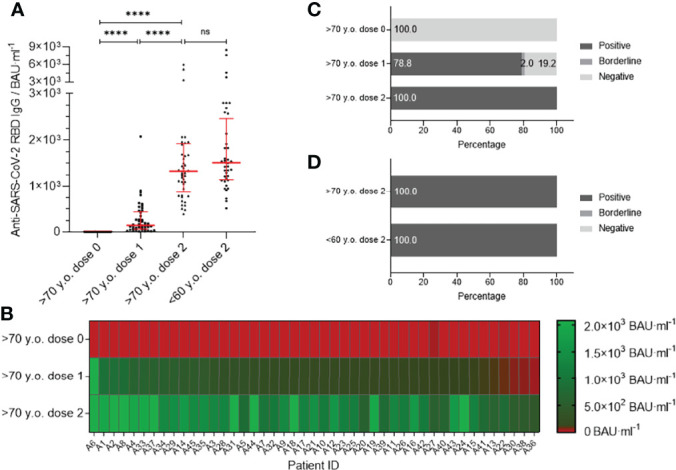
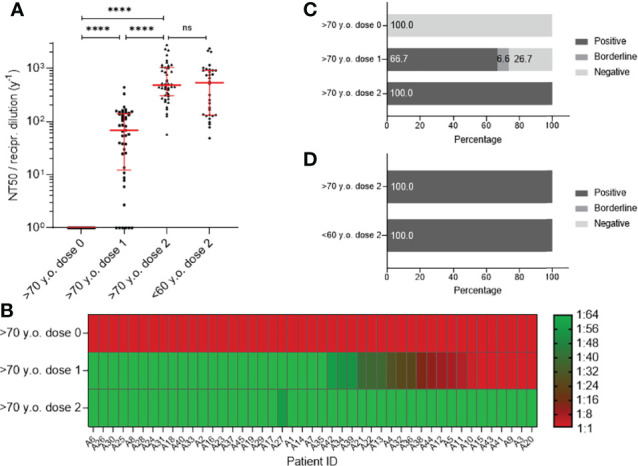
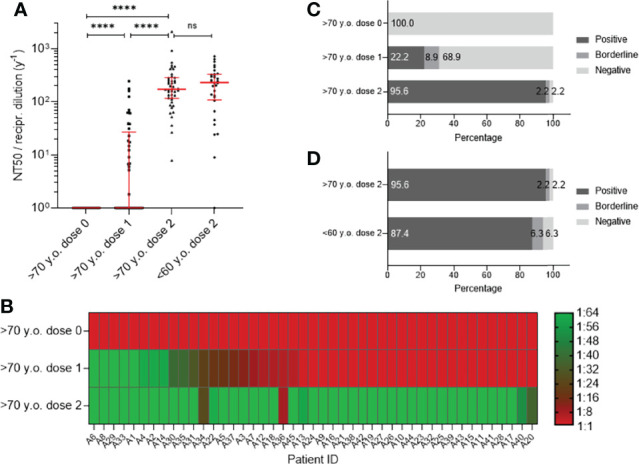
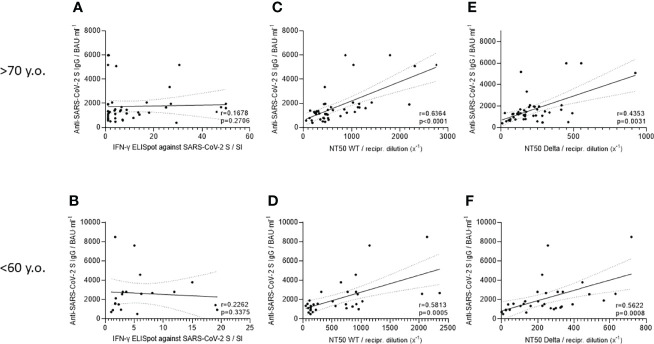
Methods: Peripheral blood mononuclear cells of 45 elderly and 40 younger vaccinees were analyzed by IFNγ ELISpot, specific immunoglobulin G antibody titers against SARS-CoV-2 spike protein, and neutralization abilities against SARS-CoV-2 wild-type (WT) and Delta variant (B.1.617.2).

Results: Our results clearly demonstrate a significantly increased T cell response, IgG titers, and neutralization activities against SARS-CoV-2 WT and Delta between first and second vaccination with BNT162b2 in elderly vaccinees, thereby highlighting the importance of the second booster. Interestingly, similar cellular and humoral immune responses against SARS-CoV-2 WT and Delta were found after the second vaccine dose in the young and elderly groups.

Conclusions: Our data demonstrate a full picture of cellular and humoral immune responses of BNT162b2-vaccinees in two age cohorts. In all vaccines, SARS-CoV-2 WT-specific antibodies with similar neutralizing activity were detected in all vaccinees. After the second vaccination, neutralization titers against SARS-CoV-2 Delta were impaired in both age groups compared with SARS-CoV-2 WT, thereby emphasizing the need for an additional booster to overcome rising variants of SARS-CoV-2.

Keywords: Age-dependent immune responses after BNT162b2; COVID-19; SARS-CoV-2; SARS-CoV-2 vaccination; T cell immunity; neutralizing antibodies; variants of concern (VOCs); virus neutralization.


Conflict of interest statement

Authors SS and GW were employed by Dr. Gernot Walder GmbH, Ausservillgraten, Austria. The remaining authors declare that the research was conducted in the absence of any commercial or financial relationships that could be construed as a potential conflict of interest.

Figures

Figure 1
Figure 1
Analysis of T cells against SARS-CoV-2 spike using sera from participants older than 70 years (n = 45) before vaccination (dose 0), after first- (dose 1) and after second vaccination (dose 2) with BNT162b2 in contrast to fully vaccinated participants younger than 60 years (n = 20). The ELISpot assays were performed using precoated human SARS-CoV-2-specific IFNγ ELISPOT kits. Results are presented as a Stimulation Index (SI). (A) T cell responses against SARS-CoV-2 spike are shown as individual progression for each person (>70 y.o.) until full immunization with BNT162b2. In contrast, individual SARS-CoV-2 T cell responses are illustrated for people younger than 60 years of age fully vaccinated with BNT162b2. Medians are visualized together with the interquartile range as an error bar. Statistical significance between values of the three different time points for the group >70 y.o. was determined using the Wilcoxon test. A Mann–Whitney–U test for nonparametric distribution was applied for comparison of immune responses between the two age groups. [p > 0.05 not significant (ns), p ≤ 0.001 (***) and p≤ 0.0001 (****)]. (B) Heat map visualizing individual progression of T cell response against SARS-CoV-2 spike before and after vaccination with BNT162b2. Illustrated colors shift from red for a negative to green for a positive antibody status. (C) Percentages of participants with positive or negative T cell response against SARS-CoV-2 spike is shown for time points before-, after the first- and second vaccination. (D) Comparison of percentages of persons older than 70 years and people younger than 60 years with positive or negative T cell response against SARS-CoV-2 Spike after second vaccination.
Figure 2
Figure 2
SARS-CoV-2 antibody titer analysis using sera from participants older than 70 years (n = 45) before vaccination (dose 0), after first- (dose 1) and after second vaccination (dose 2) with BNT162b2 in contrast to second dose vaccinated participants younger than 60 years of age (n = 40). Experiments for participants were executed with chemiluminescent immunoassay DiaSorin Trimeric S® IgG against SARS-CoV-2-S. Results are presented in binding antibody units per ml of serum (BAU·ml−1). (A) IgG antibody titers against SARS-CoV-2 S domain are shown as individual progression for each person until full immunization with BNT162b2. In contrast, individual anti-SARS-CoV-2 IgG titers are illustrated for people younger than 60 years fully vaccinated with BNT162b2. Medians are visualized together with the interquartile range as an error bar. Statistical significance between values of the three different time points for the group >70 y.o. was determined using the Wilcoxon test. A Mann–Whitney–U test for nonparametric distribution was applied for comparison of immune responses between the two age groups. [p > 0.05 not significant (ns), and p ≤ 0.0001 (****)]. (B) Heat map for visualization of individual IgG antibody titer progression against SARS-CoV-2 S domain before and after vaccination with BNT162b2. Illustrated colors shift from red for a negative to green for a positive antibody status. (C) Percentages of participants positive, borderline or negative for IgG antibodies against SARS-CoV-2 S1 are shown for time points before-, after the first and second vaccination. (D) Comparison of percentages of persons older than 70 years and people younger than 60 years positive, borderline or negative for IgG antibodies against SARS-CoV-2 S.
Figure 3
Figure 3
Analysis of neutralization titer (NT50) against SARS-CoV-2 WT using sera from participants older than 70 years (n = 45) before vaccination (dose 0), after first- (dose 1), and after second vaccination (dose 2) with BNT162b2, in contrast to fully vaccinated participants younger than 60 years (n = 32). Neutralization titers are presented as a dilution factor for serum (1:x). (A) Individual NT50 values are shown as individual progressions for each person until full immunization with BNT162b2. In contrast, individual titers for 50% neutralization are illustrated for people younger than 60 years of age fully vaccinated with BNT162b2. Medians are visualized together with the interquartile range as an error bar. Statistical significance between values of the three different time points for the group >70 y.o. was determined using the Wilcoxon test. A Mann–Whitney–U test for nonparametric distribution was applied for comparison of immune responses between the two age groups. [p > 0.05 not significant (ns), and p ≤ 0.0001 (****)]. (B) Heat map for visualization of NT50 progression against SARS-CoV-2 WT before and after vaccination with BNT162b2. Illustrated colors shift from red for a negative- to green for a positive antibody status. (C) Percentages of participants with positive, borderline or negative for half-maximum neutralization against SARS-CoV-2 WT are shown for time points before-, after the first and second vaccination. (D) Comparison of percentages of persons older than 70 years and people younger than 60 years with positive, borderline or negative half-maximum neutralization of SARS-CoV-2 WT virus.
Figure 4
Figure 4
Analysis of neutralization titer (NT50) against SARS-CoV-2 Delta variant using sera from participants older than 70 years (n = 45) before vaccination (dose 0), after first- (dose 1) and after second vaccination (dose 2) with BNT162b2 in contrast to fully vaccinated participants younger than 60 years (n = 32). Neutralization titers are presented as a dilution factor for serum (1:x). (A) Individual NT50 values are shown as individual progressions for each person until full immunization with BNT162b2. In contrast, individual titers for 50% neutralization are illustrated for people younger than 60 years of age fully vaccinated with BNT162b2. Medians are visualized together with the interquartile range as an error bar. Statistical significance between values at the three different time points for the group >70 y.o. was determined using the Wilcoxon test. A Mann–Whitney–U test for nonparametric distribution was applied for comparison of immune responses between the two age groups. [p > 0.05 not significant (ns), and p ≤ 0.0001 (****)].. (B) Heat map for visualization of NT50 progression against the SARS-CoV-2 WT before and after vaccination with BNT162b2. Illustrated colors shift from red for a negative- to green for a positive antibody status. (C) Percentages of participants with positive, borderline or negative for half-maximum neutralization against SARS-CoV-2 Delta variant are shown for time points before-, after the first and second vaccination. (D) Comparison of percentages of persons older than 70 years and people younger than 60 years with positive, borderline or negative half-maximum neutralization of SARS-CoV-2 Delta virus.
Figure 5
Figure 5
Correlation of T cell response against SARS-CoV-2 spike, anti-SARS-CoV-2 S IgG titer and NT50 values against WT and Delta variant for participants younger than 60 years or older than 70 years. Dependencies between T cell response against SARS-CoV-2 spike, SARS-CoV-2-specific IgG, and NT50 values from SARS-CoV-2 WT and Delta virus were calculated by nonparametric Spearman correlation analysis. Correlations for participants older than 70 years were visualized as (A) T cell response (IFNγ ELISpots) vs. IgG (n = 45), (C) IgG response vs. NT50 values against WT virus (n = 45) and (E) IgG vs. NT50 against Delta variant (n = 45). To improve visualization of the trend, a linear regression with a 95% confidence interval (CI) was plotted. SARS-CoV-2-specific T cells (IFNγ ELISpots) are presented as Stimulation Index (SI), IgG titers in binding antibody units per ml of serum (BAU·ml−1) and NT50 values as a dilution factor for serum (1:x). The same correlations were determined for people younger than 60 years (B) (n = 20), (D) (n = 32), and (F) (n = 32).

Similar articles

Cited by

References

    1. Mueller AL, McNamara MS, Sinclair DA. Why Does COVID-19 Disproportionately Affect Older People? Aging (Albany NY) (2020) 12(10):9959–81. doi: 10.18632/aging.103344 - DOI - PMC - PubMed
    1. Liu Y, Mao B, Liang S, Yang JW, Lu HW, Chai YH, et al. . Association Between Age and Clinical Characteristics and Outcomes of COVID-19. Eur Respir J (2020) 55(5):2001112. doi: 10.1183/13993003.01112-2020 - DOI - PMC - PubMed
    1. Sahin U, Muik A, Vogler I, Derhovanessian E, Kranz LM, Vormehr M, et al. . BNT162b2 Vaccine Induces Neutralizing Antibodies and Poly-Specific T Cells in Humans. Nature (2021) 595(7868):572–7. doi: 10.1038/s41586-021-03653-6 - DOI - PubMed
    1. Polack FP, Thomas SJ, Kitchin N, Absalon J, Gurtman A, Lockhart S, et al. . Safety and Efficacy of the BNT162b2 mRNA Covid-19 Vaccine. N Engl J Med (2020) 383(27):2603–15. doi: 10.1056/NEJMoa2034577 - DOI - PMC - PubMed
    1. McDonald I, Murray SM, Reynolds CJ, Altmann DM, Boyton RJ. Comparative Systematic Review and Meta-Analysis of Reactogenicity, Immunogenicity and Efficacy of Vaccines Against SARS-CoV-2. NPJ Vaccines (2021) 6(1):74. doi: 10.1038/s41541-021-00336-1 - DOI - PMC - PubMed

Publication types

Supplementary concepts