. 2022 Jun 27:13:933721.
doi: 10.3389/fimmu.2022.933721. eCollection 2022.

Revealing the Key MSCs Niches and Pathogenic Genes in Influencing CEP Homeostasis: A Conjoint Analysis of Single-Cell and WGCNA

Affiliations

Revealing the Key MSCs Niches and Pathogenic Genes in Influencing CEP Homeostasis: A Conjoint Analysis of Single-Cell and WGCNA

Weihang Li et al. Front Immunol. .

Abstract

Degenerative disc disease (DDD), a major contributor to discogenic pain, which is mainly resulted from the dysfunction of nucleus pulposus (NP), annulus fibrosis (AF) and cartilage endplate (CEP) cells. Genetic and cellular components alterations in CEP may influence disc homeostasis, while few single-cell RNA sequencing (scRNA-seq) report in CEP makes it a challenge to evaluate cellular heterogeneity in CEP. Here, this study conducted a first conjoint analysis of weighted gene co-expression network analysis (WGCNA) and scRNA-seq in CEP, systematically analyzed the interested module, immune infiltration situation, and cell niches in CEP. WGCNA and protein-protein interaction (PPI) network determined a group of gene signatures responsible for degenerative CEP, including BRD4, RAF1, ANGPT1, CHD7 and NOP56; differentially immune analysis elucidated that CD4+ T cells, NK cells and dendritic cells were highly activated in degenerative CEP; then single-cell resolution transcriptomic landscape further identified several mesenchymal stem cells and other cellular components focused on human CEP, which illuminated niche atlas of different cell subpopulations: 8 populations were identified by distinct molecular signatures. Among which, NP progenitor/mesenchymal stem cells (NPMSC), also served as multipotent stem cells in CEP, exhibited regenerative and therapeutic potentials in promoting bone repair and maintaining bone homeostasis through SPP1, NRP1-related cascade reactions; regulatory and effector mesenchymal chondrocytes could be further classified into 2 different subtypes, and each subtype behaved potential opposite effects in maintaining cartilage homeostasis; next, the potential functional differences of each mesenchymal stem cell populations and the possible interactions with different cell types analysis revealed that JAG1, SPP1, MIF and PDGF etc. generated by different cells could regulate the CEP homeostasis by bone formation or angiogenesis, which could be served as novel therapeutic targets for degenerative CEP. In brief, this study mainly revealed the mesenchymal stem cells populations complexity and phenotypic characteristics in CEP. In brief, this study filled the gap in the knowledge of CEP components, further enhanced researchers' understanding of CEP and their cell niches constitution.

Keywords: WGCNA; cartilage endplate; degenerative disc disease; immune infiltration; multipotent stem cells; single-cell transcriptomic landscape construction.


Conflict of interest statement

The authors declare that the research was conducted in the absence of any commercial or financial relationships that could be construed as a potential conflict of interest.

Figures

Figure 1
Figure 1
The whole diagram and workflow of this study.
Figure 2
Figure 2
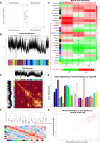
Comprehensive weighted gene co-expression network analysis. (A), Selection of soft threshold power value. Left panel displayed scale-free model fit index of different power values; right panel indicated the mean connectivity of these values. (B), Clustering dendrogram of all genes based on dissimilarity algorithm and assignment modules. (C), Topological overlap heatmap of the weighted co-expression network. Each row and column represented genes, different colors in x and y axis represented different clustered modules. Light area indicated high topological overlap within network. (D), Module-trait correlation heatmap between clinical traits and modules. (E), Histogram of gene significance across modules showed pink module was the most significant module in degenerative CEP group. (F), Cluster dendrogram and heatmap of adjacency eigenvalue in the network. (G), Correlation scatter plot between gene significance and module membership in pink module.
Figure 3
Figure 3
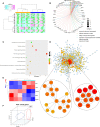
(A), Pink module genes expression heatmap among normal and DDD groups. (B, C), Functional and pathways enrichment analysis of pink module. (D), Construction of PPI network based on genes in pink module, and the top 2 related sub-networks by MCODE algorithm. (E), Hub genes expression heatmap identified in pink module. (F), 3D scatter plot after reducing dimension of hub genes by PCA method.
Figure 4
Figure 4
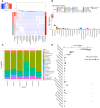
Analysis immune landscape associated with DDD in CEP tissue. (A), Heatmap visualizing the distribution of 22 types of immune cells in CEP tissue from normal and DDD patients. (B), Box plot showing the whole composition of immune cells in these tissues. (C), Pile-up histogram displaying proportion of immune cells in each sample. (D), Differentially analysis of immune infiltration levels between normal and DDD patients.
Figure 5
Figure 5
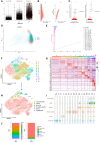
(A), After standard quality control of all cells from CEP tissue of 2 patients, 26209 cells were included in the analysis. (B), The numbers of detected genes were significantly related to the sequencing depth, with a high Pearson’s correlation coefficient 0.96; the numbers of detected mitochondria were the same among different sequencing depth. (C), Variance diagram showed 26418 genes throughout all cells from CEP tissue. Red dots represented highly variable genes and black dots represented non-variable genes. The top 10 most variable genes in each tissue were marked in scatter plot. (D), PCA scatter plot displayed dots distribution after integration analysis, which did not show clear separations of cells. (E), PCA algorithm identified the 20 PCs with an estimated P Value < 0.05. (F), tSNE dimensional reduction method was applied with the top 30 PCs, and 13 cell clusters were classified. (G), Differentially analysis revealed 4295 marker genes. The top 5 genes for each cluster were displayed in heatmap. (H), tSNE plot after cell type annotation for each cluster. (I), Violin plot showed the mean expression of selected marker genes used for annotation in each cell type. (J), Proportion of each cluster and cell type in CEP tissue.
Figure 6
Figure 6
(A), UMAP plot of chondrocytes subtypes, which were extracted from the whole cells and applied for re-UMAP analysis. (B), Sector proportion diagram of chondrocytes before and after cell type annotations. (C), Dot plot displayed the mean expression of selected marker genes among different clusters. (D), UMAP plot after cell type annotation for each cluster. (E), the average expression of mesenchymal stem cell markers for chondrocytes on the tSNE map. (F), Plot of the cytoTRACE pseudotime order for the CEP subpopulations. The value of each cell type in cytoTRACE represented the predicted order. (G), The top 10 correlated genes in the overall cell type differentiation. (H), Overall tSNE plot for each cell based on cytoTRACE algorithm, blue dots represented low differentiated state while red dots represented high differentiated state for cells.
Figure 7
Figure 7
Functional enrichment analysis of different cell populations. (A–H), The top 10 function enrichment analysis for NPMSC, stromal cell, smooth muscle cell, blood cell, endothelial cell, homeostatic chondrocytes, regulatory chondrocytes, and effector chondrocytes, respectively.
Figure 8
Figure 8
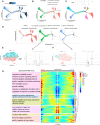
Monocle pesudotime trajectories analysis revealed the chondrocytes cell lineage progression. (A), Trajectory differentiation diagram based on cell differentiated state, dark dots represented the initial state (marked by circle) and light dots represented different 2 cell fates (branch I and II). (B, C), Trajectory differentiation diagram colored by cell types and differentiated states. Cells within initial state were homeostatic chondrocytes. (D), the detailed distribution of different chondrocytes in trajectory plot during differentiation. (E, F), PCA dimension reduction of regulatory and effector chondrocytes based on state 6 and 7, respectively, and differential analysis of genes. (G), Branch trajectory heatmap of the DEGs revealed the gene alterations under different cell differentiation states. The main functions of genes in each cluster were also displayed.
Figure 9
Figure 9
Predicted cell populations regulatory network in CEP. (A), Overall view of the cellular inter-regulatory network. Dot size indicated the relative quantity of each cluster; line thickness represented the relative quantity of significant ligand-receptor pairs. (B), Correlation heatmap revealed the number of potential ligand-receptor pairs between cell groups. (C–F), Bubble plots showing each statistically significant ligand-receptor pair in regulatory chondrocytes, endothelial cells, NPMSC and stromal cells, respectively.

Similar articles

Cited by

References

    1. Katz JN. Lumbar Disc Disorders and Low-Back Pain: Socioeconomic Factors and Consequences. J Bone Joint Surg Am (2006) 88(Suppl 2):21–4. doi: 10.2106/00004623-200604002-00005 - DOI - PubMed
    1. Kido T, Okuyama K, Chiba M, Sasaki H, Seki N, Kamo K, et al. . Clinical Diagnosis of Upper Lumbar Disc Herniation: Pain and/or Numbness Distribution Are More Useful for Appropriate Level Diagnosis. J Orthop Sci (2016) 21(4):419–24. doi: 10.1016/j.jos.2016.03.003 - DOI - PubMed
    1. Grøvle L, Haugen AJ, Natvig B, Brox JI, Grotle M. The Prognosis of Self-Reported Paresthesia and Weakness in Disc-Related Sciatica. Eur Spine J (2013) 22(11):2488–95. doi: 10.1007/s00586-013-2871-9 - DOI - PMC - PubMed
    1. Gorth DJ, Shapiro IM, Risbud MV. Transgenic Mice Overexpressing Human TNF-α Experience Early Onset Spontaneous Intervertebral Disc Herniation in the Absence of Overt Degeneration. Cell Death Dis (2018) 10(1):7. doi: 10.1038/s41419-018-1246-x - DOI - PMC - PubMed
    1. Cloyd JM, Malhotra NR, Weng L, Chen W, Mauck RL, Elliott DM. Material Properties in Unconfined Compression of Human Nucleus Pulposus, Injectable Hyaluronic Acid-Based Hydrogels and Tissue Engineering Scaffolds. Eur Spine J (2007) 16(11):1892–8. doi: 10.1007/s00586-007-0443-6 - DOI - PMC - PubMed

Publication types

MeSH terms