

Performance of Cardiac MRI in Pediatric and Adult Patients with Fontan Circulation
- PMID: 35833165
- PMCID: PMC9274315
- DOI: 10.1148/ryct.210235
Performance of Cardiac MRI in Pediatric and Adult Patients with Fontan Circulation
Abstract
Cardiac MRI has become a widely accepted standard for anatomic and functional assessment of complex Fontan physiology, because it is noninvasive and suitable for comprehensive follow-up evaluation after Fontan completion. The use of cardiac MRI in pediatric and adult patients after completion of the Fontan procedure are described, and a practical and experience-based cardiac MRI protocol for evaluating these patients is provided. The current approach and study protocol in use at the authors' institution are presented, which address technical considerations concerning sequences, planning, and optimal image acquisition in patients with Fontan circulation. Additionally, for each sequence, the information that can be obtained and guidance on how to integrate it into clinical decision-making is discussed. Keywords: Pediatrics, MRI, MRI Functional Imaging, Heart, Congenital © RSNA, 2022.
Keywords: Congenital; Heart; MRI; MRI Functional Imaging; Pediatrics.
© 2022 by the Radiological Society of North America, Inc.
Conflict of interest statement
Disclosures of conflicts of interest: F.P. No relevant relationships. I.V. No relevant relationships. P.G. No relevant relationships. M.R. No relevant relationships. C.I. No relevant relationships. D.J.P. Siemens research grant. S.K. No relevant relationships.
Figures


![Illustration of sites of the through-plane flows used for complete
hemodynamics assessment of patients with Fontan circulation. In the absence
of regurgitant lesions, patent fenestration, or significant
systemic-to-collateral flow, aortic forward flow should be equal to total
systemic venous return (superior vena cava [SVC] + inferior vena cava [IVC]
flows) and also to total pulmonary venous return (right pulmonary veins
[RPVs] + left pulmonary veins [LPVs] flows). Discrepancy in flows should
indicate the presence of any of the aforementioned lesions, whereas
segmental analysis of flows in the circuit may allow quantification of their
entity at each level. Ao = aorta, ECC = extracardiac conduit, LPA = left
pulmonary artery, RPA = right pulmonary artery.](https://cdn.ncbi.nlm.nih.gov/pmc/blobs/fd64/9274315/14e61cf52e70/ryct.210235.fig9.jpg)
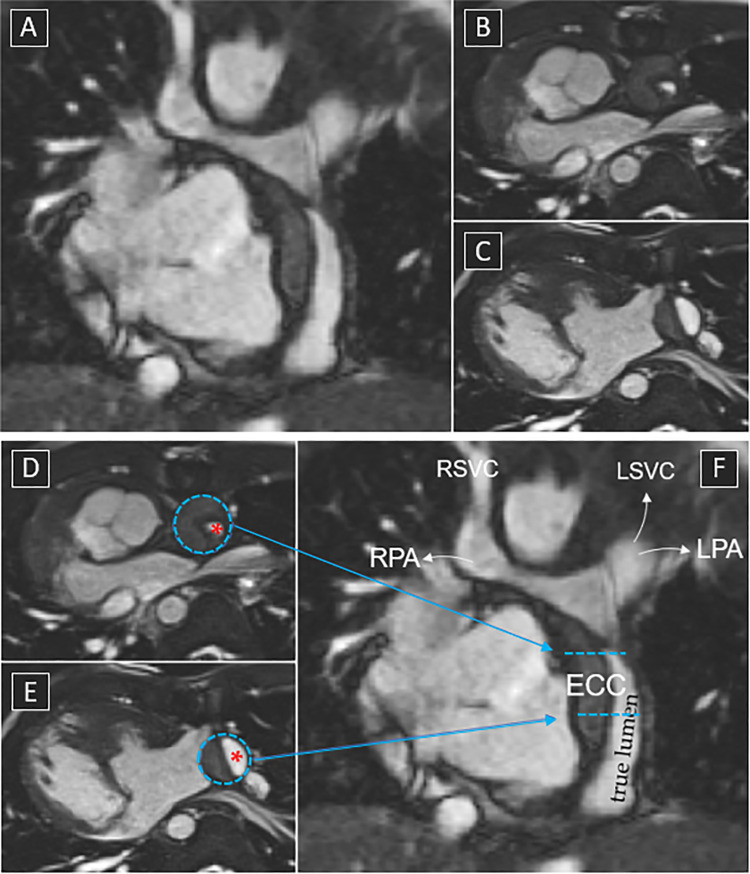
![Flow assessment in a 15-year-old patient with double-outlet right
ventricle and pulmonary atresia after extracardiac Fontan procedure. Flows
are assessed by imaging the vessel perpendicular to its long axis using
phase-contrast imaging. Through-plane velocity maps of the ascending aorta,
superior vena cava (SVC), inferior vena cava (IVC), right pulmonary artery
(RPA), left pulmonary artery (LPA), right pulmonary veins (RPVs), and left
pulmonary veins (LPVs) are shown. The pulmonary arteries appear unobstructed
(RPA:LPA net flow split ratio, approximately 60%:40%). Estimated
systemic-to-pulmonary collateral flow is approximately 10% (systemic
estimator: AO − [SVC + IVC]; pulmonary estimator: [RPV + LPV]
− [RPA + LPA]).](https://cdn.ncbi.nlm.nih.gov/pmc/blobs/fd64/9274315/ae7b050bfa10/ryct.210235.fig10.jpg)


References
-
- Geva T , Powell AJ . Magnetic resonance imaging – Single ventricle and Fontan . In: Allen HD , Driscoll DJ , Shaddy RE , Feltes TF , eds. Moss and Adams’ Heart Disease in Infants, Children, and Adolescents, Including the Fetus and Young Adult . 8th ed. Philadelphia, Pa: : Lippincott Williams & Wilkins, 2013. ; 207 – 246 .
-
- Valsangiacomo Buechel ER , Grosse-Wortmann L , Fratz S , et al. . Indications for cardiovascular magnetic resonance in children with congenital and acquired heart disease: an expert consensus paper of the Imaging Working Group of the AEPC and the Cardiovascular Magnetic Resonance Section of the EACVI . Eur Heart J Cardiovasc Imaging 2015. ; 16 ( 3 ): 281 – 297 . - PubMed
-
- Yeong M , Loughborough W , Hamilton M , Manghat N . Role of cardiac MRI and CT in Fontan circulation . J Congenit Heart Dis 2017. ; 1 : 8 .
-
- Prakash A , Khan MA , Hardy R , Torres AJ , Chen JM , Gersony WM . A new diagnostic algorithm for assessment of patients with single ventricle before a Fontan operation . J Thorac Cardiovasc Surg 2009. ; 138 ( 4 ): 917 – 923 . - PubMed
Publication types
LinkOut - more resources
Full Text Sources
