. 2023 Jan 1;108(1):122-134.
doi: 10.3324/haematol.2022.280757.

RHOA-regulated IGFBP2 promotes invasion and drives progression of BCR-ABL1 chronic myeloid leukemia

Affiliations

RHOA-regulated IGFBP2 promotes invasion and drives progression of BCR-ABL1 chronic myeloid leukemia

Hualei Zhang et al. Haematologica. .

Abstract

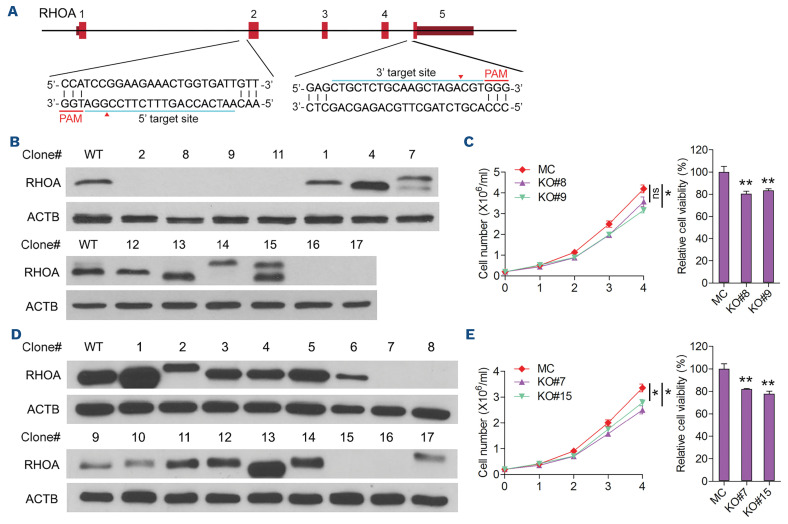
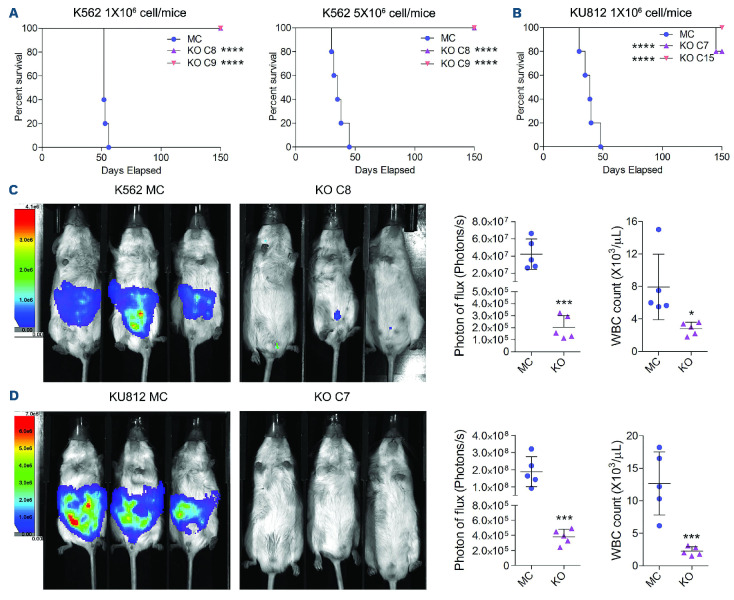
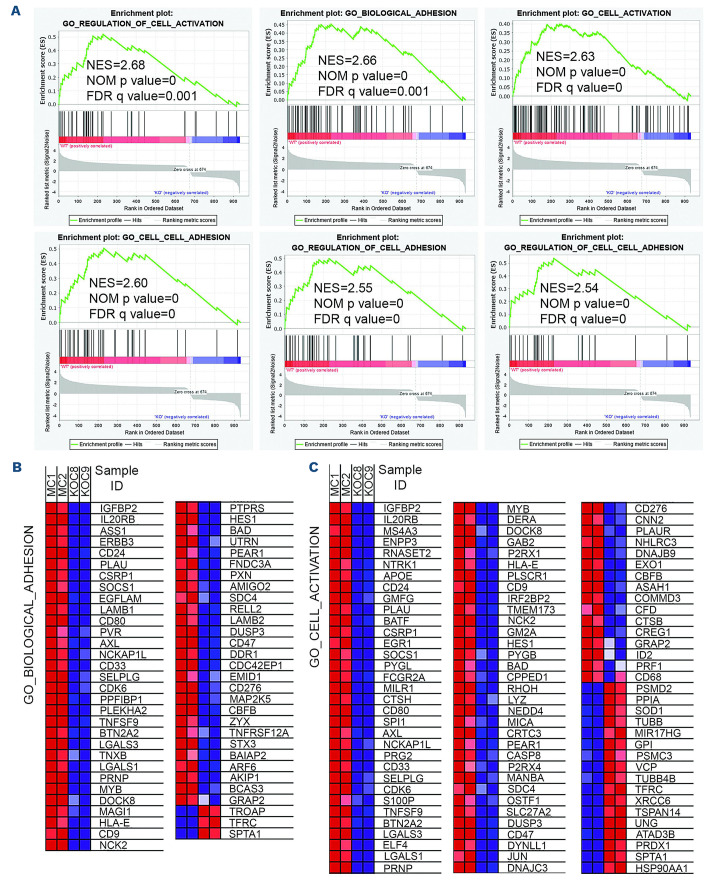
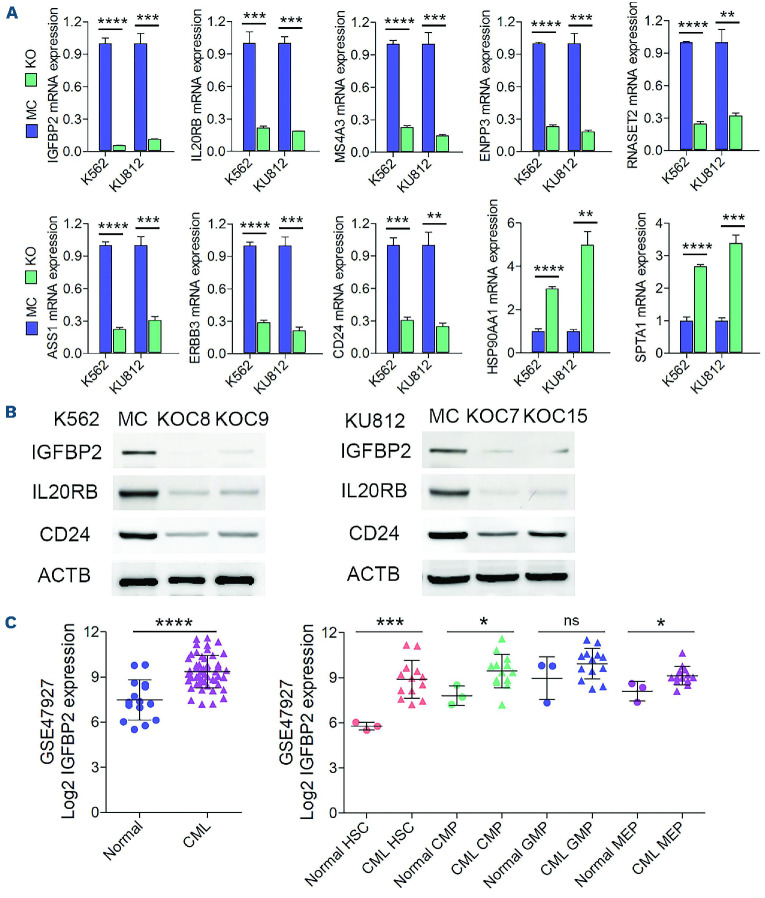
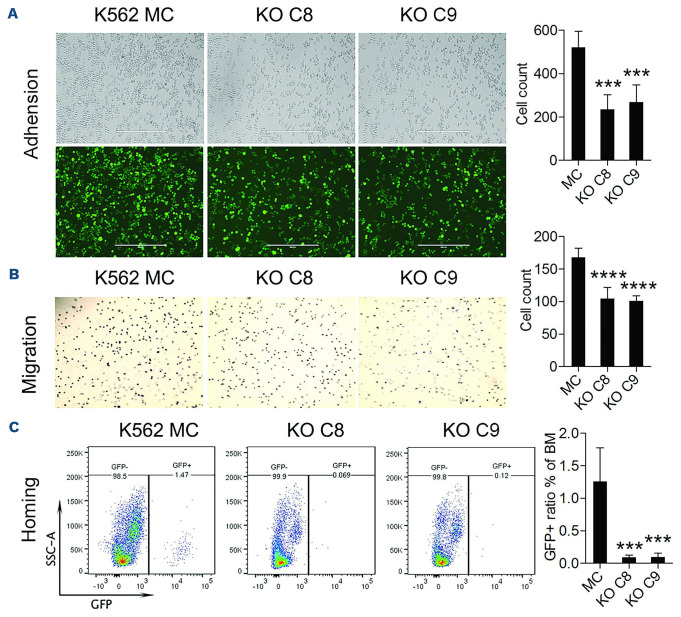
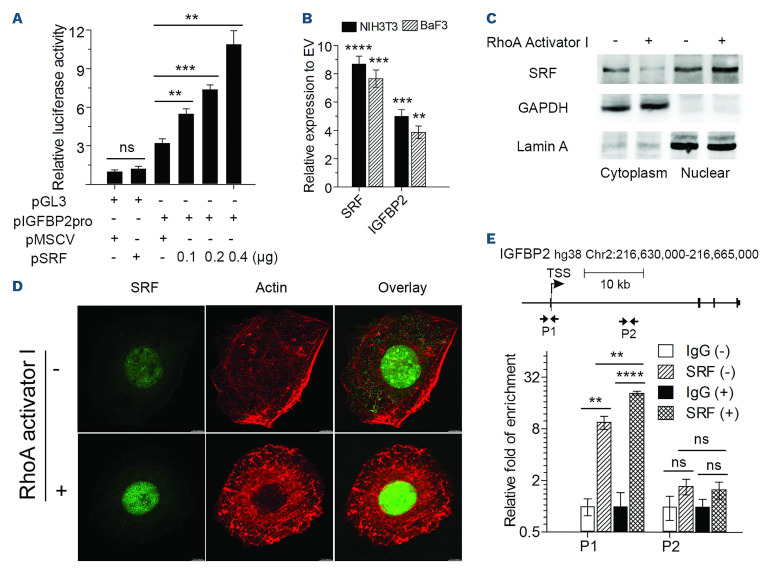
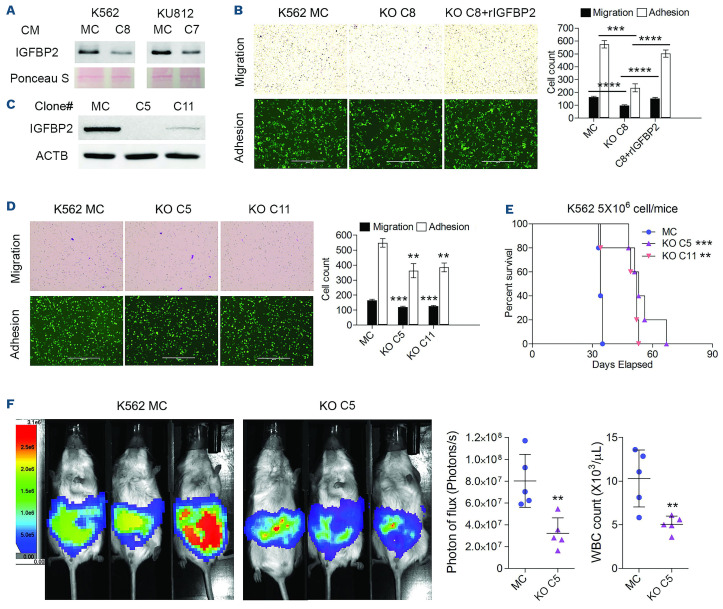
The Philadelphia 9;22 chromosome translocation has two common isoforms that are preferentially associated with distinct subtypes of leukemia. The p210 variant is the hallmark of chronic myeloid leukemia (CML) whereas p190 is frequently associated with B-cell acute lymphoblastic leukemia. The only sequence difference between the two isoforms is the guanidine exchange factor domain. This guanidine exchange factor is reported to activate RHO family GTPases in response to diverse extracellular stimuli. It is not clear whether and, if so, how RHOA contributes to progression of p210 CML. Here we show that knockout of RHOA in the K562 and KU812, p210-expressing cell lines leads to suppression of leukemogenesis in animal models in vivo. RNA-sequencing analysis of the mock control and null cells demonstrated a distinct change in the gene expression profile as a result of RHOA deletion, with significant downregulation of genes involved in cell activation and cell adhesion. Cellular analysis revealed that RHOA knockout leads to impaired cell adhesion and migration and, most importantly, the homing ability of leukemia cells to the bone marrow, which may be responsible for the attenuated leukemia progression. We also identified IGFBP2 as an important downstream target of RHOA. Further mechanistic investigation showed that RHOA activation leads to relocation of the serum response factor (SRF) into the nucleus, where it directly activates IGFBP2. Knockout of IGFBP2 in CML cells suppressed cell adhesion/invasion, as well as leukemogenesis in vivo. This elevated IGFBP2 expression was confirmed in primary CML samples. Thus, we demonstrate one mechanism whereby the RHOA-SRF-IGFBP2 signaling axis contributes to the development of leukemia in cells expressing the p210 BCR-ABL1 fusion kinase.


Figures

Figure 1.
Figure 1.
Generation of RHOA knockout clones and the effect of knockout on cell proliferation in vitro. (A) Overview of the CRISPR strategy to generate RHOA knockout shows the location of target regions within the gene flanking exons 2 and 4 and the protospacer adjacent motif. (B) Western blot analysis of clones recovered following RHOA targeting in K562 cells identified six clones that are null for RHOA. (C) Trypan blue exclusion assays (n=3) over a 4-day proliferation period showed minor differences in cell growth between the mock control (MC) cells and cells from knockout (KO) clones C8 and C9. CellTiter Glo viability assays at day 3 also showed only a marginal difference in cell survival between the MC and KO cells (n=3). (D, E) In the same analysis of KO clones identified from the KU812 cells (D), there is only a minor difference in both cell proliferation and survival (E). Differences between the KO and MC cells were evaluated using the Student t test. *P<0.01, **P≤0.001, ns: not significant. PAM: protospacer adjacent motif.
Figure 2.
Figure 2.
RHOA knockout suppresses chronic myeloid leukemia progression in vivo. (A) Kaplan-Meier survival analysis of mice xenografted with 1x10⁶ mock control (MC) cells or knockout (KO) K562 cells shows that those that received MC cells had a median survival of 52 days; none of the mice xenografted with the KO cells developed disease over the 150-day observation period. When the inoculum was increased to 5x10⁶ cells, while there was a reduction in the mean survival time to 35 days for recipients of the MC cells, there was no difference in survival for those that received the KO cells. (B) Similarly, for the KU812 cells, while the mean survival of mice in the MC group was 39 days, none of the mice injected with the KO cells developed of leukemia over the observation period. (C, D) This significant difference in disease development for K562 cells (C) and KU812 cells (D) could be visualized in mice using luminescence tracking which was mirrored by the relative levels of white blood cells in the peripheral blood at the time of sacrifice (N=5). Differences between the KO and MC cells were evaluated using the Student t test. *P<0.01, ***P≤0.0001, ****P=0.00001.
Figure 3.
Figure 3.
RHOA knockout changes the gene expression profiles in K562 chronic myeloid leukemia cells. (A) Gene set enrichment analysis of RNA-sequencing data from K562 mock control (MC) or RHOA knockout (KO) clones (N=2) showed significant enrichment of genes involved in cell adhesion and activation biological processes in the RHOA-expressing MC cells. Gene set enrichment analysis of RNA-sequencing data from K562 mock control (MC) or RHOA knockout (KO) clones (N=2) showed significant enrich ment of genes involved in cell adhesion and activation biological processes in the RHOA-expressing MC cells. (B) A comparison in expression changes of genes associated with cell adhesion is illustrated and predominantly shows significant downregulation in the KO cells. (C) Similarly genes involved in cell activation biological processes predominantly show significant downregulation in the KO cells. NES: normalized enrichment score; NOM p-values: nominal P values; FDR q-values: false discovery rate q values.
Figure 4.
Figure 4.
Detection of the expression levels of potential RHOA downstream targets in chronic myeloid leukemia cells and primary patients’ samples. (A) Quantitative reverse transcriptase polymerase chain reaction (RT-qPCR) analysis was used to verify differential expression of several of the most highly downregulated and upregulated genes in K562 RHOA knockout (KO) cells compared with mock control (MC) cells (N=3). Analysis of the same genes in the KU812 RHOA KO cells using RT-qPCR showed the same differential expression patterns. (B) The reduced expression levels for IGFBP2, IL20RB and CD24 were further confirmed using western blotting. (C) Analysis of the GSE47927 chronic myeloid leukemia (CML) dataset revealed a highly significant difference in IGFBP2 expression in CML samples (n=52) compared with normal controls (n=15). When cells from these CML cases were sub-fractionated into different stem/progenitor subpopulations, there was a highly significant increase in IGFBP2 expression in CML hematopoietic stem cells compared with normal counterparts. In similar comparisons, a significant increase in IGFBP2 expression was seen in common myeloid progenitors and megakaryocyte-erythroid progenitors but no difference was seen in granulocyte-monocytic progenitors. Statistical significance was established using the Student t test. **P≤0.001, ***P≤0.0001, ****P≤0.00001. HSC: hematopoietic stem cells; CMP: common myeloid progenitors; GMP: granulocyte-monocytic progenitors; MEP: megakaryocyte-erythroid progenitors.
Figure 5.
Figure 5.
RHOA regulates the cell mobility of chronic myeloid leukemia cells. (A) K562 mock control (MC) and knockout (KO) C8 and C9 cells were plated on CH-296-coated plates (N=3) and after 24 hours randomly selected fields were photographed (N=5) and the number of attached cells per field was counted using ImageJ software, which showed a significant reduction in cell adhesion for the KO cells. (B) Using transwell assays, there was a significant reduction in the number of cells migrating through the membrane for the KO cells compared with the MC cells. (C) For the homing assay, mice were xenografted with 5x10⁶ cells and, after 16 hours, the ratio of GFP+ cells in the bone marrow (BM) was determined using flow cytometry. There was a significant reduction in the number of KO cells homing to the BM compared with the number of MC cells. The scale bar in (A) represents 400 µm, with the same magnification for images in (A) and (B). Differences between the KO and MC cells were evaluated using the Student t test. ***P≤0.0001, ****P≤0.00001.
Figure 6.
Figure 6.
RHOA activates IFGBP2 expression through serum response factor. (A) Luciferase expression analysis shows that in the presence of the IGFBP2 promoter there was an increase in activity that was proportional to the levels of serum response factor (SRF) transfected in the same cells. (B) When SRF was overexpressed in either NIH3T3 or BaF3 cells, there was a proportional increase in IGFBP2 expression. (C) When K562 cells were treated with RHOA activator I, levels of SRF declined in the cytoplasm but increased in the nucleus. The relative purity of the cytoplasmic and nuclear protein enrichment was demonstrated by the almost exclusive presence of proteins GAPDH (cytoplasm) and Lamin A (nucleus). (D) The same increased levels of SRF in the nucleus of adherent 3T3 cells following RHOA activation was seen using confocal microscopy. (E) Chromatin immunoprecipitation quantitative polymerase chain reaction analysis from K562 cells using primers P1, which target the IGFBP2 promoter region, showed occupancy of SRF on the IGFBP2 promoter (SRF-), which was increased when the cells were treated with the RHOA activator (SRF+). In the same experimental model, no significant changes were seen in the downstream intron region defined by the P2 primers. The scale bar in (D) represents 50 µm. Differences between the knockout and matched control cells were evaluated using the Student t test. Cells transduced with empty vector were used as the control for comparison in (B). *P<0.01, **P≤0.001, ***P≤0.0001, ****P≤0.00001, ns: not significant. MSCV: murine stem cell virus; EV: empty vector.
Figure 7.
Figure 7.
Knockout of IFGBP2 partially recapitulates the phenotype of RHOA loss. (A) Analysis of the supernatant from K562 C8 and KU812 C7 knockout (KO) cells when compared with the respective mock control (MC) cells, showed a dramatic reduction in IGFBP2 protein levels in the KO cell culture medium. (B) In migration and adhesion analysis, K562 KO C8 cells showed a reduction in both phenotypes compared with MC cells. When exogenous, recombinant IGFBP2 (rIGFBP2) was added to the culture medium, there was a significant increase in both phenotypes in the KO C8 cells. (C, D) CRISPR knockout of IGFBP2 in K562 cells generated two clones, C5 and C11 (C), which when subjected to migration and adhesion assays (D) showed reduced levels compared with MC cells. (E) When these cells were xenografted into NSG hosts, mice receiving KO clones C5 and C11 showed an increased survival compared with MC-engrafted mice. (F) This result was consistent with luminescence intensity in the mice after 28 days, which showed that the tumor burden was significantly reduced in the mice grafted with the KO C5 cells compared to that of mice engrafted with MC cells. White blood cell count at the time of sacrifice was also reduced in the mice grafted with KO C5 cells. The scale bars in (B) and (D) represent 400 µm, with the magnification for the images in (B) and (D) being the same. Differences between the KO and MC cells were evaluated using the Student t test. Pairwise comparisons are indicated by the horizontal lines. **P≤0.001, ***P≤0.0001, ****P ≤0.00001. CM: culture medium; WBC: white blood cells.

References

    1. Jaffe AB, Hall A. Rho GTPases: biochemistry and biology. Ann Rev Cell Dev Biol. 2005;21:247-269. - PubMed
    1. Thumkeo D, Watanabe S, Narumiya S. Physiological roles of Rho and Rho effectors in mammals. Eur J Cell Biol. 2013;92(10-11):303-315. - PubMed
    1. Ridley AJ, Hall A. The small GTP-binding protein rho regulates the assembly of focal adhesions and actin stress fibers in response to growth factors. Cell. 1992;70(3):389-399. - PubMed
    1. Lawson CD, Ridley AJ. Rho GTPase signaling complexes in cell migration and invasion. J Cell Biol. 2018;217(2):447-457. - PMC - PubMed
    1. Pedersen E, Brakebusch C. Rho GTPase function in development: how in vivo models change our view. Exp Cell Res. 2012;318(14):1779-1787. - PubMed

Publication types

MeSH terms

Substances