

Corticotroph isolation from Pomc-eGFP mice reveals sustained transcriptional dysregulation characterising a mouse model of glucocorticoid-induced suppression of the hypothalamus-pituitary-adrenal axis
- PMID: 35833423
- PMCID: PMC9539609
- DOI: 10.1111/jne.13165
Corticotroph isolation from Pomc-eGFP mice reveals sustained transcriptional dysregulation characterising a mouse model of glucocorticoid-induced suppression of the hypothalamus-pituitary-adrenal axis
Abstract
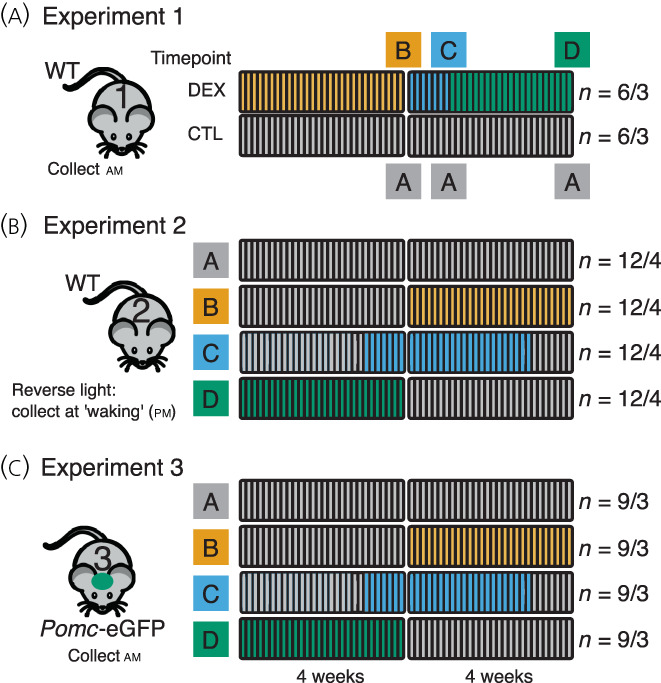
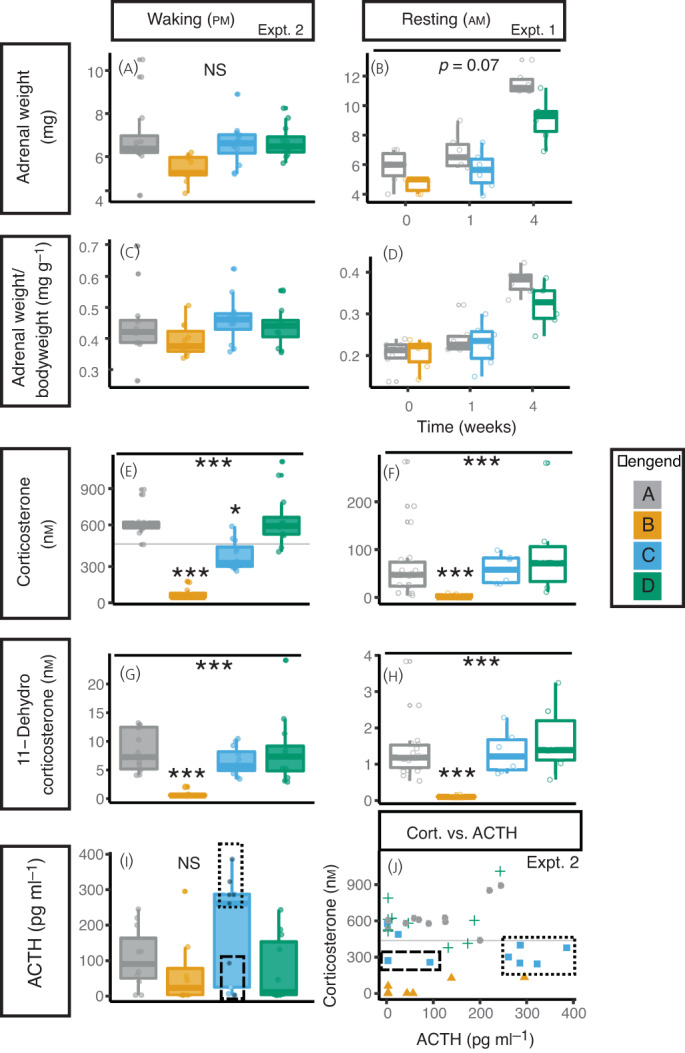
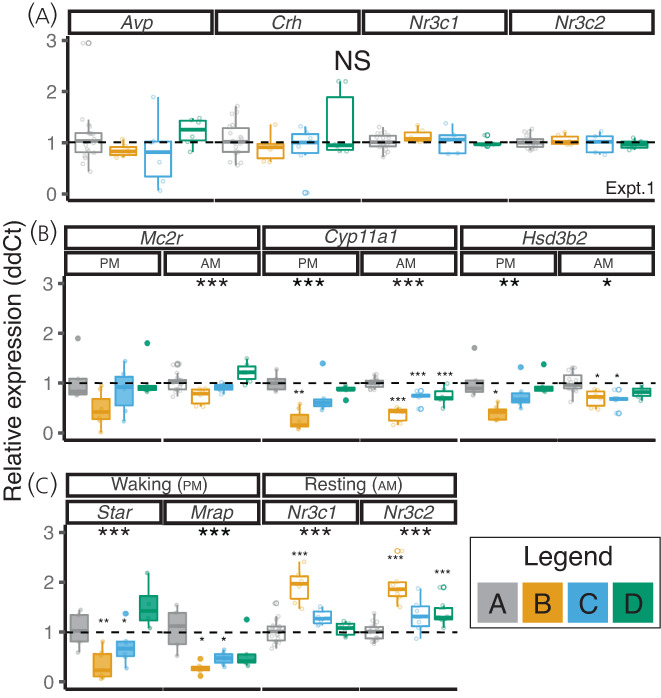
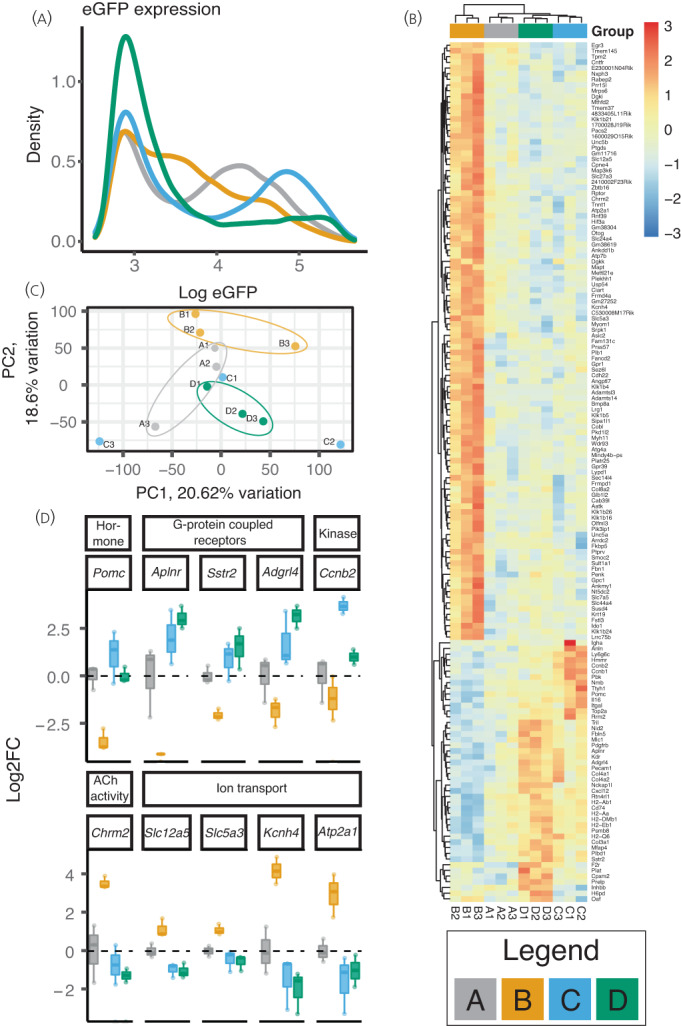
Glucocorticoids (GC) are prescribed for periods > 3 months to 1%-3% of the UK population; 10%-50% of these patients develop hypothalamus-pituitary-adrenal (HPA) axis suppression, which may last over 6 months and is associated with morbidity and mortality. Recovery of the pituitary and hypothalamus is necessary for recovery of adrenal function. We developed a mouse model of dexamethasone (DEX)-induced HPA axis dysfunction aiming to further explore recovery in the pituitary. Adult male wild-type C57BL6/J or Pomc-eGFP transgenic mice were randomly assigned to receive DEX (approximately 0.4 mg kg-1 bodyweight day-1 ) or vehicle via drinking water for 4 weeks following which treatment was withdrawn and tissues were harvested after another 0, 1, and 4 weeks. Corticotrophs were isolated from Pomc-eGFP pituitaries using fluorescence-activated cell sorting, and RNA extracted for RNA-sequencing. DEX treatment suppressed corticosterone production, which remained partially suppressed at least 1 week following DEX withdrawal. In the adrenal, Hsd3b2, Cyp11a1, and Mc2r mRNA levels were significantly reduced at time 0, with Mc2r and Cyp11a1 remaining reduced 1 week following DEX withdrawal. The corticotroph transcriptome was modified by DEX treatment, with some differences between groups persisting 4 weeks following withdrawal. No genes supressed by DEX exhibited ongoing attenuation 1 and 4 weeks following withdrawal, whereas only two genes were upregulated and remained so following withdrawal. A pattern of rebound at 1 and 4 weeks was observed in 14 genes that increased following suppression, and in six genes that were reduced by DEX and then increased. Chronic GC treatment may induce persistent changes in the pituitary that may influence future response to GC treatment or stress.
Keywords: HPA axis; chronic; glucocorticoid; recovery.
© 2022 The Authors. Journal of Neuroendocrinology published by John Wiley & Sons Ltd on behalf of British Society for Neuroendocrinology.
Conflict of interest statement
The authors declare that no conflicts of interest. TJGC has received a speaker honorarium from Astellas Pharma Inc.
Figures
Similar articles
-
Alterations in hypothalamic-pituitary-adrenal axis activity and in levels of proopiomelanocortin and corticotropin-releasing hormone-receptor 1 mRNAs in the pituitary and hypothalamus of the rat during chronic 'binge' cocaine and withdrawal.Brain Res. 2003 Feb 28;964(2):187-99. doi: 10.1016/s0006-8993(02)03929-x. Brain Res. 2003. PMID: 12576179
-
Estrogen impairs glucocorticoid dependent negative feedback on the hypothalamic-pituitary-adrenal axis via estrogen receptor alpha within the hypothalamus.Neuroscience. 2009 Mar 17;159(2):883-95. doi: 10.1016/j.neuroscience.2008.12.058. Epub 2009 Jan 7. Neuroscience. 2009. PMID: 19166915 Free PMC article.
-
Central dysregulation of the hypothalamic-pituitary-adrenal axis in neuron-specific proopiomelanocortin-deficient mice.Endocrinology. 2007 Feb;148(2):647-59. doi: 10.1210/en.2006-0990. Epub 2006 Nov 9. Endocrinology. 2007. PMID: 17095588
-
Activation of PPAR-γ reduces HPA axis activity in diabetic rats by up-regulating PI3K expression.Exp Mol Pathol. 2016 Oct;101(2):290-301. doi: 10.1016/j.yexmp.2016.10.002. Epub 2016 Oct 8. Exp Mol Pathol. 2016. PMID: 27725163
-
Nuclear Receptors as Regulators of Pituitary Corticotroph Pro-Opiomelanocortin Transcription.Cells. 2020 Apr 7;9(4):900. doi: 10.3390/cells9040900. Cells. 2020. PMID: 32272677 Free PMC article. Review.
Cited by
-
High Levels of C-Reactive Protein with Low Levels of Pentraxin 3 as Biomarkers for Central Serous Chorioretinopathy.Ophthalmol Sci. 2023 Feb 3;3(3):100278. doi: 10.1016/j.xops.2023.100278. eCollection 2023 Sep. Ophthalmol Sci. 2023. PMID: 36950301 Free PMC article.
-
Glucocorticoid action in the anterior pituitary gland: Insights from corticotroph physiology.Curr Opin Endocr Metab Res. 2022 Aug;25:100358. doi: 10.1016/j.coemr.2022.100358. Curr Opin Endocr Metab Res. 2022. PMID: 36632471 Free PMC article. Review.
-
Sex-dependent effects of FGF21 on HPA axis regulation and adrenal regeneration after Cushing syndrome in mice.Mol Metab. 2025 Jun;96:102122. doi: 10.1016/j.molmet.2025.102122. Epub 2025 Mar 26. Mol Metab. 2025. PMID: 40154841 Free PMC article.
-
Rapid hypothalamic-pituitary recovery after chronic glucocorticoid therapy enables strategies that prevent adrenal suppression.bioRxiv [Preprint]. 2025 May 4:2025.04.30.651350. doi: 10.1101/2025.04.30.651350. bioRxiv. 2025. PMID: 40655007 Free PMC article. Preprint.
References
-
- Fardet L, Petersen I, Nazareth I. Prevalence of long‐term oral glucocorticoid prescriptions in the UKover the past 20 years. Rheumatology (Oxford). 2011;50:1982‐1990. - PubMed
-
- Fraser CG, Preuss FS, Bigford WD. Adrenal atrophy and irreversible shock associated with cortisone therapy. JAMA. 1952;149:1542‐1543. - PubMed
Publication types
MeSH terms
Substances
Grants and funding
LinkOut - more resources
Full Text Sources
Molecular Biology Databases
Miscellaneous
