. 2022 Sep 1;163(9):bqac100.
doi: 10.1210/endocr/bqac100.

Follicular Hyperstimulation Dysgenesis: New Explanation for Adverse Effects of Excessive FSH in Ovarian Stimulation

Affiliations

Follicular Hyperstimulation Dysgenesis: New Explanation for Adverse Effects of Excessive FSH in Ovarian Stimulation

Zaramasina L Clark et al. Endocrinology. .

Abstract

High follicle-stimulating hormone (FSH) doses during ovarian stimulation protocols for assisted reproductive technologies (ART) are detrimental to ovulatory follicle function and oocyte quality. However, the mechanisms are unclear. In a small ovarian reserve heifer model, excessive FSH doses lead to phenotypic heterogeneity of ovulatory size follicles, with most follicles displaying signs of premature luteinization and a range in severity of abnormalities. By performing whole transcriptome analyses of granulosa cells, cumulus cells, and oocytes from individual follicles of animals given standard or excessive FSH doses, we identified progressive changes in the transcriptomes of the 3 cell types, with increasing severity of follicular abnormality with the excessive doses. The granulosa and cumulus cells each diverged progressively from their normal phenotypes and became highly similar to each other in the more severely affected follicles. Pathway analysis indicates a possible dysregulation of the final stages of folliculogenesis, with processes characteristic of ovulation and luteinization occurring concurrently rather than sequentially in the most severely affected follicles. These changes were associated with disruptions in key pathways in granulosa and cumulus cells, which may account for previously reported reduced estradiol production, enhanced progesterone and oxytocin production and diminished ovulation rates. Predicted deficiencies in oocyte survival, stress response, and fertilization suggest likely reductions in oocyte health, which could further compromise oocyte quality and ART outcomes.

Keywords: cumulus cells; excessive FSH doses; granulosa cells; oocytes; ovarian stimulation; ovulatory-size follicles; transcriptome analysis.


Figures

Figure 1.
Figure 1.
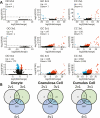
Volcano plots comparing Type 2 to 4 with Type 1 follicles, within cell type, and Venn diagram summarizing the number of DEGs and their overlaps. (A) Each plot displays DESeq2 results (–log10 [FDR]), DEGs were called at a significance threshold greater than 2.0 (FDR < 0.01), denoted by horizontal dashed line. Point color key: black = non-DEG, Red = upregulated DEGs, blue = downregulated DEGs. (B) Summary of DEG overlaps for each cell type comparing follicle Types 2-4 vs Type 1: oocyte, granulosa cell, and cumulus cell. All data were generated from Tables S2-S4 (32).
Figure 2.
Figure 2.
Overview of gene expression changes for manually curated luteinization markers identified from the literature. (A) Five columns exploring the changes in luteinization marker expression in cumulus and granulosa cell samples. (A) Column 1 depicts the expected change in expression during luteinization, wherein red fill denotes an increase in expression, blue a decrease. (A) Columns 2 and 3 depict the changes in expression of markers in cumulus and granulosa cells, respectively, from different follicle types; fill of any color denotes log2 (fold-change), red equating to an increase and blue a decrease in expression. (A) Column 4 depicts the difference in marker expression when comparing cumulus and granulosa cells within follicle type; yellow fill denotes higher expression in cumulus cells and green higher expression in granulosa cells. (A) Column 5 identifies which of the markers are targets of hormones per the IPA database. (A) Columns 2-4, DEG status is denoted by **FDR < 0.01 and *FDR < 0.05. (B) A correlation heatmap with hierarchical clustering based on the average FPKM of the luteinization markers for both cumulus and granulosa cells among the 4 follicle types. Red fill indicates a higher correlation of expression values, while blue denotes less correlation. CC, cumulus cell; GC, granulosa cell. Data were generated from Tables S2 and S3 (32).
Figure 3.
Figure 3.
Volcano plots comparing DEGs in cumulus and granulosa cells for each follicle type (1-4) and correlation heatmap with applied hierarchical clustering of expression values for cumulus and granulosa cells. (A) Each plot displays DESeq2 results (–log10 [FDR]) and represents the DEGs in the cumulus and granulosa cells within a follicle type. DEGs were called at a significance threshold greater than 2.0 (FDR < 0.01), denoted by horizontal dashed line. Point color key: Black = non-DEG, Red = upregulated DEGs, Blue = downregulated DEGs. CC = cumulus cells and GC = granulosa cells. (B) Within cumulus and granulosa cell types, FPKM values for follicle Types 2 to 4 were normalized against those for Type 1 as the denominator. The correlation between the types were calculated via the Pearson method. Color denotes correlation coefficient: red equating to more similar, and blue less similar. All data were generated from Tables S2 and S3 (32).
Figure 4.
Figure 4.
Expression of hormone receptor mRNAs and the number of DEGs potentially affected by hormones. (A) Boxplots portray the FPKM values of ESR1, ESR2, FSHR, and LHCGR for each cell and follicle type. The x-axis denotes follicle Types 1 to 4 and the y-axis denotes the FPKM values for each sample. Significant differences between types; within cell type were overlayed from the DESeq2 analysis. Horizontal lines denote those comparisons with an adjusted P < .05. (B) Barplots show the number of DEGs targeted by each hormone indicated, as predicted by the IPA database, for each cell type and for each comparison indicated on the x-axis. The y-axis quantifies the number of DEGs, with the color denoting the direction of regulation: red = upregulated, blue = downregulated, bifurcated by horizontal line at y = 0. Data generated from Tables S2-S4 (32).
Figure 5.
Figure 5.
Oocyte IPA pathway, regulator, and function heatmap. Heatmaps depict significantly affected canonical pathways, biological functions, and upstream regulators for the follicle Type 4 vs 1 comparison in oocytes. Colored fill for cells in heat maps denote z-score: red = activated, blue = inhibited, black = no significant z-score. Within the Upstream Regulator panel, the circles within colored fills denote regulators that are also differentially expressed: blue = downregulated. Data generated from Tables S5-S7 (32).
Figure 6.
Figure 6.
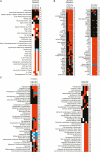
Cumulus and granulosa cell IPA pathway, regulator, and function heatmap. Heatmap depicts IPA canonical pathways (A), upstream regulators (B), and biological functions (C) for cumulus and granulosa cells. All panels consist of 2 columns (wrapped in 2 portions for B and C): left column denotes dataset of origin with the cell type and follicle type comparison indicated, right column (“LM”) denotes the number of luteinization markers (Fig. 2) present in the pathway. Along the y-axis are the identified, canonical pathways, upstream regulators, and biological functions. Colored fill for cells in heat maps denote z-score: red = activated, blue = inhibited, black = no significant z-score. Level of significant overlap was set at P < .05, and cells with white fill denote those not meeting significance. (A) Entries were limited to those with significance in at least 3 datasets and/or significant z-scores in at least 2; data generated from Table S5 (32). (B) Entries were limited to those with significance in at least 4 datasets and/or significant z-scores in at least 3 datasets; data generated from Table S6 (32). (C) Entries were limited to those with significance in at least 5 datasets and/or significant z-scores in at least 4 datasets; data generated from Table S7 (32).
Figure 7.
Figure 7.
Expanded network analysis of IPA results. Custom expanded network figure linking significant upstream regulators, their downstream DEG targets, and enriched pathways and functions, derived from the IPA software. Figure is split into 2 panels: left panel contains joint information for granulosa and cumulus cell (3v1 and 4v1, comparisons), right panel contains oocyte (4v1 comparison). Each panel is further divided into 3 sections: (1) upstream regulators, (2) downstream DEGs, and (3) functions. Section 1 contains upstream regulators, connected in a network, which were identified with significant z-scores, P values of overlap, and/or were differentially expressed. The downstream DEG section tabulates the number of DEGs for each cell type, bifurcated by direction of regulation, and source of comparison. The function section identifies the pathways and functions significantly enriched by the above DEGs and upstream regulators. For the granulosa and cumulus cell section, superscripts denote which comparison of origin: 3 = 3v1, 4 = 4v1. For both vertical sections, outer border colors for molecules denote significant predicted z-score (|z| > 1.96): blue = inhibited, red = activated. Interior solid coloring denotes molecules for which mRNAs are differentially expressed (FDR < 0.05): blue = downregulated, red = upregulated. Outer borders in solid black indicate a significant effect without z score, while dashed outer borders denote instances of nonsignificant P values. Left and right portions of borders and inner fills denote results for granulosa and cumulus cells, respectively. The “?” symbol by LH indicates that, although IPA suggests LH as a possible affected UR, there is substantial overlap between FSH and LH signaling (about 2/3 of pathway members).

Similar articles

Cited by

References

    1. Baker VL, Brown MB, Luke B, Smith GW, Ireland JJ. Gonadotropin dose is negatively correlated with live birth rate: analysis of more than 650,000 assisted reproductive technology cycles. Fertil Steril. 2015;104(5):1145-52.e1. - PMC - PubMed
    1. Clark ZL, Thakur M, Leach RE, Ireland JJ. FSH dose is negatively correlated with number of oocytes retrieved: analysis of a data set with ~650,000 ART cycles that previously identified an inverse relationship between FSH dose and live birth rate. J Assist Reprod and Genet. 2021;38(7):1787-1797. - PMC - PubMed
    1. Karl KR, Jimenez-Krassel F, Gibbings E, et al. Negative impact of high doses of follicle-stimulating hormone during superovulation on the ovulatory follicle function in small ovarian reserve dairy heifers. Biol Reprod. 2020;104(3):695-705. - PMC - PubMed
    1. McGowan MR, Braithwaite M, Jochle W, Mapletoft RJ. Superovulation of beef heifers with Pergonal (HMG): a dose response trial. Theriogenology. 1985;24(2):173-184. - PubMed
    1. Pawlyshyn V, Lindsell CE, Braithwaite M, Mapletoft RJ. Superovulation of beef cows with FSH-P: a dose-response trial. Theriogenology. 1986;25(1):179.

Publication types