Improved detection limits of J-coupled neurometabolites in the human brain at 7 T with a J-refocused sLASER sequence
- PMID: 35833462
- PMCID: PMC9788253
- DOI: 10.1002/nbm.4801
Improved detection limits of J-coupled neurometabolites in the human brain at 7 T with a J-refocused sLASER sequence
Abstract
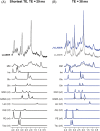
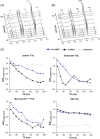
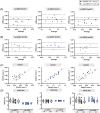
In a standard spin echo, the time evolution due to homonuclear couplings is not reversed, leading to echo time (TE)-dependent modulation of the signal amplitude and signal loss in the case of overlapping multiplet resonances. This has an adverse effect on quantification of several important metabolites such as glutamate and glutamine. Here, we propose a J-refocused variant of the sLASER sequence (J-sLASER) to improve quantification of J-coupled metabolites at ultrahigh field (UHF). The use of the sLASER sequence is particularly advantageous at UHF as it minimizes chemical shift displacement error and results in relatively homogenous refocusing. We simulated the MRS signal from brain metabolites over a broad range of TE values with sLASER and J-sLASER, and showed that the signal of J-coupled metabolites was increased with J-sLASER with TE values up to ~80 ms. We further simulated "brain-like" spectra with both sequences at the shortest TE available on our scanner. We showed that, despite the slightly longer TE, the J-sLASER sequence results in significantly lower Cramer-Rao lower bounds (CRLBs) for J-coupled metabolites compared with those obtained with sLASER. Following phantom validation, we acquired spectra from two brain regions in 10 healthy volunteers (age 38 ± 15 years) using both sequences. We showed that using J-sLASER results in a decrease of CRLBs for J-coupled metabolites. In particular, we measured a robust ~38% decrease in the mean CRLB (glutamine) in parietal white matter and posterior cingulate cortex (PCC). We further showed, in 10 additional healthy volunteers (age 34 ± 15 years), that metabolite quantification following two separate acquisitions with J-sLASER in the PCC was repeatable. The improvement in quantification of glutamine may in turn improve the independent quantification of glutamate, the main excitatory neurotransmitter in the brain, and will simultaneously help to track possible modulations of glutamine, which is a key player in the glutamatergic cycle in astrocytes.
Keywords: 7 T; J-coupled metabolites; J-refocused sLASER; aspartate; detection limits; glutamate; glutamine; human brain.
© 2022 The Authors. NMR in Biomedicine published by John Wiley & Sons Ltd.
Conflict of interest statement
The authors declare no conflicts of interest.
Figures


Similar articles
-
Repeatability of proton magnetic resonance spectroscopy of the brain at 7 T: effect of scan time on semi-localized by adiabatic selective refocusing and short-echo time stimulated echo acquisition mode scans and their comparison.Quant Imaging Med Surg. 2021 Jan;11(1):9-20. doi: 10.21037/qims-20-517. Quant Imaging Med Surg. 2021. PMID: 33392007 Free PMC article.
-
Improved resolution of glutamate, glutamine and γ-aminobutyric acid with optimized point-resolved spectroscopy sequence timings for their simultaneous quantification at 9.4 T.NMR Biomed. 2018 Jan;31(1). doi: 10.1002/nbm.3851. Epub 2017 Nov 3. NMR Biomed. 2018. PMID: 29105187
-
A comparison of sLASER and MEGA-sLASER using simultaneous interleaved acquisition for measuring GABA in the human brain at 7T.PLoS One. 2019 Oct 11;14(10):e0223702. doi: 10.1371/journal.pone.0223702. eCollection 2019. PLoS One. 2019. PMID: 31603925 Free PMC article.
-
Diffusion-weighted SPECIAL improves the detection of J-coupled metabolites at ultrahigh magnetic field.Magn Reson Med. 2024 Jan;91(1):4-18. doi: 10.1002/mrm.29805. Epub 2023 Sep 28. Magn Reson Med. 2024. PMID: 37771277
-
Precision of metabolite-selective MRS measurements of glutamate, GABA and glutathione: A review of human brain studies.NMR Biomed. 2024 Mar;37(3):e5071. doi: 10.1002/nbm.5071. Epub 2023 Dec 4. NMR Biomed. 2024. PMID: 38050448 Review.
Cited by
-
In vivo magnetic resonance spectroscopy by transverse relaxation encoding with narrowband decoupling.Sci Rep. 2023 Jul 27;13(1):12211. doi: 10.1038/s41598-023-39375-0. Sci Rep. 2023. PMID: 37500714 Free PMC article.
-
Examination of methods to separate overlapping metabolites at 7T.Magn Reson Med. 2025 Feb;93(2):470-480. doi: 10.1002/mrm.30293. Epub 2024 Sep 30. Magn Reson Med. 2025. PMID: 39344348 Free PMC article.
References
Publication types
MeSH terms
Substances
LinkOut - more resources
Full Text Sources

