

MiR-22-3p and miR-29a-3p synergistically inhibit hepatic stellate cell activation by targeting AKT3
- PMID: 35833537
- PMCID: PMC9638961
- DOI: 10.1177/15353702221108379
MiR-22-3p and miR-29a-3p synergistically inhibit hepatic stellate cell activation by targeting AKT3
Abstract
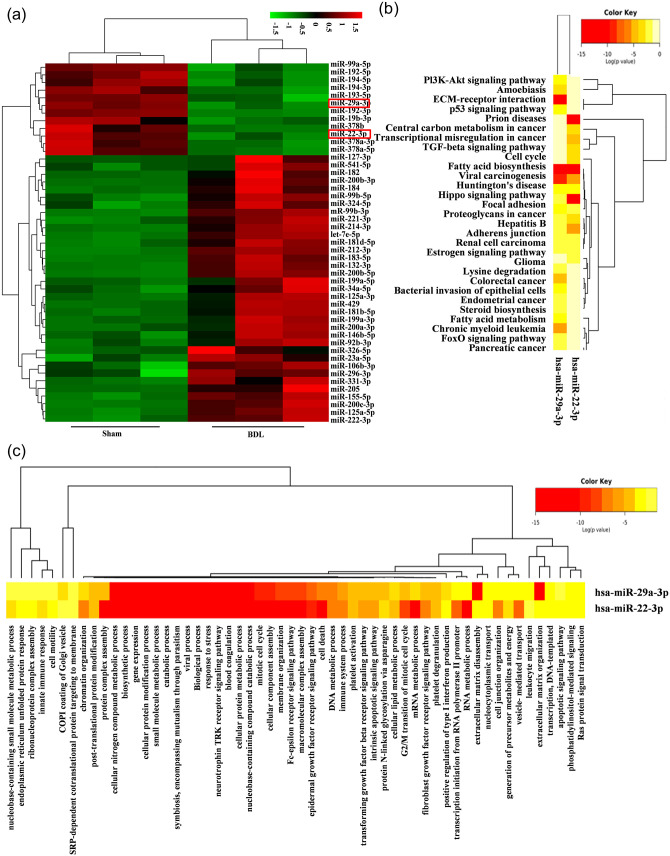
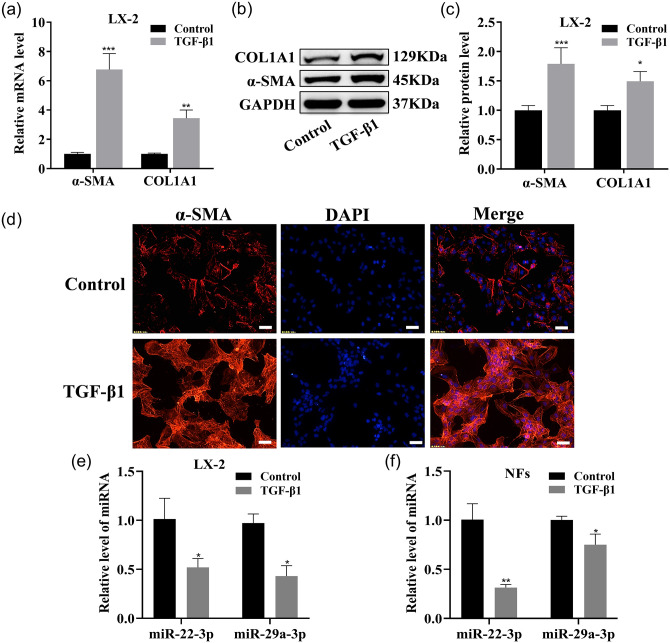
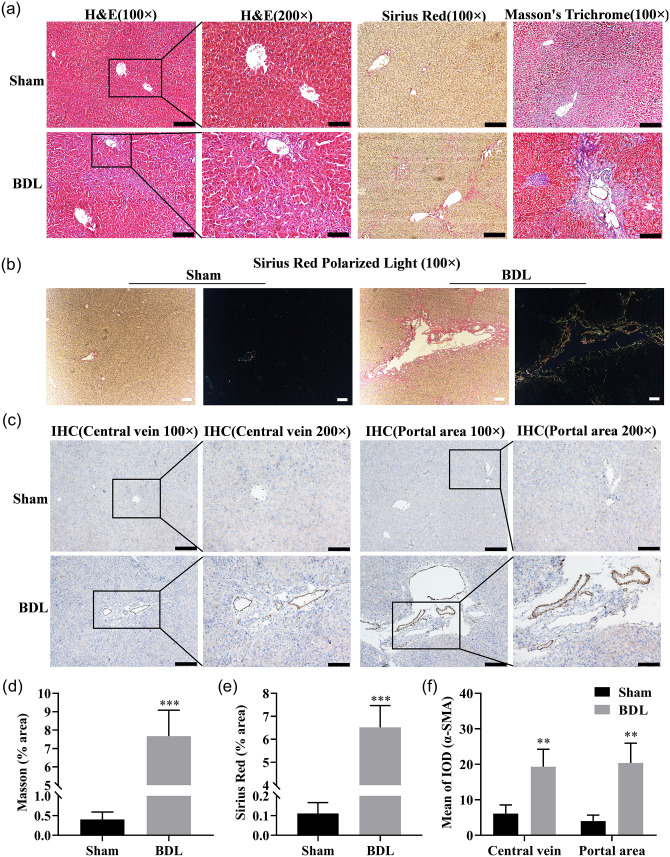
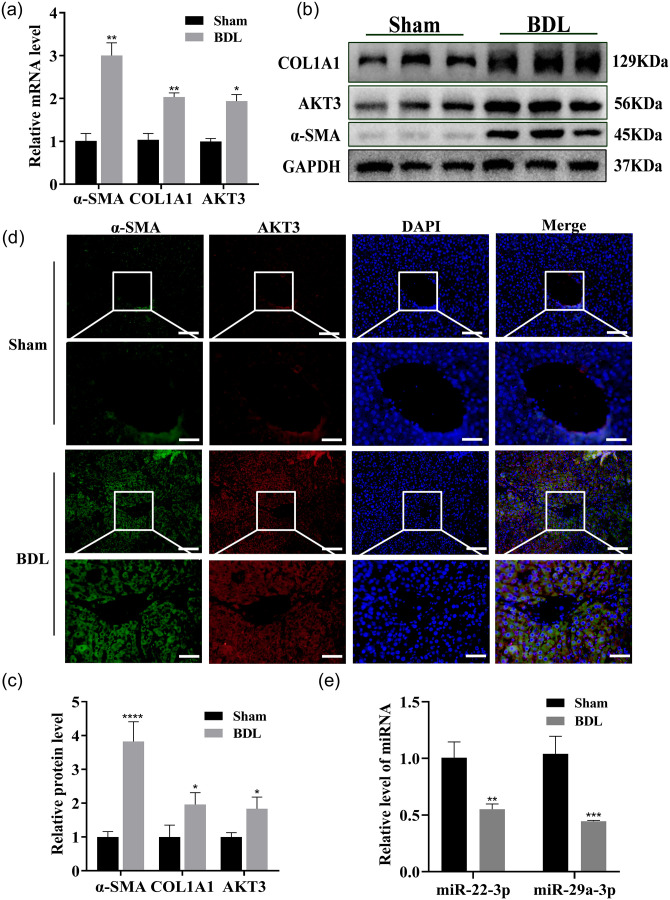
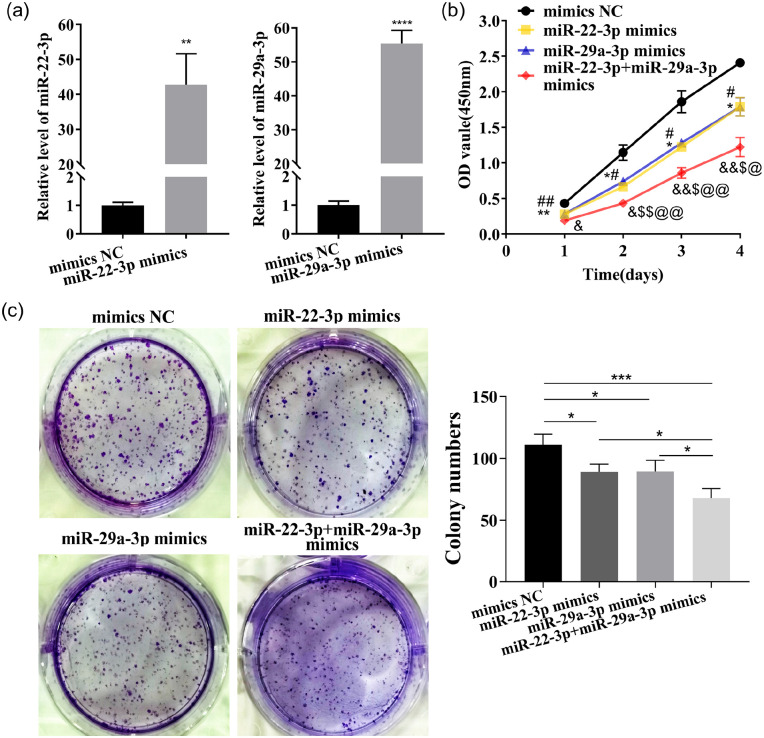
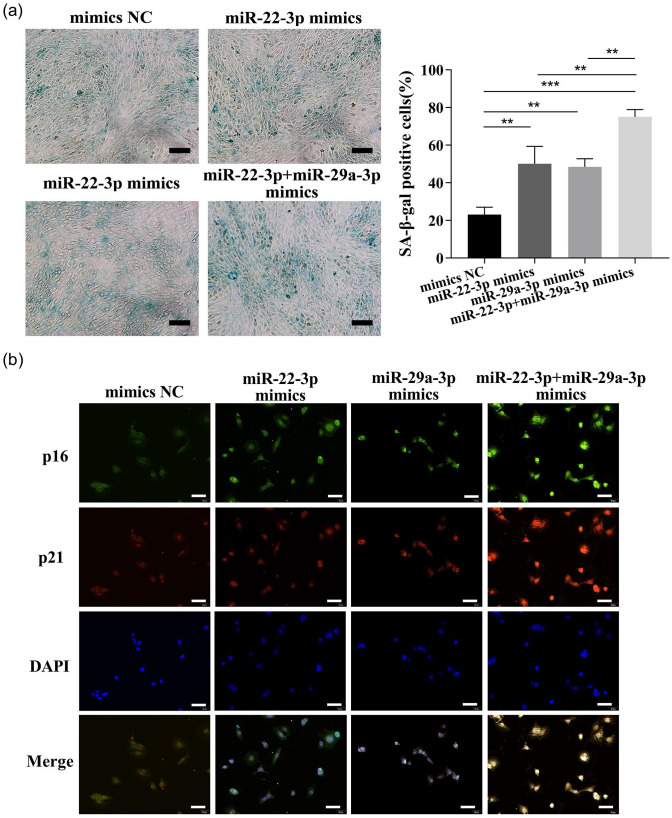
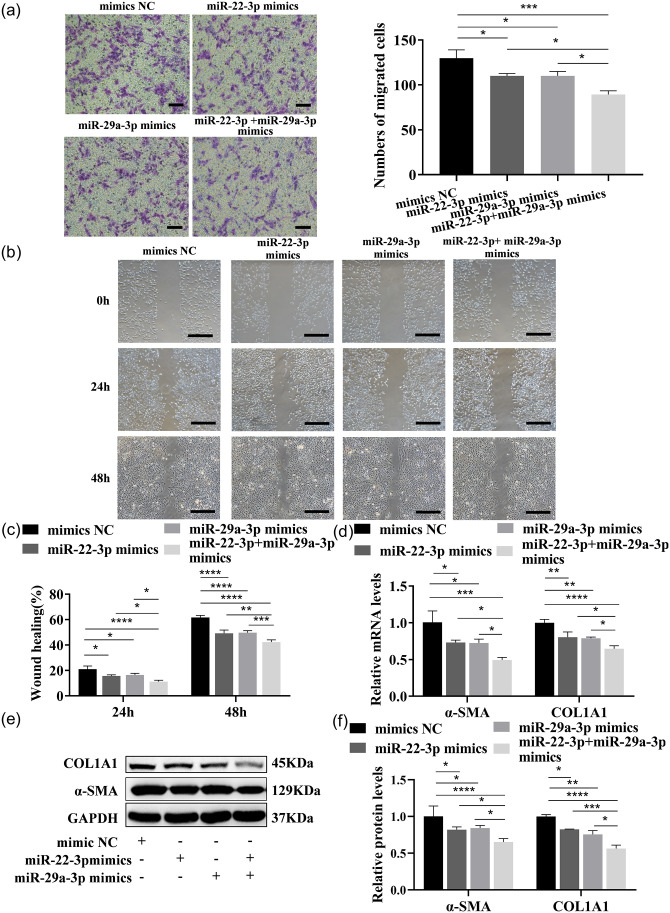
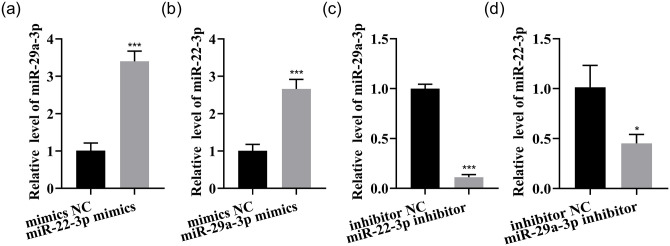
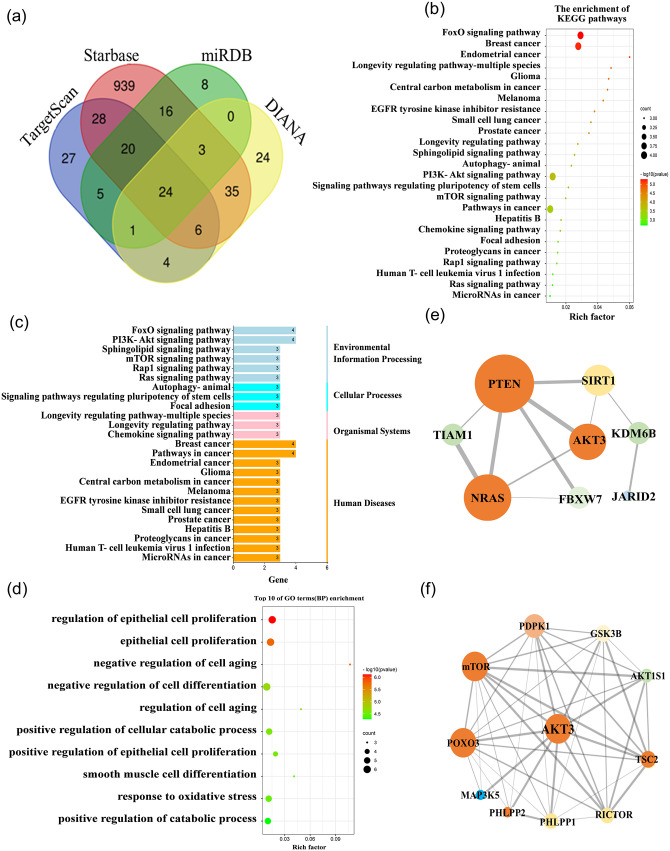
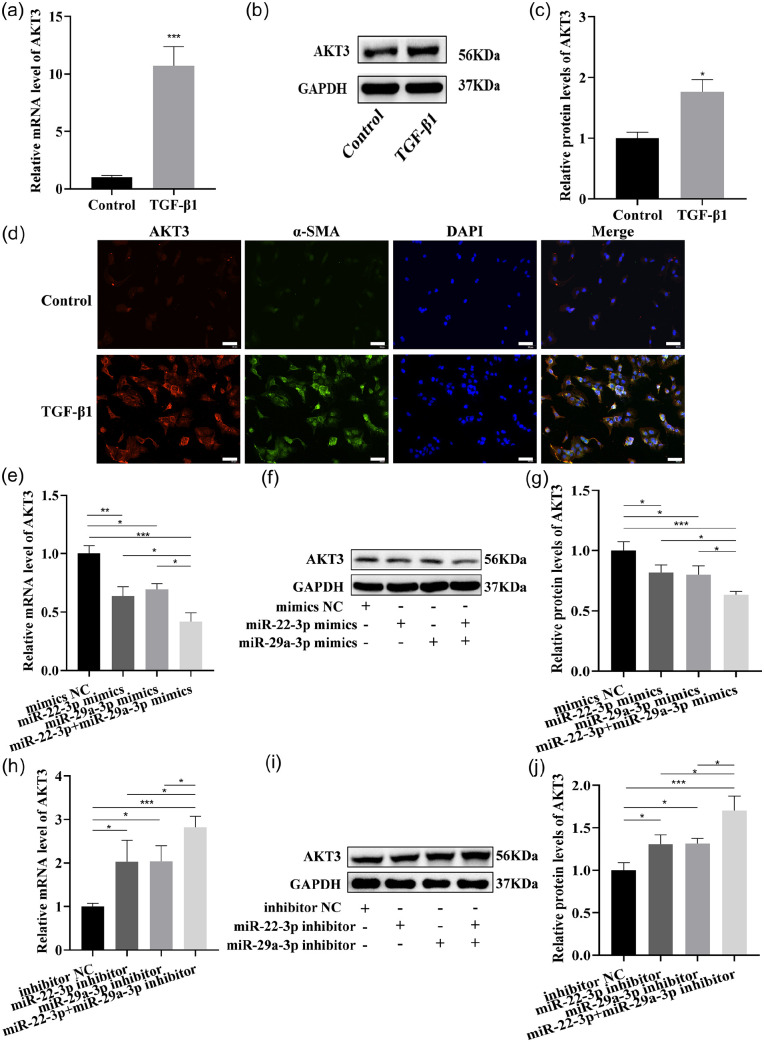
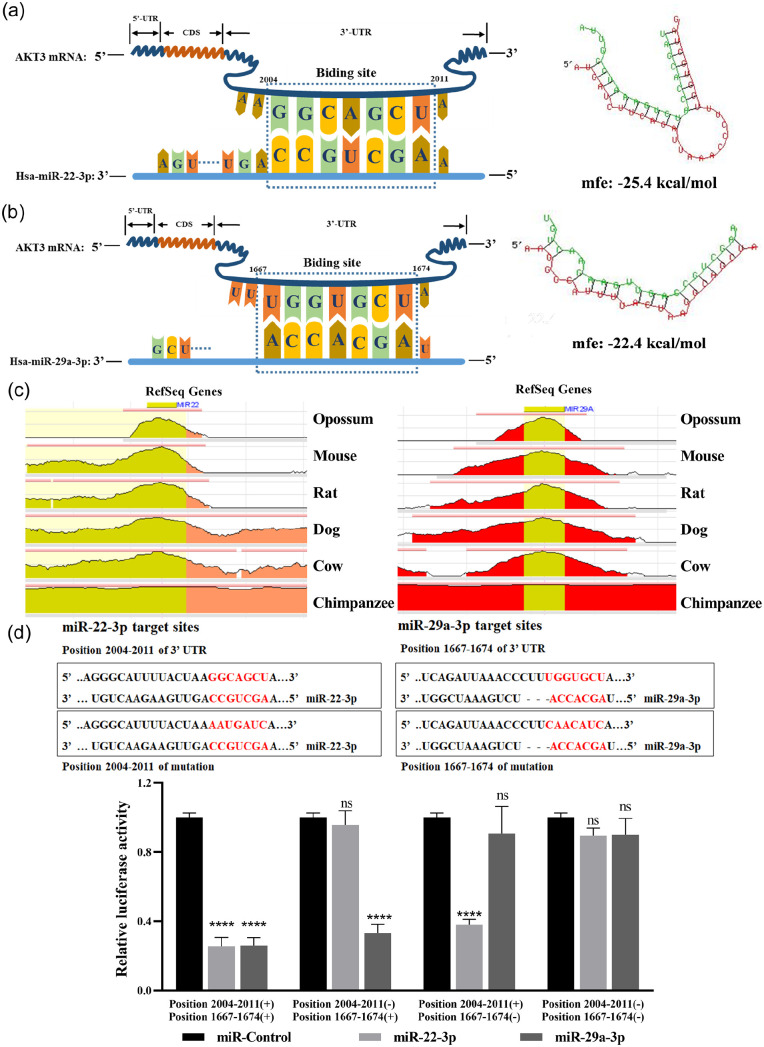
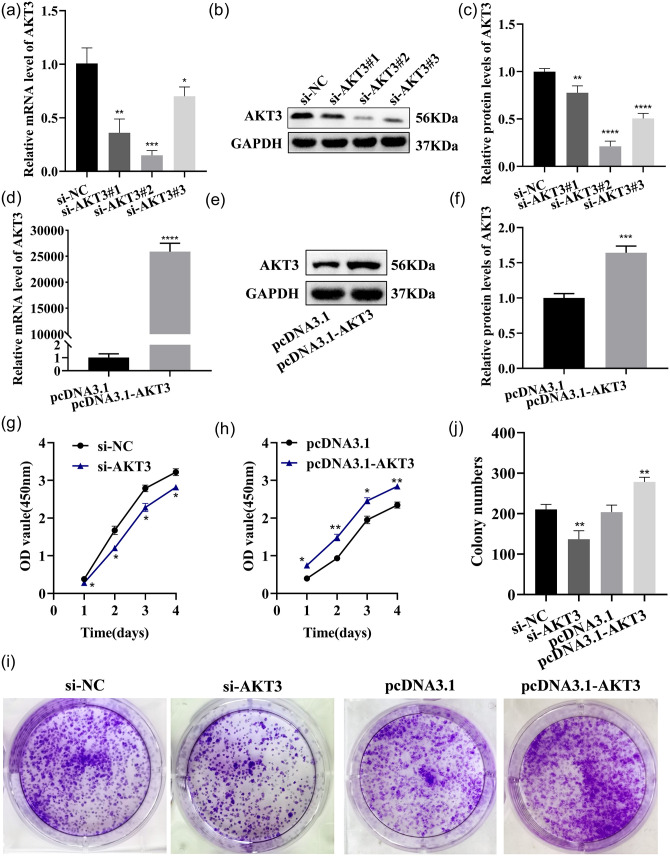
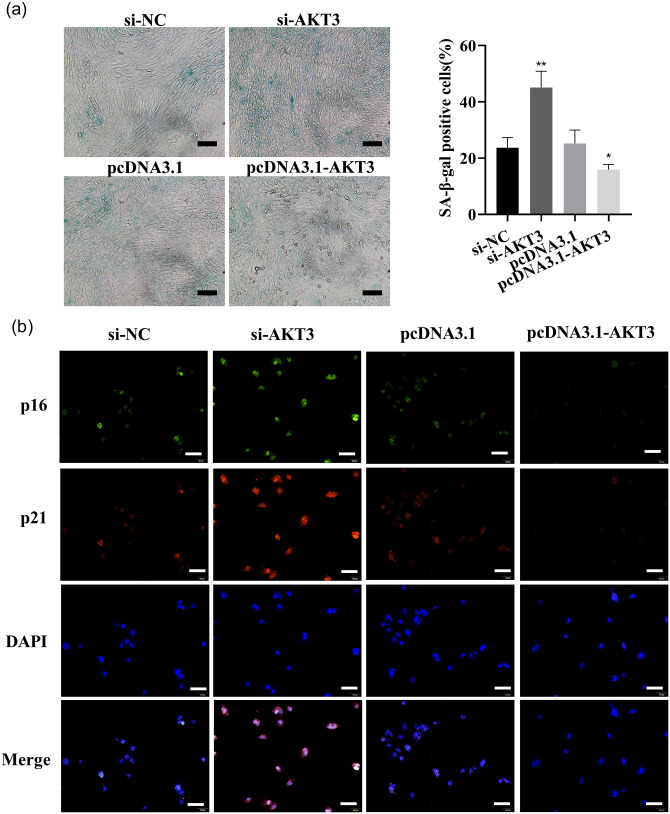
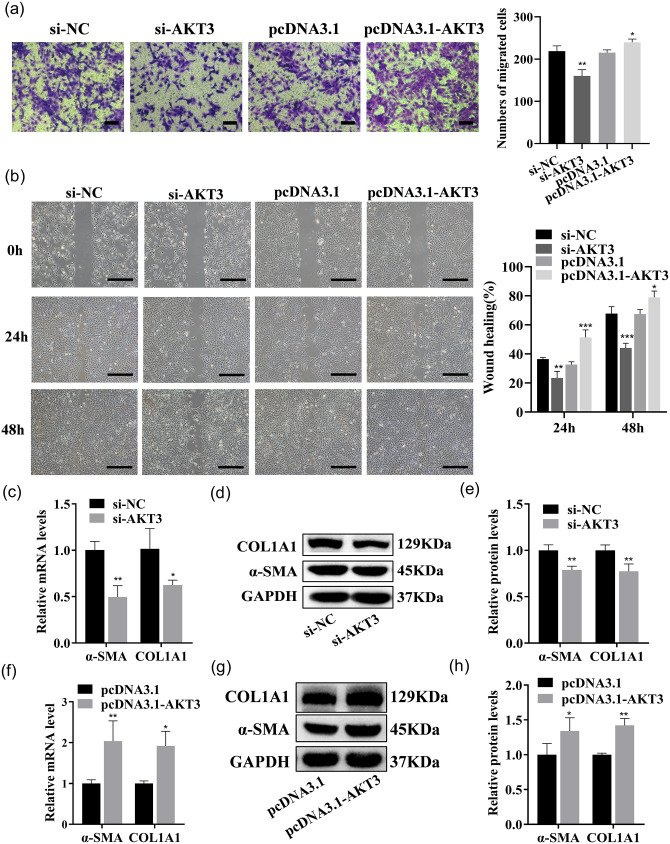
Hepatic fibrosis (HF) is a worldwide health problem for which there is no medically effective drug treatment at present, and which is characterized by activation of hepatic stellate cells (HSCs) and excessive extracellular matrix (ECM) deposition. The HF model in cholestatic rats by ligating the common bile duct was induced and the differentially expressed miRNAs in the liver tissues were analyzed by microarray, which showed that miR-22-3p and miR-29a-3p were significantly downregulated in bile-duct ligation (BDL) rat liver compared with the sham control. The synergistic anti-HF activity and molecular mechanism of miR-22-3p and miR-29a-3p by targeting AKT serine/threonine kinase 3 (AKT3) in HSCs were explored. The expression levels of miR-22-3p and miR-29a-3p were downregulated in activated LX-2 and human primary normal hepatic fibroblasts (NFs), whereas AKT3 was found to be upregulated in BDL rat liver and activated LX-2 cells. The proliferation, colony-forming, and migration ability of LX-2 were inhibited synergistically by miR-22-3p and miR-29a-3p. In addition, cellular senescence was induced and the expressions of the LX-2 fibrosis markers COL1A1 and α-SMA were inhibited by miR-22-3p and miR-29a-3p synergistically. Subsequently, these two miRNAs binding to the 3'UTR of AKT3 mRNA was predicted and evidenced by the luciferase reporter assay. Furthermore, the proliferation, migration, colony-forming ability, and the expression levels of COL1A1 and α-SMA were promoted and cellular senescence was inhibited by AKT3 in LX-2 cells. Thus, miR-22-3p/miR-29a-3p/AKT3 regulates the activation of HSCs, providing a new avenue in the study and treatment of HF.
Keywords: AKT3; HSC activation; Hepatic fibrosis; LX-2; miR-22-3p; miR-29a-3p.
Conflict of interest statement
The author(s) declared no potential conflicts of interest with respect to the research, authorship, and/or publication of this article.
Figures
Similar articles
-
miR-29a-3p suppresses hepatic fibrosis pathogenesis by modulating hepatic stellate cell proliferation via targeting PIK3R3 gene expression.Biochem Biophys Res Commun. 2020 Sep 3;529(4):922-929. doi: 10.1016/j.bbrc.2020.06.102. Epub 2020 Jul 30. Biochem Biophys Res Commun. 2020. PMID: 32819600
-
HSC-derived exosomal miR-199a-5p promotes HSC activation and hepatocyte EMT via targeting SIRT1 in hepatic fibrosis.Int Immunopharmacol. 2023 Nov;124(Pt B):111002. doi: 10.1016/j.intimp.2023.111002. Epub 2023 Oct 5. Int Immunopharmacol. 2023. PMID: 37804655
-
A miR-340/SPP1 axis inhibits the activation and proliferation of hepatic stellate cells by inhibiting the TGF-β1/Smads pathway.Adv Clin Exp Med. 2023 Apr;32(4):469-479. doi: 10.17219/acem/154996. Adv Clin Exp Med. 2023. PMID: 36413180
-
MicroRNA-29a-3p prevents Schistosoma japonicum-induced liver fibrosis by targeting Roundabout homolog 1 in hepatic stellate cells.Parasit Vectors. 2023 Jun 6;16(1):184. doi: 10.1186/s13071-023-05791-4. Parasit Vectors. 2023. PMID: 37280619 Free PMC article.
-
Hydroxysafflor yellow A exerts anti-fibrotic and anti-angiogenic effects through miR-29a-3p/PDGFRB axis in liver fibrosis.Phytomedicine. 2024 Sep;132:155830. doi: 10.1016/j.phymed.2024.155830. Epub 2024 Jun 15. Phytomedicine. 2024. PMID: 38959553
Cited by
-
Small extracellular vesicles derived from microRNA-22-3p-overexpressing mesenchymal stem cells protect retinal ganglion cells by regulating MAPK pathway.Commun Biol. 2024 Jul 3;7(1):807. doi: 10.1038/s42003-024-06511-z. Commun Biol. 2024. PMID: 38961177 Free PMC article.
-
The role of noncoding RNAs in the tumor microenvironment of hepatocellular carcinoma.Acta Biochim Biophys Sin (Shanghai). 2023 Nov 25;55(11):1697-1706. doi: 10.3724/abbs.2023231. Acta Biochim Biophys Sin (Shanghai). 2023. PMID: 37867435 Free PMC article. Review.
-
Advances in the study of the mechanism of action of miR‑22 in liver lesions (Review).Oncol Lett. 2024 Sep 6;28(5):541. doi: 10.3892/ol.2024.14674. eCollection 2024 Nov. Oncol Lett. 2024. PMID: 39310022 Free PMC article. Review.
-
MiR-22-3p as a promising predictor of nutritional deficiencies in patients with head and neck cancer subjected to intensity-modulated radiation therapy.Sci Rep. 2024 Nov 15;14(1):28120. doi: 10.1038/s41598-024-79641-3. Sci Rep. 2024. PMID: 39548174 Free PMC article.
References
-
- Senoo H, Yoshikawa K, Morii M, Miura M, Imai K, Mezaki Y. Hepatic stellate cell (vitamin A-storing cell) and its relative – past, present and future. Cell Biol Int 2010;34:1247–72 - PubMed
-
- Uko NE, Güner OF, Matesic DF, Bowen JP. Akt pathway inhibitors. Curr Top Med Chem 2020;20:883–900 - PubMed
-
- Revathidevi S, Munirajan AK. Akt in cancer: mediator and more. Semin Cancer Biol 2019;59:80–91 - PubMed
-
- Grabinski N, Möllmann K, Milde-Langosch K, Müller V, Schumacher U, Brandt B, Pantel K, Jücker M. AKT3 regulates ErbB2, ErbB3 and estrogen receptor α expression and contributes to endocrine therapy resistance of ErbB2(+) breast tumor cells from Balb-neuT mice. Cell Signal 2014;26:1021–9 - PubMed
Publication types
MeSH terms
Substances
LinkOut - more resources
Full Text Sources
Molecular Biology Databases
Research Materials
Miscellaneous