. 2022 Nov 23;16(11):1751-1761.
doi: 10.1093/ecco-jcc/jjac084.

CD147 Targeting by AC-73 Induces Autophagy and Reduces Intestinal Fibrosis Associated with TNBS Chronic Colitis

Affiliations

CD147 Targeting by AC-73 Induces Autophagy and Reduces Intestinal Fibrosis Associated with TNBS Chronic Colitis

Alessia Butera et al. J Crohns Colitis. .

Abstract

Background and aims: Intestinal fibrosis is a common complication of inflammatory bowel diseases. Medical treatment of intestinal fibrosis is an unmet therapeutic need. CD147 overexpression can induce myofibroblast differentiation associated with extracellular matrix deposition, favouring the development of fibrosis. To understand whether CD147 may promote intestinal fibrosis, we analysed its expression and blocked its function by using its specific inhibitor AC-73 [3-{2-[([1,1'-biphenyl]-4-ylmethyl) amino]-1-hydroxyethyl} phenol] in the murine TNBS [trinitrobenzenesulfonic acid]-chronic colitis model associated with intestinal fibrosis.

Methods: TNBS chronic colitis was induced by weekly intrarectal administration of escalating doses of TNBS. Ethanol-treated and untreated mice were used as controls. Separated groups of TNBS, ethanol-treated or untreated mice received AC-73 or vehicle administered intraperitoneally from day 21 to day 49. At day 49, mice were killed, and colons collected for histological analysis, protein and RNA extraction. CD147, α-SMA and activated TGF-β1 protein levels, CD147/ERK/STAT3 signalling pathway and autophagy were assessed by Western blot, collagen and inflammatory/fibrogenic cytokines mRNA tissue content by quantitative PCR.

Results: In mice with chronic TNBS colitis, CD147 protein level increased during fibrosis development in colonic tissue, as compared to control mice. CD147 inhibition by AC-73 treatment reduced intestinal fibrosis, collagen and cytokine mRNA tissue content, without significant modulation of activated TGF-β1 protein tissue content. AC-73 inhibited CD147/ERK1/2 and STAT3 signalling pathway activation and induced autophagy.

Conclusions: CD147 is a potential new target for controlling intestinal fibrosis and its inhibitor, AC-73, might represent a potential new anti-fibrotic therapeutic option in IBD.

Keywords: CD147; Intestinal fibrosis; autophagy.


Figures

Figure 1.
Figure 1.
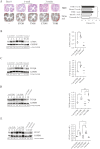
CD147 protein expression increases with fibrosis development in TNBS chronic colitis. [A] left: H&E and Sirius red collagen staining of representative colon cross-sections [magnification, 4×] of mice at time 0 and after TNBS or ethanol [ETOH] intrarectal administration for 1 and 3 weeks; right: % fibrosis. Data are mean values ± SE from five untreated mice on day 0, six ethanol-treated and TNBS-treated mice at 1 week, five ethanol-treated and six TNBS-treated mice at 3 weeks. *p<0.05 by Student’s t test. [B] Western blot analysis of α-SMA protein [42 kDa] and [C] activated TGF-β1 [25 kDa] protein expression levels in colonic tissue from 4-week TNBS-treated mice, as compared to 4-week ETOH treated mice and untreated control mice. One representative western blot out of three is shown; GAPDH is an internal control of total protein extracts. [D] Western blot analysis of activated TGF-β1 [25 kDa] protein expression level in colonic tissue from mice after 4 weeks [4wk-TNBS] and 7 weeks [7wk-TNBS] of intrarectal TNBS administration, as compared to mice receiving ethanol [4wk-ETOH, 7wk-ETOH]. [E] Western blot analysis of CD147 protein [50 kDa] expression level in colonic tissue from mice after 7 weeks of intrarectal TNBS administration [7wk-TNBS], as compared to colonic tissue from mice after 4 weeks of intrarectal TNBS administration [4wk-TNBS] and from control mice receiving ethanol alone [4wk-ETOH, 7wk-ETOH] or untreated. [B–E] Left: one representative western blotting with densitometric analysis of protein expression levels compared with GAPDH levels, out of three is shown; GAPDH is an internal control of total protein extracts; right: densitometric data [AU, arbitrary units] is represented as individual plots from 4-week TNBS [n = 6] and 7-week TNBS [n = 9] treated mice, 4-week ETOH [n = 3] and 7-week ETOH [n = 6] treated mice, and untreated mice [n = 3]. Lines indicate median values. ns [not significant]; *p<0.05; **p<0.01; ***p<0.001 from a Mann–Whitney test.
Figure 2.
Figure 2.
AC-73 administration significantly reduces intestinal fibrosis in mice with TNBS chronic colitis. [A] H&E staining and ImageJ analysis on Sirius red collagen staining [magnification 4×] of representative colon cross-sections of mice: [a] receiving intrarectal [i.r.] TNBS and AC-73 intraperitoneally [i.p.] [TNBS+AC-73]; [b] receiving i.r. TNBS and vehicle i.p. [TNBS+V]; [c] receiving ethanol i.r. and AC-73 i.p. [ETOH+AC-73]; [d] receiving ethanol i.r. and vehicle i.p. [ETOH+V]; [e] receiving AC-73 i.p. only [AC-73].]; [f] receiving Vehicle i.p. only [V]. H&E staining: [a] and [b]: some inflammatory cells infiltrating the sub-mucosa; [c] and [d]: few inflammatory cells infiltrating the sub-mucosa; [e] and [f]: rare inflammatory cells infiltrating the sub-mucosa [magnification, 4× and 40×]. [B] % fibrosis. Fibrosis was assessed as in the Methods. Data are mean values ± SE from at least: ten TNBS-treated mice per group, five ethanol-treated mice per group and three mice per group receiving vehicle or AC-73 only. [C] Histological scores. Mean values ± SE from at least: ten TNBS-treated mice per group, five ethanol-treated mice per group and three mice per group receiving vehicle or AC-73 only. **p<0.01, ***p<0.001 from Student’s t-test [B] or a Mann–Whitney test [C].
Figure 3.
Figure 3.
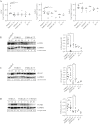
AC-73 administration decreases intestinal fibrosis without any significant modulation of CD147 and TGF-β1 protein expression levels in mice with TNBS chronic colitis. [A] Connective tissue growth factor [CTGF], collagen type I alpha 2 chain [Col1a2] and collagen type III alpha 1 chain [Col3a1] mRNA content by qPCR in colonic tissue from TNBS+V: mice receiving intrarectal [i.r.] TNBS and vehicle intraperitoneally [i.p.]; TNBS+AC-73: mice receiving TNBS i.r. and AC-73 i.p.; ETOH+V: mice receiving ethanol i.r. and vehicle i.p.; ETOH+AC-73: mice receiving ethanol i.r. and AC-73 i.p.; V: mice receiving vehicle i.p. only; AC-73: mice receiving AC-73 i.p. only. Data are represented as individual plots from at least: ten TNBS-treated mice per group, five ethanol-treated mice per group and three mice per group receiving vehicle or AC-73 only. Lines indicate median values. *p<0.05, ***p<0.001, from Mann-Whitney test. [B–D] Western blot analysis of [B] α-SMA protein, [C] CD147 protein and [D] TGF-β1 active protein levels. [B–D] Left: one representative western blot out of three is shown, with respective densitometry analysis of protein expression levels compared with GAPDH levels; GAPDH is an internal control of total protein extracts; right: densitometry analysis [A.U. = arbitrary units]: data are represented as individual plots from at least: ten TNBS-treated mice per group, five ethanol-treated mice per group and three mice per group receiving vehicle or AC-73 only. Mice group as in [A]. Lines indicate median values. ns, not significant, *p<0.05, **p<0.01, from a Mann–Whitney test.
Figure 4.
Figure 4.
Effect of AC-73 administration on cytokine mRNA tissue content Cytokine mRNA content by qPCR in colonic tissue from TNBS+V: mice receiving i.r. TNBS and vehicle i.p.; TNBS+AC-73: mice receiving i.r. TNBS and AC-73 i.p.; ETOH+V: mice receiving ethanol i.r. and vehicle i.p.; ETOH+AC-73: mice receiving ethanol i.r. and AC-73 i.p.; V: mice receiving vehicle i.p. only; AC-73: mice receiving AC-73 i.p. only. Data are represented as individual plots from at least: ten TNBS-treated mice per group, five ethanol-treated mice per group and three mice per group receiving vehicle or AC-73 only. Lines indicate median values. *p<0.05, **p<0.01, ***p<0.001 from a Mann–Whitney test.
Figure 5.
Figure 5.
AC-73 inhibits activation of the CD147/ERK1/2 and STAT3 signalling pathways and induces autophagy in mice with chronic TNBS colitis. [A, B] Western blot analysis of [A] ERK1/2 total [pan ERK1/2] and phosphorylated ERK1/2 [pERK1/2] protein expression levels, [B] STAT3 total [pan STAT3] and phosphorylated STAT3 [pSTAT3] protein expression levels. [A, B] Left: densitometric data are presented as the ratio of activated ERK to total ERK [pERK1/2/pan ERK1/2] and the ratio of activated STAT3 to total STAT3 [p-STAT3/pan STAT3]. [C] Western blot analysis of autophagy-related protein LC3 and its conversion from LC3-I to LC3-II in TNBS+AC-73, TNBS+V and ETOH+V mice; one representative western blot out of three is shown with densitometric data of the LC3B-II to LC3B-I ratio; GAPDH is an internal control of total protein extracts; right: densitometric data [A.U. = arbitrary units] represented as individual plots from at least: ten TNBS-treated mice per group and five ethanol-treated mice. Lines indicate median values. ns [not significant], *p<0.05, **p<0.01 from a Mann–Whitney test.

Similar articles

Cited by

References

    1. Chang JT. Pathophysiology of inflammatory bowel diseases. N Engl J Med 2020; 383:2652–64. - PubMed
    1. Rieder F, Latella G, Magro F, et al. . European Crohn’s and colitis organisation topical review on prediction, diagnosis and management of fibrostenosing Crohn’s Disease. J Crohns Colitis 2016;10:873–85. - PubMed
    1. Bernstein CN, LoftusNg EVSC, Lakatos PL, Moum B.. Epidemiology and natural history task force of the international organization for the study of inflammatory bowel disease (IOIBD). Hospitalisations and surgery in Crohn’s disease. Gut 2012;61:622–9. - PubMed
    1. Olaison G, Smedh K, Sjödahl R.. Natural course of Crohn’s disease after ileocolic resection: endoscopically visualised ileal ulcers preceding symptoms. Gut 1992;33:331–5. - PMC - PubMed
    1. Pallone F, Boirivant M, Stazi MA, Cosintino R, Prantera C, Torsoli A.. Analysis of clinical course of postoperative recurrence in Crohn’s disease of distal ileum. Dig Dis Sci 1992;37:215–9. - PubMed