

Experimental evaluation of absolute quantification in 99m Tc-TRODAT-1 SPECT/CT brain dopamine transporter (DAT) studies
- PMID: 35833589
- PMCID: PMC9359040
- DOI: 10.1002/acm2.13723
Experimental evaluation of absolute quantification in 99m Tc-TRODAT-1 SPECT/CT brain dopamine transporter (DAT) studies
Abstract
Objective: To evaluate the quantitative accuracy of clinical brain dopamine transporters (DAT) investigations utilizing 99m Tc-TRODAT-1 single-photon emission computed tomography (SPECT)/computed tomography (CT) in experimental and clinical settings.
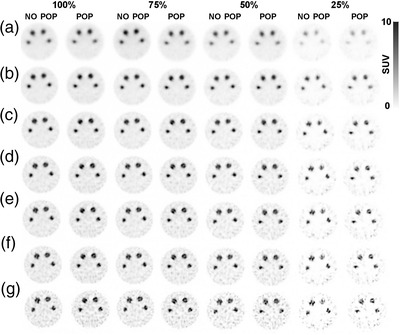
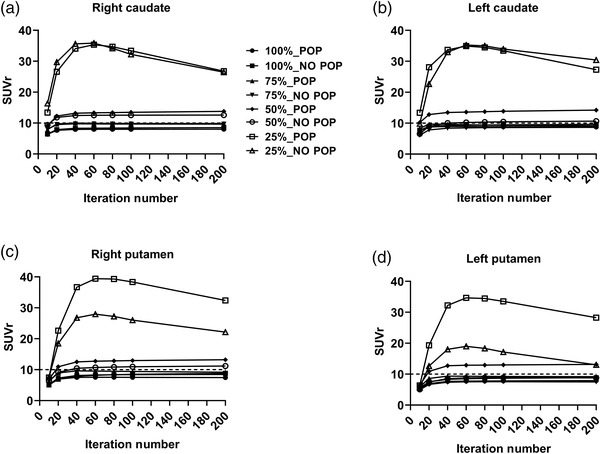
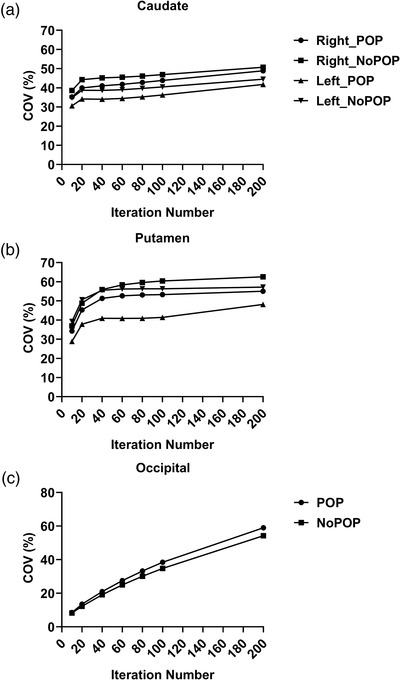
Materials and methods: The study used an experimental phantom evaluation and a clinical dataset. Three-dimensional-ordered subsets expectation-maximization reconstructed the original and resampled datasets using attenuation correction, scatter correction, and resolution recovery. The reconstructed data were analyzed and reported as percentage difference, standardized uptake value reference (SUVr), and a coefficient of variation (CoV). The Taguchi method tested the impact of the three different parameters on signal-to-noise ratio (SNR) and SUVr, including number iteration, Poisson resampling, and phantom setup, with and without the plaster of Paris (POP). Six 99m Tc-TRODAT-1 SPECT/CT scans were acquired in healthy subjects for verification purposes.
Results: The percentage activity difference between the phantom with and without POP is 20% and 5%, respectively. The SUVr reveals a 10% underestimate for both with and without POP. When it comes to the influence of Poisson resampling, the SUVr value for 75% Poisson resampling indicates 10% underestimation on both sides of the caudate and putamen area, with and without POP. When 25% of Poisson resampling is applied, the SUVr value is overestimated (±35%). In the Taguchi analysis, iteration numbers were the most dominant factor with the F-value of 9.41 and the contribution rate of 52.66% (p < 0.05) for SNR. In comparison, F-value of 9.1 for Poisson resampled with contribution rate of 58.91% (p < 0.05) for SUVr. Reducing counts by 25% from the original dataset resulted in a minimal bias in SUVr, compared to 50% and 75%.
Conclusion: The optimal absolute SPECT/CT quantification of brain DAT studies using 99m Tc-TRODAT-1 appears achievable with at least 4i10s and SUVr as the surrogate parameter. In clinical investigations, it is possible to reduce the recommended administered dose by up to 25% while maintaining accurate measurement.
Keywords: 99mTc-TRODAT-1; DAT; SPECT/CT; SUVr; quantification.
© 2022 The Authors. Journal of Applied Clinical Medical Physics published by Wiley Periodicals, LLC on behalf of The American Association of Physicists in Medicine.
Conflict of interest statement
No potential conflict of interest relevant to this article was reported.
Figures


Similar articles
-
A Pilot Study of the Striatal Dopamine Transporter Levels in Kratom-Dependent and Normal Subjects Using 99mTc-TRODAT-1 Single Photon Emission Computed Tomography-Computed Tomography (SPECT-CT).Cureus. 2023 Aug 10;15(8):e43251. doi: 10.7759/cureus.43251. eCollection 2023 Aug. Cureus. 2023. PMID: 37692587 Free PMC article.
-
Synthesis and evaluation of a 99mTc-labelled deuterated tropane derivative as a SPECT probe for dopamine transporter.Nucl Med Biol. 2025 Jul-Aug;146-147:109033. doi: 10.1016/j.nucmedbio.2025.109033. Epub 2025 May 28. Nucl Med Biol. 2025. PMID: 40446459
-
Evaluation of Tourette's syndrome by (99m)Tc-TRODAT-1 SPECT/CT imaging.Ann Nucl Med. 2010 Aug;24(7):515-21. doi: 10.1007/s12149-010-0389-3. Epub 2010 Jun 11. Ann Nucl Med. 2010. PMID: 20544324 Clinical Trial.
-
Reproducibility of brain dopamine transporter binding with Tc-99m TRODAT-1 SPECT in healthy young men.Psychiatry Res. 2012 Mar 31;201(3):222-5. doi: 10.1016/j.pscychresns.2011.07.004. Epub 2012 Apr 30. Psychiatry Res. 2012. PMID: 22551783
-
[2[[2-[[[3-(4-chlorophenyl)-8-methyl-8-azabicyclo[3,2,1]-oct-2-yl]-methyl](2-mercaptoethyl)amino]ethyl]amino]ethanethiolato(3-)-N2,N2’,S2,S2]oxo-[1R-exo-exo)])- [99mTc]-technetium.2007 Apr 24 [updated 2007 Dec 20]. In: Molecular Imaging and Contrast Agent Database (MICAD) [Internet]. Bethesda (MD): National Center for Biotechnology Information (US); 2004–2013. 2007 Apr 24 [updated 2007 Dec 20]. In: Molecular Imaging and Contrast Agent Database (MICAD) [Internet]. Bethesda (MD): National Center for Biotechnology Information (US); 2004–2013. PMID: 20641907 Free Books & Documents. Review.
References
-
- Camargo EE. Brain SPECT in neurology and psychiatry. J Nucl Med. 2001;42(611‐623):13. - PubMed
MeSH terms
Substances
Grants and funding
LinkOut - more resources
Full Text Sources
