Prognostic importance of the preoperative New-Naples prognostic score for patients with gastric cancer
- PMID: 35833662
- PMCID: PMC9883407
- DOI: 10.1002/cam4.5017
Prognostic importance of the preoperative New-Naples prognostic score for patients with gastric cancer
Abstract
Background: The wide applicability of the Naples prognostic score (NPS) is still worthy of further study in gastric cancer (GC). This study aimed to construct a New-NPS based on the differences in immunity and nutrition in patients with upper and lower gastrointestinal tumors to help obtain an individualized prediction of prognosis.
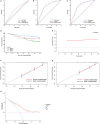
Methods: This study retrospectively analyzed patients who underwent radical gastrectomy from April 2014 to September 2016. The cutoff values of the preoperative neutrophil-to-lymphocyte ratio (NLR), lymphocyte-to-monocyte ratio (LMR), serum albumin (Alb), and total cholesterol (TC) were calculated by ROC curve analysis. ROC and t-ROC were used to evaluate the accuracy of the prognostic markers. The Kaplan-Meier method and log-rank test were used to analyze the overall survival probability. Univariate and multivariate analyses based on Cox risk regression were used to show the independent predictors. The nomogram was made by R studio. The predictive accuracy of nomogram was assessed using a calibration plot, concordance index (C-index), and decision curve.
Results: A total of 737 patients were included in training cohort, 411 patients were included in validation cohort. ROC showed that the New-NPS was more suitable for predicting the prognosis of GC patients. NPS = 2 indicated a poor prognosis. Multivariate analysis showed that CEA (P = 0.026), Borrmann type (P = 0.001), pTNM (P < 0.001), New-NPS (P < 0.001), and nerve infiltration (P = 0.035) were independent risk factors for prognosis.
Conclusion: The New-NPS based on the cutoff values of NLR, LMR, Alb, and TC is not only suitable for predicting prognosis but can also be combined with clinicopathological characteristics to construct a nomogram model for GC patients.
Keywords: GC; Naples; nomogram; prognosis.
© 2022 The Authors. Cancer Medicine published by John Wiley & Sons Ltd.
Conflict of interest statement
The authors declare that they have no conflict of interest.
Figures


Similar articles
-
The value of the preoperative Naples prognostic score in predicting prognosis in gallbladder cancer surgery patients.World J Surg Oncol. 2023 Sep 25;21(1):303. doi: 10.1186/s12957-023-03198-0. World J Surg Oncol. 2023. PMID: 37743468 Free PMC article.
-
[Relationship between preoperative inflammatory indexes and prognosis of patients with rectal cancer and establishment of prognostic nomogram prediction model].Zhonghua Zhong Liu Za Zhi. 2022 May 23;44(5):402-409. doi: 10.3760/cma.j.cn112152-20200630-00612. Zhonghua Zhong Liu Za Zhi. 2022. PMID: 35615796 Chinese.
-
Prognostic value of pre-operative inflammatory response biomarkers in gastric cancer patients and the construction of a predictive model.J Transl Med. 2015 Feb 18;13:66. doi: 10.1186/s12967-015-0409-0. J Transl Med. 2015. PMID: 25885254 Free PMC article.
-
Prognostic Value of Inflammatory Biomarkers in Gastric Cancer Patients and the Construction of a Predictive Model.Dig Surg. 2019;36(5):433-442. doi: 10.1159/000493432. Epub 2018 Oct 9. Dig Surg. 2019. PMID: 30300879
-
[Establishment and validation of a predictive nomogram model for advanced gastric cancer with perineural invasion].Zhonghua Wei Chang Wai Ke Za Zhi. 2020 Nov 25;23(11):1059-1066. doi: 10.3760/cma.j.cn.441530-20200103-00004. Zhonghua Wei Chang Wai Ke Za Zhi. 2020. PMID: 33212554 Chinese.
Cited by
-
A prognostic marker LTBP1 is associated with epithelial mesenchymal transition and can promote the progression of gastric cancer.Funct Integr Genomics. 2024 Feb 15;24(1):30. doi: 10.1007/s10142-024-01311-4. Funct Integr Genomics. 2024. PMID: 38358412
-
Clinical significance of the modified Naples prognostic score in patients with stage II-III colon cancer undergoing curative resection: a retrospective study from the real world.Front Oncol. 2024 Sep 16;14:1403666. doi: 10.3389/fonc.2024.1403666. eCollection 2024. Front Oncol. 2024. PMID: 39351349 Free PMC article.
-
Naples Prognostic Score (NPS) as a Novel Prognostic Score for Stage III Breast Cancer Patients: A Real-World Retrospective Study.Breast Cancer (Dove Med Press). 2025 May 12;17:403-421. doi: 10.2147/BCTT.S519742. eCollection 2025. Breast Cancer (Dove Med Press). 2025. PMID: 40385228 Free PMC article.
-
Naples Prognostic Score as a Novel Prognostic Prediction Tool for Resectable Locally Advanced Esophageal Squamous Cell Carcinoma After Neoadjuvant Therapy.J Inflamm Res. 2025 Apr 8;18:4843-4856. doi: 10.2147/JIR.S502058. eCollection 2025. J Inflamm Res. 2025. PMID: 40230436 Free PMC article.
-
Significance of Naples prognostic score for postoperative complications after colorectal cancer surgery.Surg Today. 2025 May 7. doi: 10.1007/s00595-025-03055-5. Online ahead of print. Surg Today. 2025. PMID: 40332592
References
-
- Global Burden of Disease Cancer C , Fitzmaurice C, Abate D, et al. Global, regional, and National Cancer Incidence, mortality, years of life lost, years lived with disability, and disability‐adjusted life‐years for 29 cancer groups, 1990 to 2017: a systematic analysis for the global burden of disease study. JAMA Oncol. 2019;5(12):1749‐1768. doi:10.1001/jamaoncol.2019.2996 - DOI - PMC - PubMed
Publication types
MeSH terms
LinkOut - more resources
Full Text Sources
Medical
Miscellaneous

