. 2022 Jul 15;149(14):dev200633.
doi: 10.1242/dev.200633. Epub 2022 Jul 14.

Postnatal eye size in mice is controlled by SREBP2-mediated transcriptional repression of Lrp2 and Bmp2

Affiliations

Postnatal eye size in mice is controlled by SREBP2-mediated transcriptional repression of Lrp2 and Bmp2

Shuyi Mai et al. Development. .

Abstract

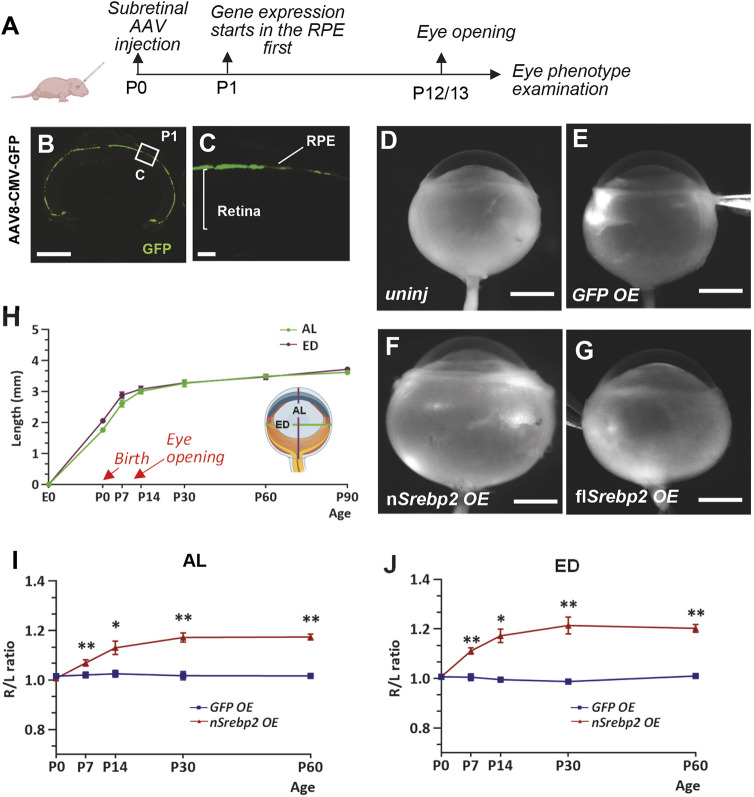
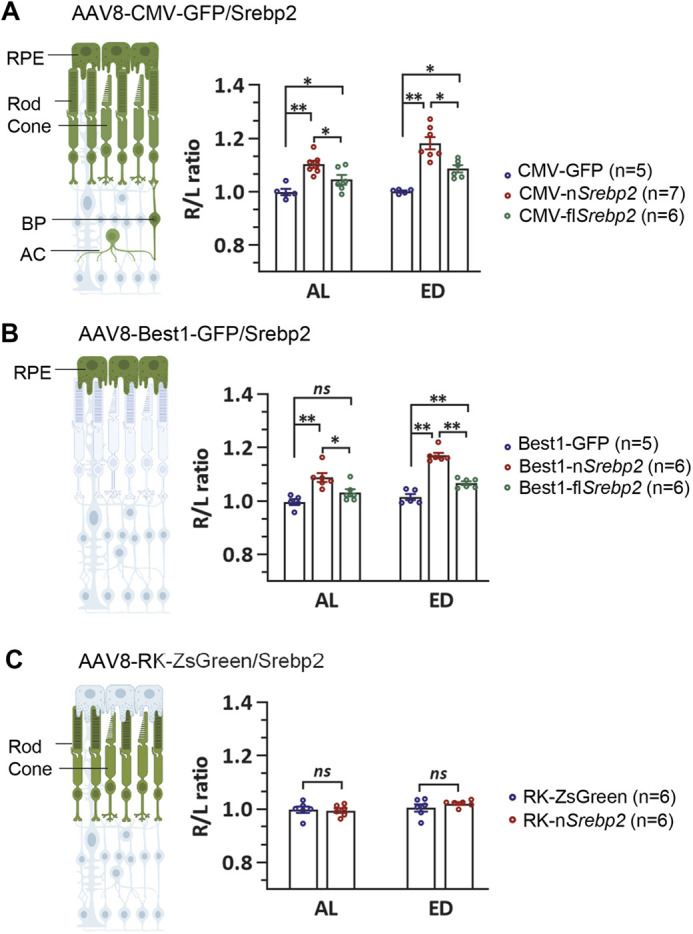
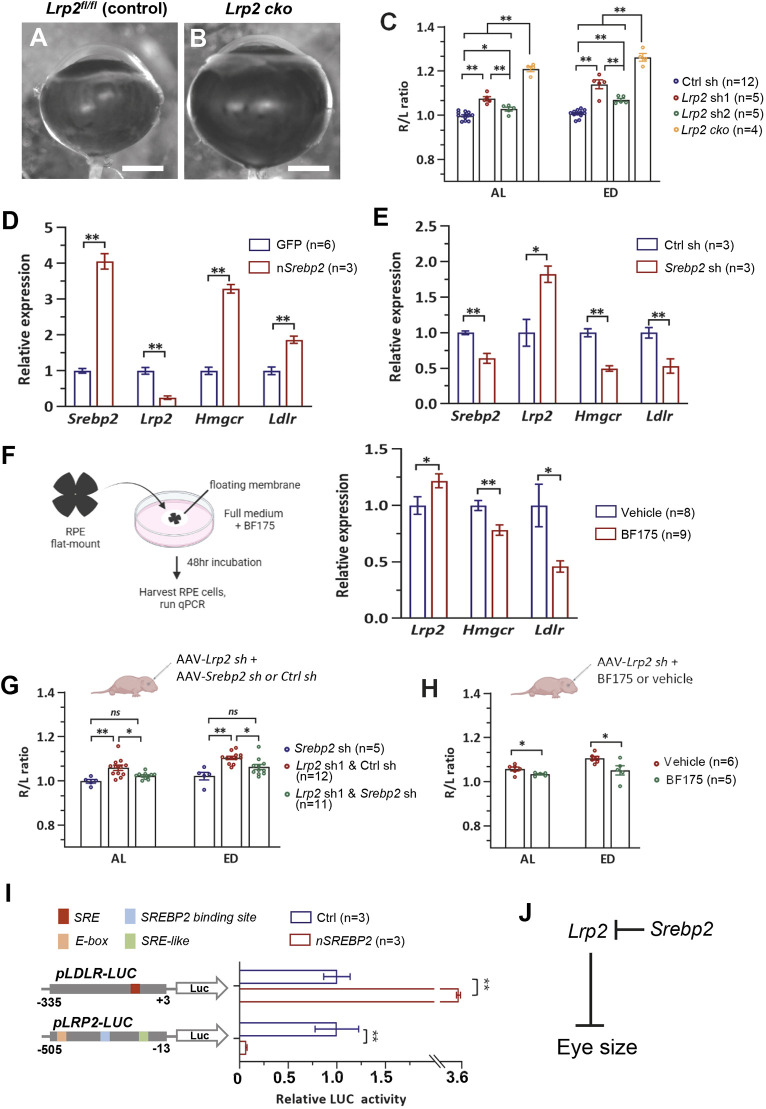
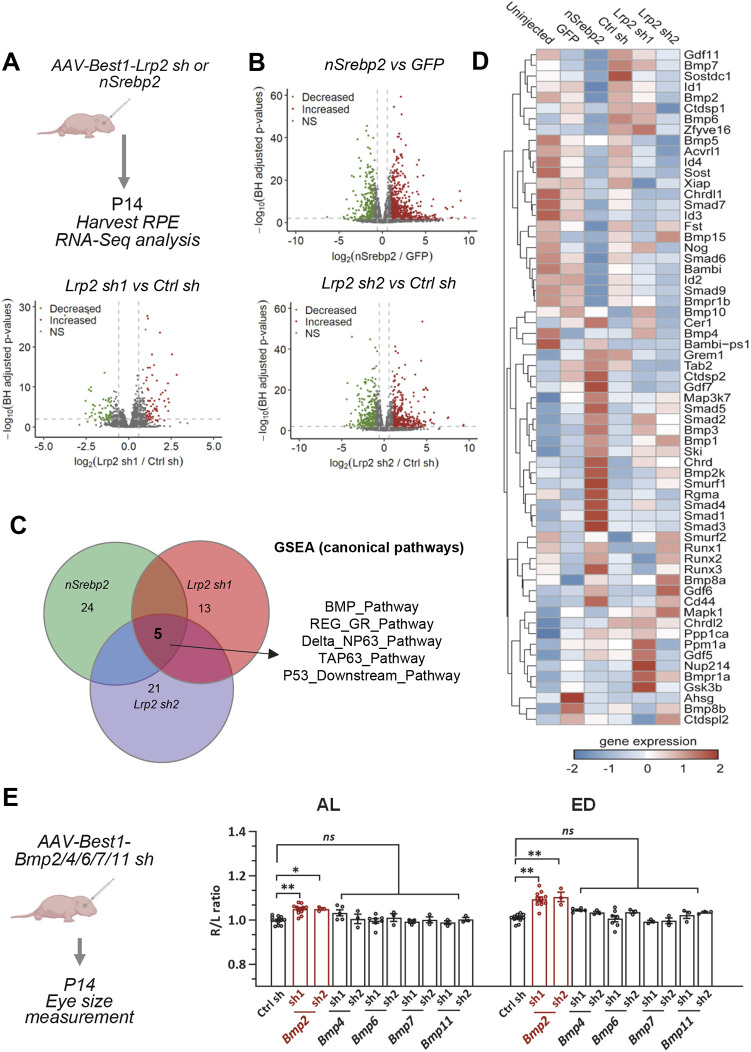
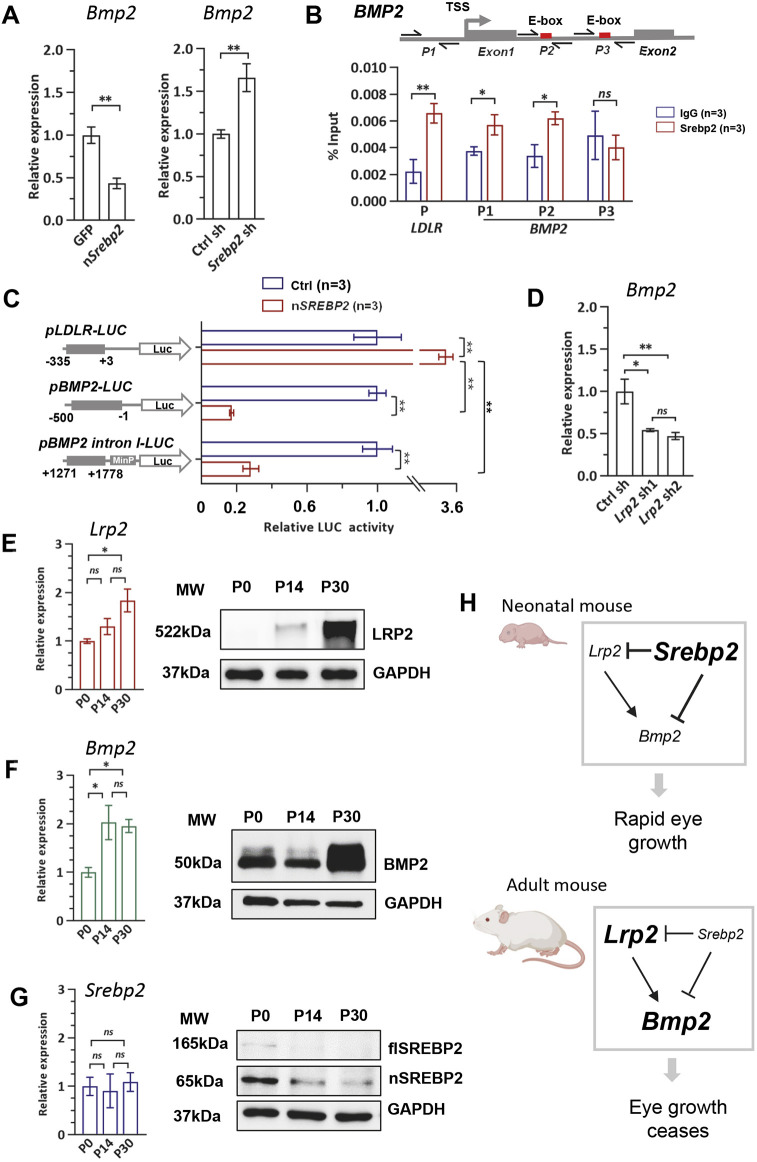
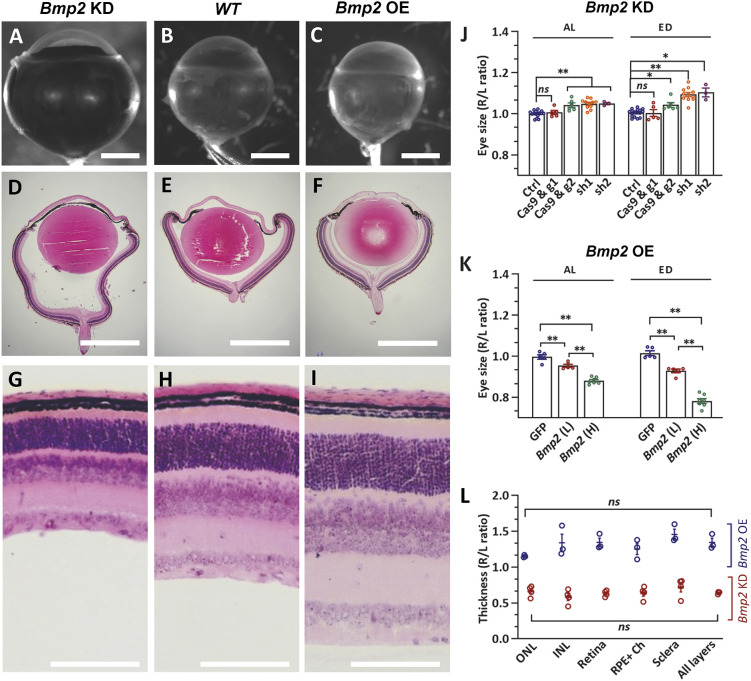
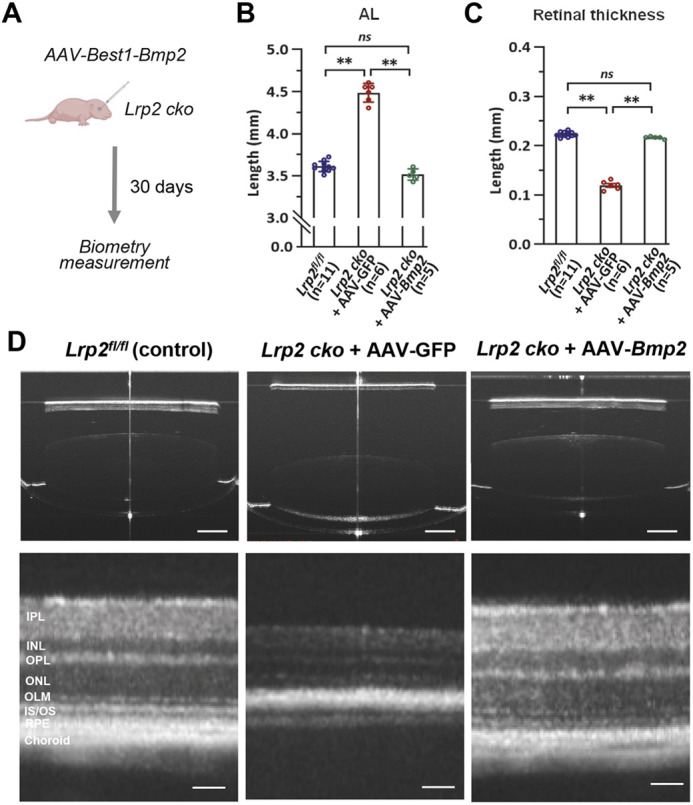
Eye size is a key parameter of visual function, but the precise mechanisms of eye size control remain poorly understood. Here, we discovered that the lipogenic transcription factor sterol regulatory element-binding protein 2 (SREBP2) has an unanticipated function in the retinal pigment epithelium (RPE) to promote eye size in postnatal mice. SREBP2 transcriptionally represses low density lipoprotein receptor-related protein 2 (Lrp2), which has been shown to restrict eye overgrowth. Bone morphogenetic protein 2 (BMP2) is the downstream effector of Srebp2 and Lrp2, and Bmp2 is suppressed by SREBP2 transcriptionally but activated by Lrp2. During postnatal development, SREBP2 protein expression in the RPE decreases whereas that of Lrp2 and Bmp2 increases as the eye growth rate reduces. Bmp2 is the key determinant of eye size such that its level in mouse RPE inversely correlates with eye size. Notably, RPE-specific Bmp2 overexpression by adeno-associated virus effectively prevents the phenotypes caused by Lrp2 knock out. Together, our study shows that rapid postnatal eye size increase is governed by an RPE-derived signaling pathway, which consists of both positive and negative regulators of eye growth.

Keywords: Bmp2; LRP2; Eye; Organ size; Retinal pigment epithelium; SREBP2.


Conflict of interest statement

Competing interests The authors declare no competing or financial interests.

Figures

Fig. 1.
Fig. 1.
SREBP2 promotes mouse eye size growth during early postnatal development. (A) Schematic showing the experimental design. (B,C) Expression of the GFP reporter starts in the RPE at 1 day post AAV-CMV-GFP infection (1E9 vg/eye). Boxed area is enlarged and shown in C. Scale bars: 500 μm (B); 50 μm (C). (D-G) Representative images of uninjected eyes and eyes infected by AAV8-CMV-GFP/nSrebp2/flSrebp2 (1E9 vg/eye) at P0 and harvested at P14. Scale bars: 1 mm. uninj, uninjected; OE, overexpression. (H) Growth curve of mouse eye. AL, axial length; ED, equatorial diameter. P0 n=22; P7 n=19; P14 n=37; P30 n=58; P60 n=28; P90 n=6. (I,J) Time-course examination of the AL and ED increase induced by nSREBP2 overexpression. Data are represented as the ratio of injected right eye (R)/uninjected left eye (L). GFP: P0 n=10; P7 n=4; P14 n=4; P30 n=6; P60 n=6; nSREBP2: P0 n=11; P7 n=4; P14 n=7; P30 n=5; P60 n=6. Data are mean±s.e.m.; *P<0.05, **P<0.01 (unpaired Student's t-test).
Fig. 2.
Fig. 2.
SREBP2 functions in the RPE to control eye growth. (A-C) Size comparison of eyes infected by different viruses. The diagrams on the left illustrate the cell types with the targeted gene expression (green) by the AAV8 virus with different promoters. The indicated viruses were injected at P0, and eyes were harvested at P14. All viruses were injected at a concentration of 1E9 vg/eye. Data are represented as the ratio of injected right eye (R)/uninjected left eye (L). Data are mean±s.e.m.; *P<0.05, **P<0.01 (one-way ANOVA analysis with post-hoc Tukey test) (A,B) or unpaired Student's t-test (C). AC, amacrine cell; BP, bipolar cell; ns, no significant difference.
Fig. 3.
Fig. 3.
SREBP2 transcriptionally suppresses Lrp2. (A,B) Representative eye images of control mice (Lrp2fl/fl without Cre) or Lrp2 conditional knockout (cko) mice. Lrp2 cko was induced by injecting AAV8-Best1-Cre (1E7 vg/eye) to Lrp2fl/fl mouse eyes at P0. Scale bars: 1 mm. (C) Quantification of eye size. AAV8-Best1-Ctrl sh/Lrp2 sh1/Lrp2 shRNA2 (sh2) viruses were injected at a concentration of 1E9 vg/eye, and AAV8-Best1-Cre was injected at a concentration of 1E7 vg/eye. (D,E) Expression levels of Srebp2, Lrp2, Hmgcr and Ldlr determined by qPCR when nSREBP2 was overexpressed (D) or knocked down (E) in the mouse RPE. The mouse eyes were injected by AAV8-Best1-GFP/nSrebp2 (D) or Ctrl sh/Srebp2 sh (E) (1E9 vg/eye) at P0 and harvested at P14. Expression levels were normalized to Gapdh mRNA and expressed relative to the GFP/Ctrl sh control. (F) Left: Schematic of the experimental design. Right: Expression levels of Lrp2, Hmgcr and Ldlr determined by qPCR in RPE explant cultures with or without BF175 treatment. Expression levels were normalized to Gapdh mRNA and expressed relative to the vehicle-treated control. (G) Quantification of eye size. Eyes were injected with AAV8-Best1-Lrp2 sh1 alone, AAV8-Best1-Lrp2 sh1+AAV8-Best1-Ctrl sh or Srebp2 sh. For combined injection, viruses were mixed at a 1:1 ratio and injected at a total concentration of 2E9 vg/eye. (H) Quantification of eye size. Eyes were injected with AAV8-Best1-Lrp2 sh1 with vehicle or BF175. (I) Relative luciferase activity was determined in HEK293 cells. A luciferase reporter containing the human LDLR promoter (−335/+3) or LRP2 promoter (−505/−13) was co-transfected with pCAG-Cre (Ctrl) or pCAG-human nSREBP2. Relative luciferase activity was normalized to Renilla luciferase activity. Schematic on the left shows the designs of the reporter constructs. (J) An illustration showing a working model, in which Srebp2 promotes mouse eye size by repressing Lrp2, which is an inhibitor of eye overgrowth. All viruses were injected at P0, and eyes were harvested at P14 (C,G,H). Data are represented as the ratio of injected right eye (R)/uninjected left eye (L) (C,G,H). All data are shown as mean±s.e.m. *P<0.05, **P<0.01 (one-way ANOVA analysis with post-hoc Tukey test for C,G or unpaired Student's t-test for D-F,H,I). ns, no significant difference
Fig. 4.
Fig. 4.
BMP2 is the downstream effector of Srebp2 and Lrp2. (A) Schematic showing the experimental design. (B) Volcano plots illustrating genes that were differentially expressed between the enlarged eye groups and controls. Genes significantly upregulated and downregulated (BH-adjusted P<0.05, |log2FC|>1) are shown in red and green, respectively. Values are presented as −log10 (BH-adjusted P-value). (C) GSEA suggests five significantly enriched canonical pathways shared by the three enlarged eye groups. The number of significantly enriched (P<0.05) pathways in each group is also indicated in the circle. (D) Heatmap of the gene expression levels of BMP pathway components. Genes were clustered based on hierarchical clustering on z-normalized expression levels (red: high; blue: low). (E) Left: Schematic showing the experimental design. All viruses were injected at a concentration of 1E9 vg/eye. Right: Quantification of AL and ED. Data are represented as the ratio of injected right eye (R)/uninjected left eye (L). Ctrl sh n=12; Bmp2 sh1 n=11; Bmp2 sh2 n=3; Bmp4 sh1 n=5; Bmp4 sh2 n=3; Bmp6 sh1 n=7; Bmp6 sh2 n=3; Bmp7/11 sh1/2 n=3. Data are mean±s.e.m. *P<0.05, **P<0.01 (one-way ANOVA with post-hoc Tukey test). ns, no significant difference
Fig. 5.
Fig. 5.
The SREBP2-LRP2-BMP2 signaling axis regulates postnatal eye growth. (A) Bmp2 expression levels determined by qPCR in mouse RPE with nSREBP2 overexpression or with Srebp2 knockdown. Mouse eyes were injected with AAV8-Best1-GFP/nSrebp2 or Ctrl sh/Srebp2 sh (1E9 vg/eye) at P0 and harvested at P14. Expression levels were normalized to Gapdh mRNA and expressed relative to the GFP/Ctrl sh control. GFP/nSrebp2 n=3; Ctrl sh n=4; Srebp2 sh n=3. (B) Top: Illustration showing the two E-box motifs in intron 1 of the human BMP2 gene and the ChIP-qPCR primer positions. P1, primer set 1; P2, primer set 2; P3, primer set 3; TSS, transcription start site. Bottom: ChIP-qPCR showed SREBP2 protein enrichment at the promoter as well as at the first E-box motif of the human BMP2 gene in ARPE19 cells. (C) Relative luciferase activity of reporters containing the human LDLR promoter (−335/+3), BMP2 promoter (−500/−1) or BMP2 intron I (+1271/+1778) fused with a minimal promoter (minP). (D) Bmp2 expression levels determined by qPCR in mouse RPE with Lrp2 knockdown. Ctrl sh n=4; Lrp2 sh1 n=3; Lrp2 sh2 n=6. (E-G) Relative mRNA expression and western blotting of Lrp2, Bmp2 and Srebp2 in the RPE of wild-type mice at three different ages. P0 n=5; P14 n=7; P30 n=7. Expression levels were normalized to Gapdh mRNA and expressed relative to P0. All data are shown as mean±s.e.m. *P<0.05, **P<0.01 (unpaired Student's t-test for A-C and one-way ANOVA with post-hoc Tukey test for D,E). ns, no significant difference. (H) Schematic illustrating a working model based on our data. High Srebp2 and low Lrp2/Bmp2 promote the rapid eye size increase in neonatal mice, whereas low Srebp2 and high Lrp2/Bmp2 ensure that eye growth stops at the proper size in adult mice.
Fig. 6.
Fig. 6.
Mouse eye size is inversely correlated with Bmp2 level in the RPE. (A-C) Representative images of control eyes, eyes with Bmp2 knockdown (KD) and eyes with Bmp2 overexpression (OE). Scale bars: 1 mm. (D-I) Low and high magnification images of H&E-stained cross-sections. Scale bars: 1 mm (D-F); 100 μm (G-I). (J) Quantification of eye size in the Bmp2 KD condition. Ctrl n=16; Cas9, g1 n=5; Cas9, g2 n=6; sh1 n=11; sh2 n=3. (K) Quantification of eye size in the Bmp2 overexpression condition. L, low titer (2E6 vg/eye); H, high titer (1E7 vg/eye). GFP n=5; Bmp2 (L) n=5; Bmp2 (H) n=7. (L) Quantification of major ocular layer thickness in Bmp2 KD (n=4) and Bmp2 OE (n=3) groups. Ch, choroid; INL, inner nuclear layer; ONL, outer nuclear layer. Data are represented as the ratio of injected right eye (R)/uninjected left eye (L). n=3-16 per group. Data are mean±s.e.m. *P<0.05, **P<0.01 (one-way ANOVA with post-hoc Tukey test). ns, no significant difference.
Fig. 7.
Fig. 7.
AAV-Bmp2 treatment effectively prevents eye enlargement caused by Lrp2 loss. (A) Schematic of the experimental design. (B,C) Quantification of AL and retinal thickness of the indicated groups. Data are mean±s.e.m. *P<0.05, **P<0.01 (one-way ANOVA with post-hoc Tukey test). ns, no significant difference (D) Representative OCT images showing ocular axial length (top) and retinal thickness (bottom) of the indicated groups. Scale bars: 1 mm (top panels); 100 μm (bottom panels). INL, inner nuclear layer; IPL, inner plexiform layer; IS/OS, inner segment/outer segment; OLM, outer limiting membrane; ONL, outer nuclear layer; OPL, outer plexiform layer.

Similar articles

Cited by

References

    1. Amemiya-Kudo, M., Shimano, H., Hasty, A. H., Yahagi, N., Yoshikawa, T., Matsuzaka, T., Okazaki, H., Tamura, Y., Iizuka, Y., Ohashi, K.et al. (2002). Transcriptional activities of nuclear SREBP-1a, -1c, and -2 to different target promoters of lipogenic and cholesterogenic genes. J. Lipid Res. 43, 1220-1235. 10.1194/jlr.M100417-JLR200 - DOI - PubMed
    1. Athanikar, J. N. and Osborne, T. F. (1998). Specificity in cholesterol regulation of gene expression by coevolution of sterol regulatory DNA element and its binding protein. Proc. Natl. Acad. Sci. USA 95, 4935-4940. 10.1073/pnas.95.9.4935 - DOI - PMC - PubMed
    1. Aziz, A., Fakhoury, O., Matonti, F., Pieri, E. and Denis, D. (2015). [Epidemiology and clinical characteristics of primary congenital glaucoma]. J. Fr. Ophtalmol. 38, 960-966. 10.1016/j.jfo.2015.04.018 - DOI - PubMed
    1. Bainbridge, J. W. B., Smith, A. J., Barker, S. S., Robbie, S., Henderson, R., Balaggan, K., Viswanathan, A., Holder, G. E., Stockman, A., Tyler, N.et al. (2008). Effect of gene therapy on visual function in Leber's congenital amaurosis. N. Engl. J. Med. 358, 2231-2239. 10.1056/NEJMoa0802268 - DOI - PubMed
    1. Brown, M. S. and Goldstein, J. L. (1997). The SREBP pathway: regulation of cholesterol metabolism by proteolysis of a membrane-bound transcription factor. Cell 89, 331-340. 10.1016/S0092-8674(00)80213-5 - DOI - PubMed

Publication types

MeSH terms

Substances