. 2022 Sep 5;219(9):e20212126.
doi: 10.1084/jem.20212126. Epub 2022 Jul 14.

Pathogenic autoantibodies to IFN-γ act through the impedance of receptor assembly and Fc-mediated response

Affiliations

Pathogenic autoantibodies to IFN-γ act through the impedance of receptor assembly and Fc-mediated response

Han-Po Shih et al. J Exp Med. .

Abstract

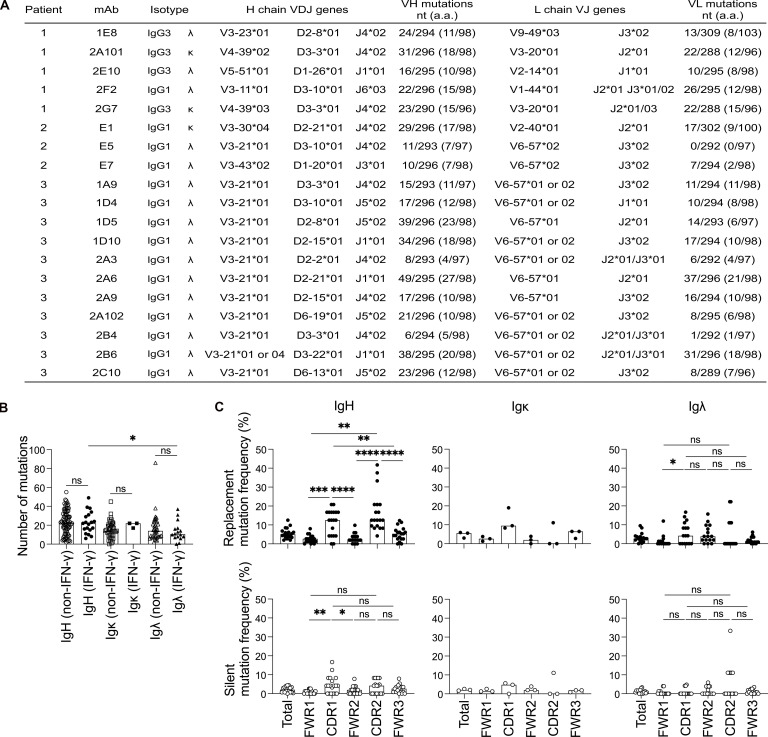
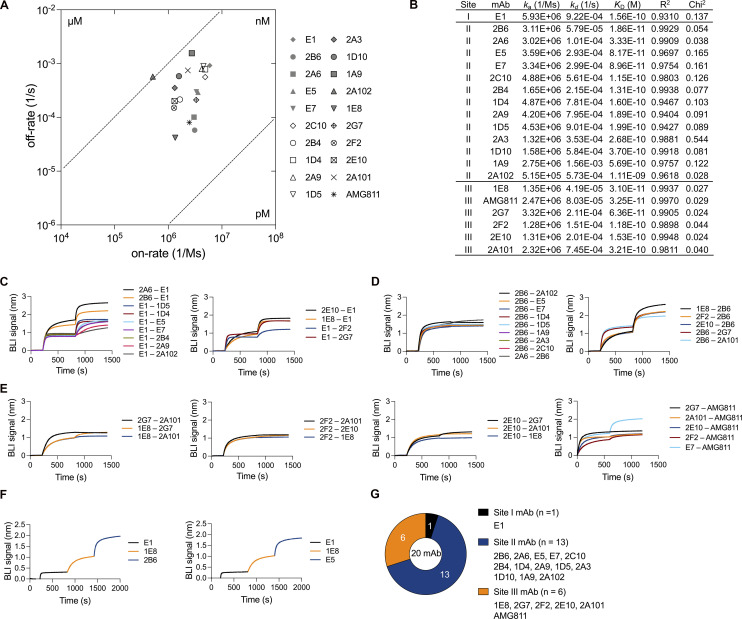
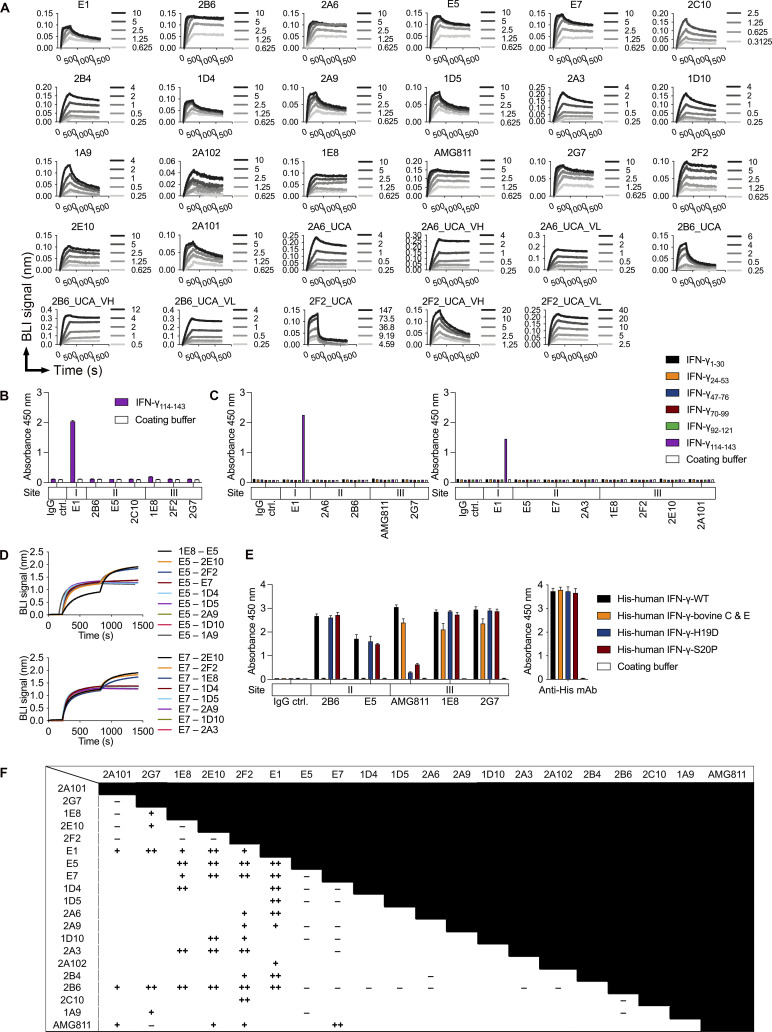
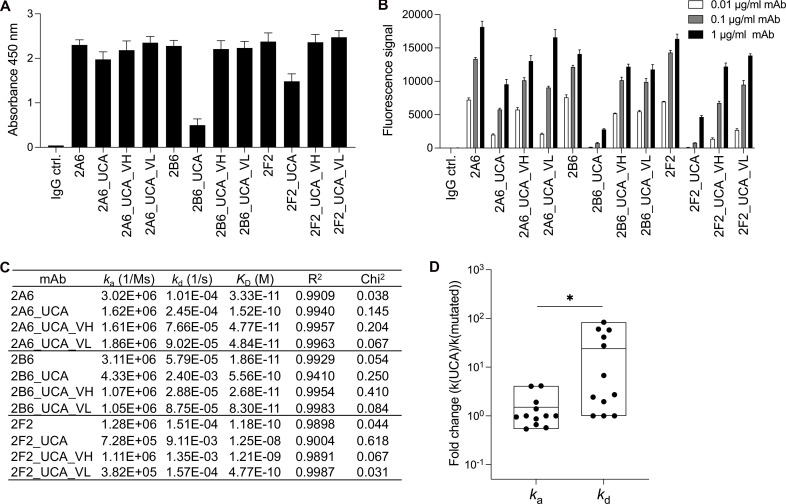
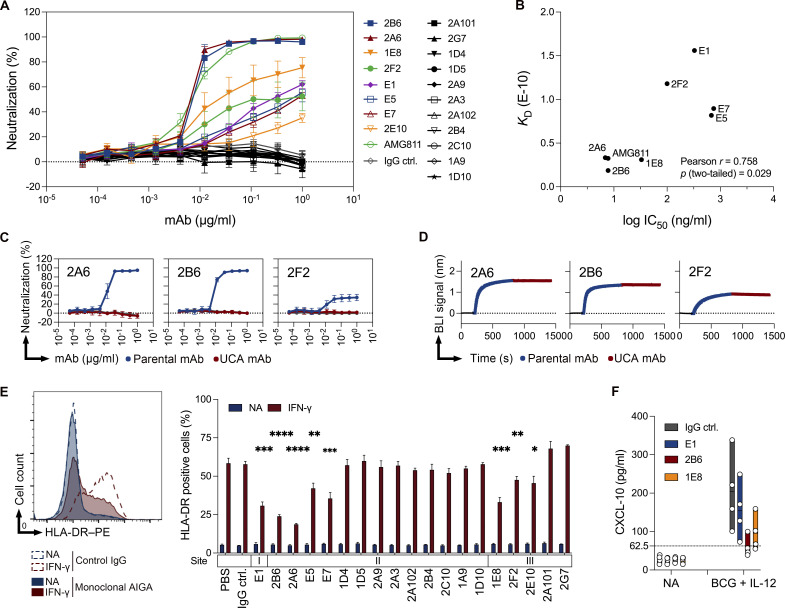
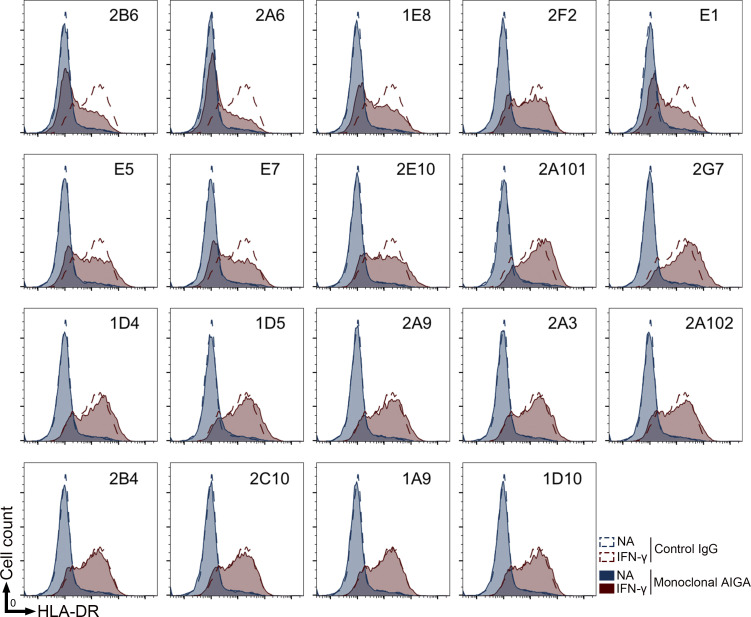
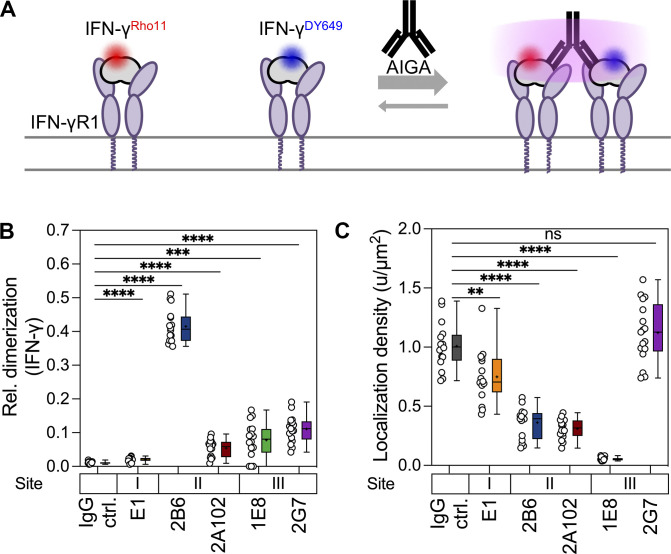
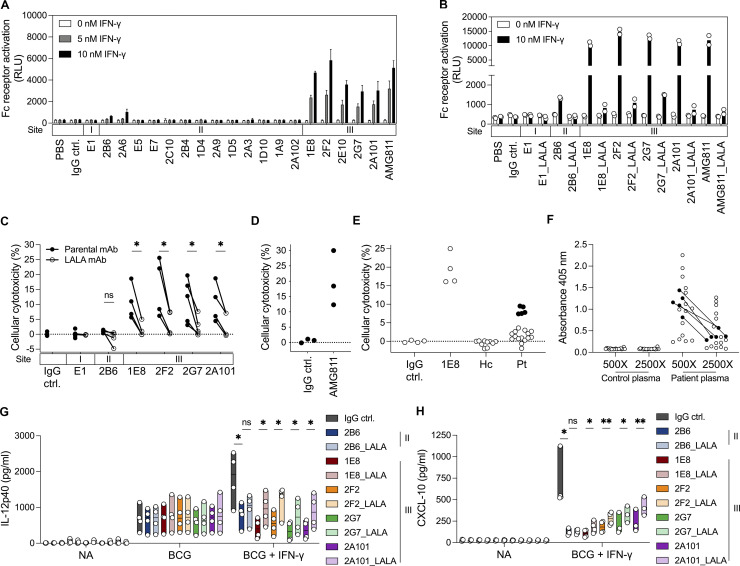
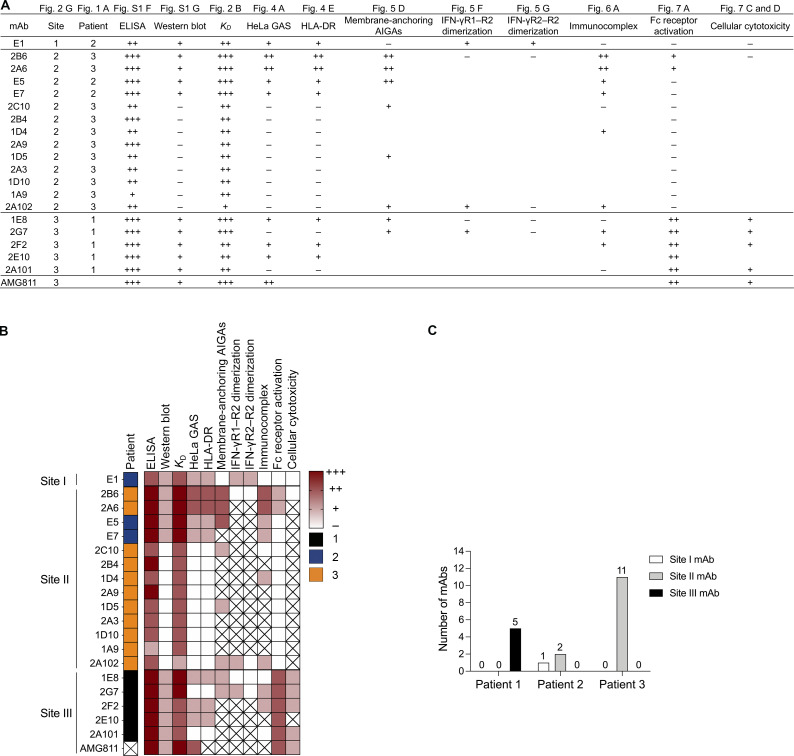
Anti-interferon (IFN)-γ autoantibodies (AIGAs) are a pathogenic factor in late-onset immunodeficiency with disseminated mycobacterial and other opportunistic infections. AIGAs block IFN-γ function, but their effects on IFN-γ signaling are unknown. Using a single-cell capture method, we isolated 19 IFN-γ-reactive monoclonal antibodies (mAbs) from patients with AIGAs. All displayed high-affinity (KD < 10-9 M) binding to IFN-γ, but only eight neutralized IFN-γ-STAT1 signaling and HLA-DR expression. Signal blockade and binding affinity were correlated and attributed to somatic hypermutations. Cross-competition assays identified three nonoverlapping binding sites (I-III) for AIGAs on IFN-γ. We found that site I mAb neutralized IFN-γ by blocking its binding to IFN-γR1. Site II and III mAbs bound the receptor-bound IFN-γ on the cell surface, abolishing IFN-γR1-IFN-γR2 heterodimerization and preventing downstream signaling. Site III mAbs mediated antibody-dependent cellular cytotoxicity, probably through antibody-IFN-γ complexes on cells. Pathogenic AIGAs underlie mycobacterial infections by the dual blockade of IFN-γ signaling and by eliminating IFN-γ-responsive cells.


Conflict of interest statement

Disclosures: H.-P. Shih, J.-Y. Ding, C.-H. Lin, J.-Y. Huang, and C.-L. Ku reported a patent to US 10,968,274 B2 issued. No other disclosures were reported.

Figures

Figure S1.
Figure S1.
Isolation and generation of pathogenic monoclonal AIGAs from patients underlying mycobacterial diseases. (A) Identification of AIGAs in patient plasma (n = 3) by ELISA. Bar graph of antibody binding to IFN-γ (2 μg/ml) in several dilutions of plasma (100×, 500×, and 2,500×). Each dot corresponds to a donor. (B) HLA-DRB1 and -DQB1 alleles in recruited patients with AIGAs. (C and D) Evaluation of the biological function of AIGAs from three recruited patients. (C) Amount of IFN-γ detected in whole-blood activation assays (NA, BCG, and BCG + 20 ng/ml IL-12) on blood samples from the corresponding donors. Each dot corresponds to a donor. (D) Amount of IL-12p40 detected in whole-blood activation assays (NA, BCG, and BCG + 250 ng/ml IFN-γ) on blood from the corresponding donors. Each dot corresponds to a donor. (E) Isolation of single IFN-γ–specific IgG+CD19+ B cells from patients with mycobacterial disease. Representative flow cytometry plots showing the gating strategy for human IFN-γ–specific B cells from the PBMCs from three patients. Black boxes indicate each successive gate used. Lymphocytes, identified on the basis of forward and side scatter (FSC and SSC), were further analyzed by FSC-A vs. FSC-H comparisons and with 7-aminoactinomycin D staining to eliminate doublets and dead cells. CD19+CD3 cells were then selected, followed by IgG+IgD cells, to obtain enrichment in specific B cells binding to IFN-γ, which were stained with a FITC-conjugated antibody. IFN-γ+ cells were then sorted from IgG+ subsets. (F) Bar graph showing the reactivity of the 19 monoclonal AIGAs and AMG811 (1 μg/ml) with recombinant human IFN-γ (2 μg/ml), as determined by ELISA. The results are shown as the mean and SD for two independent experiments. (G) Western blot showing the reactivity of 19 monoclonal AIGAs, AMG811, and control IgG (ctrl.; 1 μg/ml) with the recombinant human IFN-γ protein (300 ng/well). The experiments were performed twice, independently. Source data are available for this figure: SourceData FS1.
Figure 1.
Figure 1.
Genetic features of Ig heavy and light chains from the CD19+IgG+ B cells of patients with AIGAs. (A) IgG subclass, isotype, and V, (D), and J usage of Ig heavy and light chains from patient-derived mAbs. (B) Dot plots comparing the SHM (nucleotide mutations) of Ig heavy and light chain (VH, Vκ, and Vλ) genes in non–IFN-γ (n = 82) and IFN-γ–specific (n = 19) CD19+IgG+ B cells. Each dot corresponds to a B cell. The bar represents the median. Mann–Whitney U tests were performed for statistical analysis. *, P < 0.05. (C) The frequency of SHM in VH (n = 19), Vκ (n = 3), and Vλ (n = 16) genes, calculated from the number of replacement (R) and silent (S) nucleotide exchanges per base pair in framework regions (FWRs) and CDRs. Each dot corresponds to a B cell. The bar represents the median. Mann–Whitney U tests were performed for statistical analysis. *, P < 0.05; **, P < 0.01; ***, P < 0.005; ****, P < 0.001.
Figure 2.
Figure 2.
Binding features of monoclonal AIGAs. (A) Scatter chart of equilibrium KD values, corresponding to the binding affinity, derived from B. KD values were determined from the association (ka) and dissociation (kd) rates of the mAbs (KD = kd/ka). (B) Kinetic values for monoclonal AIGAs and AMG811, which conformed to a 1:1 Langmuir binding model. A χ2 value <3 indicates a good fit of the model to the experimental data. Binding curves are shown in Fig. S2 A. (C–F) Representative graphs showing the in-tandem cross-competition BLI assay for the mAbs and categorizing their binding groups. Biosensor tips were dipped in biotin–IFN-γ (2 μg/ml), then in primary antibody (5 μg/ml), and finally in competing antibody (5 μg/ml). An increase in wavelength (nm) is indicative of binding. The binding readout is depicted in Fig. S2 F. (G) Pie chart showing the three groups of AIGAs (site I, n = 1; II, n = 13; and III, n = 6).
Figure S2.
Figure S2.
Kinetic analysis and epitope recognition for monoclonal AIGAs to IFN-γ. (A) Sensorgrams for the binding of 19 monoclonal AIGAs, 9 UCA variants, and AMG811 to the indicated concentrations (nM) of recombinant IFN-γ, determined by BLI. Results for a blank (running buffer without IFN-γ) were subtracted from the results obtained to generate the processed association and dissociation curves. (B) Identification of monoclonal AIGAs binding to synthetic IFN-γ114–143 peptide. The ability of the selected mAbs (1 μg/ml) to bind to a synthetic peptide (100 μg/ml) was assessed by ELISA. The assays were performed twice, independently. The triplicate data are shown as the mean and SD for a single representative experiment. (C) Epitope mapping to assess binding to nonoverlapping human IFN-γ 30-mer synthetic peptides (100 μg/ml) from selected mAbs (1 μg/ml), by ELISA. The results shown were obtained in a single experiment. (D) Validation of IGHV3-21/IGLV6-57 paired mAb binding to IFN-γ through E5 and E7 in an in-tandem cross-competition BLI assay. (E) Protein mapping to assess the binding of selected mAbs (1 µg/ml) to recombinant His-tagged IFN-γ variants (1.5 μg/ml), by ELISA. An antibody against the His tag served as a loading control. The assays were performed twice, independently. The duplicate data are shown as the mean and SD for a single experiment. (F) Summary of in-tandem cross-competition assays for monoclonal AIGAs and AMG811. −, no binding signal detected; +, <0.5 wavelength shift (nm); ++, >0.5 wavelength shift (nm).
Figure 3.
Figure 3.
The contribution of SHM to the ability of antibodies to bind IFN-γ. (A) Bar graph showing ELISA results for reactivity with IFN-γ (2 μg/ml) for three selected highly mutated mAbs (2A6, 2B6, and 2F2; 1 μg/ml), before and after mutation. The control IgG (IgG ctrl.) is a mAb that does not react with IFN-γ. The results are presented as the mean and SD for three independent experiments. (B) The three selected mAbs (2A6, 2B6, and 2F2) were assessed in particle-based assays. The fluorescence signal indicates the ability of the antibody to bind IFN-γ. Two independent runs were performed. The triplicate data are presented as the mean and SD for a single representative experiment. (C) Binding affinity for different UCA variants of AIGAs. The mAbs conformed to a 1:1 Langmuir binding model. A χ2 value <3 indicates a good fit of the model to the experimental data. Binding curves are shown in Fig. S2 A. (D) Fold-changes of ka and kd values between UCA and mutated mAbs (Parental, UCA_VH and UCA_VL) are shown as dots. The results are shown as floating bars from minimum to maximum, with a line indicating the mean. Two-tailed paired Student’s t tests were performed for statistical analysis. *, P < 0.05.
Figure 4.
Figure 4.
Potential of monoclonal AIGAs to neutralize IFN-γ signaling. (A) In vitro neutralization by 19 monoclonal AIGAs and AMG811 in HeLa GAS reporter cells (2 × 10⁴ cells) treated with 4 ng/ml IFN-γ plus serial threefold dilutions of mAb, beginning at 1 μg/ml, for 20 h at 37°C. Luciferase activity was measured to estimate the percentage of neutralization. The assays were performed at least three times, independently. The results were pooled and are shown as the mean and SD (n = 3–6 per mAb). (B) Correlation between the binding affinity (KD, M) and neutralizing potential (log IC50, ng/ml) of the neutralizing mAbs. 2E10 was not included, because no log IC50 value was available for this mAb. A two-tailed Pearson’s correlation analysis was performed. (C) Assessment of the neutralizing potential of three selected mAbs (2A6, 2B6, and 2F2; serial threefold dilutions and beginning at 1 μg/ml) before and after mutation, in HeLa GAS reporter cells. The results are shown as the mean and SD for three independent experiments. (D) Analysis of competitive binding to sites on IFN-γ for three selected mAbs (2A6, 2B6, and 2F2; 5 μg/ml), before and after mutation, in an in-tandem cross-competition BLI assay. (E) Measurement of HLA-DR expression in THP-1 cells (1 × 10⁵ cells), incubated with and without IFN-γ (20 ng/ml), in the presence of the various mAbs (3 μg/ml), for 24 h at 37°C. Representative histogram (left), as in Fig. S3, and quantitative results (right) for HLA-DR–positive THP-1 cells. The binding sites (I, II, and III) on IFN-γ are indicated above the names of the mAbs. On the right, the results are expressed as the mean and SD for three independent experiments. P values are indicated for comparisons with IgG control (ctrl.) in two-tailed unpaired Student’s t tests. *, P < 0.05; **, P < 0.01; ***, P < 0.005; ****, P < 0.001. (F) Monoclonal AIGAs inhibit CXCL-10 production. Assessment of CXCL-10 production in a PBMC activation assay involving incubation with the selected monoclonal AIGAs (E1, 2B6, and 1E8; 1 μg/ml) and BCG + IL-12 (10 ng/ml) for 48 h at 37°C. NA, nonactivation. Dashed lines indicate the background signal. Each dot corresponds to a healthy donor of PBMCs. The data are presented as floating bars from minimum to maximum, with a line indicating the mean of four independent experiments.
Figure S3.
Figure S3.
In vitro neutralizing capacity of monoclonal AIGAs. Analysis of HLA-DR expression in THP-1 cells (1 × 10⁵ cells) in the presence or absence of IFN-γ (20 ng/ml) with the various mAbs (3 μg/ml) for 24 h at 37°C. The assays were performed three times, independently.
Figure 5.
Figure 5.
Epitope-orientated mechanism of the signal blockade by mAbs. (A and B) Evaluation, by ELISA, of the reactivity between 10 nM biotin–IFN-γ and immobilized 20 nM IFN-γR1 in the presence of mAbs (0, 5, 10, 20, and 100 nM, left to right). The assays were performed at least three times, independently. The results were pooled and are shown as the mean and SD (n = 3–7 per mAb). (A) Bar graph showing the signal for biotin–IFN-γ binding to IFN-γR1 following the addition of the biotin–IFN-γ–mAb mixture. (B) Bar graph showing the signal for the binding of the mAb to IFN-γR1 via biotin–IFN-γ. (C and D) IFN-γ–mediated binding of mAbs (40 nM) to THP-1 cells (1 × 10⁵ cells). The amount of antibody binding to the cell was determined by flow cytometry with anti-human IgG–PE antibodies. Representative histogram (C) and quantitative results (D) for the mean fluorescence intensity (MFI) of IgG–PE from THP-1 cells in the presence and absence of IFN-γ (20 nM). The binding sites (I, II, and III) on IFN-γ are indicated above the mAbs. The results are shown as the mean and SD for three independent experiments. (E) Labeling of IFN-γR1 (purple) and IFN-γR2 (green) in the plasma membrane (PM) of live cells with Rho-11– (red) and AT643-conjugated (blue) anti-GFP nanobodies, for the assessment of IFN-γR1/IFN-γR2 dimerization by single molecule cotracking (magenta circle). Heterodimerization (top) was detected as the orthogonal labeling of IFN-γR1 and IFN-γR2 with mXFPm/MIRho11 and mXFPe/ENAT643, respectively. IFN-γR2 homodimerization (bottom) was detected as the labeling of mXFPe-IFN-γR2 with a mixture of ENRho11 and ENAT643. EN, enhancer; MI, minimizer. (F) Quantification of the heterodimerization of IFN-γR1 and IFN-γR2 with anti-GFP nanobodies labeled with Rho11 and AT643. Relative cotracking of Rho11–IFN-γR1 and AT643–IFN-γR2 in the presence of IFN-γ (10 nM) and mAb (20 nM). The data presented are means ± SEM; IgG Ctrl. (n = 20), E1 (n = 18), 2B6 (n = 19), 2A102 (n = 16), 1E8 (n = 19), 2G7 (n = 19). Each data point corresponds to a cell. (G) Quantification of the homodimerization of IFN-γR2. The data presented are means ± SEM; IgG Ctrl. (n = 20), E1 (n = 19), 2B6 (n = 20), 2A102 (n = 18), 1E8 (n = 22), 2G7 (n = 19). Each data point represents a cell. The P values in panels F and G were calculated in two-tailed unpaired Student’s t tests. **, P < 0.01; ****, P < 0.001. The binding sites (I, II, and III) on IFN-γ are indicated above the mAbs. (H and I) Evaluation of the synergistic effect on neutralization of mAbs (serial threefold dilutions and beginning at 1 μg/ml in total) based on binding sites (I, II, and III) and neutralizing capacity in HeLa GAS reporter cells (2 × 10⁴ cells) within 4 ng/ml IFN-γ. In vitro neutralizing potential of groups of neutralizing mAbs (H) Site I, E1; site II, E5; site III, 1E8 (I); site I: E1; site II: 2B6; site III: 1E8 (J). In vitro neutralizing potential of groups of non-neutralizing mAbs. Site II: 2C10 and 1D5; site III: 2G7 and 2A101. 2A6 is a neutralizing mAb. (K) In vitro neutralizing potential of a group of neutralizing and non-neutralizing mAbs. Site I: E1 with neutralization; site II: 2C10, and site III: 2G7 without neutralization. (L and M) In vitro dose-dependent neutralizing potential of neutralizing mAbs (E1 or 2B6; serial threefold dilutions and beginning at 1 μg/ml) in the presence of a non-neutralizing mAb (2G7; serial threefold dilutions and beginning at 1, 3, or 9 μg/ml) with one, three, or ninefold dilutions. Control IgG, IgG ctrl. The results in H–M are shown as the mean and SD for three independent experiments. Two-tailed paired Student’s t tests were used to compare 1 μg/ml mAb treatments in H and K–M. ns, non-significant; *, P < 0.05; ***, P < 0.005.
Figure S4.
Figure S4.
Dimerization and cell surface receptor binding of IFN-γ in the presence of monoclonal AIGAs. (A) Rho11-labeled IFN-γ (red; 5 nM) and DY649-labeled IFN-γ (blue; 5 nM) were used to assess the binding to the cell surface receptor and potential dimerization induced by monoclonal AIGAs (20 nM). (B) Quantification of ligand homodimerization with Rho11- and DY649-conjugated IFN-γ. Relative tracking of IFN-γRho11 and IFN-γDY649 in the presence of monoclonal AIGAs, as determined by single-molecule cotracking. (C) Quantification of cell surface-bound IFN-γ density in the presence of monoclonal AIGAs by single-molecule localization analysis. The data shown are the mean ± SEM. IgG ctrl (n = 16), E1 (n = 16), 2B6 (n = 16), 2A102 (n = 16), 1E8 (n = 16), 2G7 (n = 17); each data point represents a cell. The binding sites (I, II, and III) on IFN-γ are indicated above the monoclonal AIGAs. The P values in B and C were calculated in unpaired two-tailed Student’s t tests. **, P < 0.01; ***, P < 0.001; ****, P < 0.0001.
Figure 6.
Figure 6.
Immunocomplex formation by the monoclonal AIGAs. (A) SEC profiles of samples (40 μl) containing a single antibody (3 μΜ) with or without IFN-γ (3 μΜ). Blue traces, mAb alone; red lines, samples with both mAb and IFN-γ; AU, absorbance unit. The assays were performed twice independently. (B) The dose dependence of immunocomplex formation was investigated with 1:0, 1:0.5, 1:1, and 1:2 ratios of site II mAb (2B6 and 2C10; 3 μM) to IFN-γ (0, 1.5, 3 or 6 μM) in SEC-UHPLC analysis. The assays were performed twice independently. (C) In vitro Fab-based neutralization in HeLa GAS reporter cells. Monovalent Fab fragments were generated by digesting the IgGs with the Pierce Fab micropreparation kit, according to the manufacturer’s instructions. HeLa GAS reporter cells (2 × 10⁴ cells) were stimulated with 118 pM (4 ng/ml) IFN-γ in the presence of serial threefold dilutions of Fab, beginning at 120 nM. The full-length antibody was used as a control, under serial threefold dilutions, beginning at 6.7 nM. The results are shown as the mean and SD for two independent experiments. The binding sites (I, II, and III) on IFN-γ are indicated next to the mAbs and Fabs.
Figure 7.
Figure 7.
Monoclonal AIGAs selectively facilitate cellular cytotoxicity. (A) Fc receptor activation indicated by the bar graph showing luciferase activity in 5 × 10⁵ Jurkat FcγRIIIa–NFAT-RE reporter cells cocultured with 1 × 10⁵ THP-1 cells in the presence of IFN-γ (0, 5, and 10 nM) and mAb (10 nM) for 6 h at 37°C. The results are shown as the mean and SD for three independent experiments. (B) Fc receptor activation status for the selected LALA variants of the mAbs (10 nM) and IFN-γ (0 and 10 nM) in 5 × 10⁵ Jurkat FcγRIIIa–NFAT-RE reporter cells cocultured with 1 × 10⁵ THP-1 cells for 6 h at 37°C. The dot points are from two independent experiments, and the bar graph is shown as mean. (C) Cytotoxicity was determined with 5 × 10⁴ NK cells as effector cells (E) and 5 × 10³ monocytes as target cells (T; E:T = 10:1), incubated with 10 nM IFN-γ and 10 nM mAb for 8 h at 37°C. Each dot corresponds to a healthy donor of primary cells. The assays were performed at least three times independently and the results were pooled (n = 3–6 per mAb). P values were calculated in two-tailed paired Student’s t tests. *, P < 0.05. The binding sites (I, II, and III) on IFN-γ are indicated above the mAbs. (D and E) Cellular cytotoxicity of AMG811 determined with 1 × 10⁵ NK cells as effector cells (E) and 5 × 10³ monocytes as target cells (T; E:T = 20:1), incubated with 10 nM IFN-γ and 10 nM mAb for 8 h at 37°C. Each dot corresponds to a healthy donor of primary cells, in three independent experiments. IgG control, IgG ctrl. (E) Plasma (2%) from individuals with (n = 20) or without (n = 10) AIGAs was assayed for cytotoxicity mediated via IFN-γ (E:T = 20:1) for 8 h at 37°C. Each dot corresponds to a healthy donor of primary cells. Pooled data from four independent experiments are shown. ctrl, control; Hc, healthy control; Pt, patient with AIGAs. 1E8 mAb was used as a positive control. (F) Identification of AIGAs from selected donors (n = 20) for cytotoxicity assays by ELISA. Dot plot showing the ability of antibodies to bind to IFN-γ (2 μg/ml) in serial dilutions of plasma (500× and 2,500×). Black dots, five donor plasma samples displaying ADCC in the cytotoxicity assay. (G) ELISA quantification of IL-12p40 production by PBMCs for the NA, BCG, and BCG + IFN-γ (25 ng/ml) treatments in the presence of 1 μg/ml mAb for 48 h at 37°C. The binding sites (II and III) on IFN-γ are indicated next to the monoclonal AIGAs. Each dot corresponds to a healthy donor of PBMCs. The data are shown as floating bars from minimum to maximum, with a line indicating the median of four independent experiments. (H) ELISA quantification of CXCL-10 production by PBMCs for the NA and BCG + IFN-γ (25 ng/ml) treatments, in the presence of 1 μg/ml mAb for 48 h at 37°C. The assays were performed at least three times, independently. Each dot corresponds to a healthy donor of PBMCs. The results were pooled and are shown as floating bars from minimum to maximum, with a line indicating the median (n = 3–4 per mAb). In G and H, two-tailed paired Student’s t tests were used for statistical analysis. *, P < 0.05; **, P < 0.01.
Figure S5.
Figure S5.
Summary information for the 19 monoclonal AIGAs and AMG811. (A and B) Patient distribution and binding characteristics (epitope group, ELISA, Western blot, binding affinity, immunocomplex) and functional impacts (HeLa GAS reporter, HLA-DR expression, IFN-γR1–R2 and IFN-γR2–R2 dimerization, Fc receptor activation, cellular cytotoxicity) of the 20 mAbs indicated in table (A) and heatmap (B). +++, ++, +, − indicate ability, strength, or potency; 1, 2, 3 indicate patient category; X, an absence of measurement in assays. (C) Bar graph for the distribution of the 19 monoclonal AIGAs on the basis of patients and binding sites.

Similar articles

Cited by

References

    1. Aoki, A., Sakagami T., Yoshizawa K., Shima K., Toyama M., Tanabe Y., Moro H., Aoki N., Watanabe S., Koya T., et al. . 2018. Clinical significance of interferon-γ neutralizing autoantibodies against disseminated nontuberculous mycobacterial disease. Clin. Infect. Dis. 66:1239–1245. 10.1093/cid/cix996 - DOI - PubMed
    1. Bach, E.A., Szabo S.J., Dighe A.S., Ashkenazi A., Aguet M., Murphy K.M., and Schreiber R.D.. 1995. Ligand-induced autoregulation of IFN-γ receptor β chain expression in T helper cell subsets. Science. 270:1215–1218. 10.1126/science.270.5239.1215 - DOI - PubMed
    1. Bastard, P., Orlova E., Sozaeva L., Levy R., James A., Schmitt M.M., Ochoa S., Kareva M., Rodina Y., Gervais A., et al. . 2021. Preexisting autoantibodies to type I IFNs underlie critical COVID-19 pneumonia in patients with APS-1. J. Exp. Med. 218:e20210554. 10.1084/jem.20210554 - DOI - PMC - PubMed
    1. Bastard, P., Rosen L.B., Zhang Q., Michailidis E., Hoffmann H.H., Zhang Y., Dorgham K., Philippot Q., Rosain J., Beziat V., et al. . 2020. Autoantibodies against type I IFNs in patients with life-threatening COVID-19. Science. 370:eabd4585. 10.1126/science.abd4585 - DOI - PMC - PubMed
    1. Boedigheimer, M.J., Martin D.A., Amoura Z., Sanchez-Guerrero J., Romero-Diaz J., Kivitz A., Aranow C., Chan T.M., Chong Y.B., Chiu K., et al. . 2017. Safety, pharmacokinetics and pharmacodynamics of AMG 811, an anti-interferon-γ monoclonal antibody, in SLE subjects without or with lupus nephritis. Lupus Sci. Med. 4:e000226. 10.1136/lupus-2017-000226 - DOI - PMC - PubMed

Publication types