. 2022 Sep;13(9):1599-1619.
doi: 10.1007/s13300-022-01294-0. Epub 2022 Jul 14.

Impact of Partial Meal Replacement on Glycemic Levels and Body Weight in Indian Patients with Type 2 Diabetes (PRIDE): A Randomized Controlled Study

Affiliations

Impact of Partial Meal Replacement on Glycemic Levels and Body Weight in Indian Patients with Type 2 Diabetes (PRIDE): A Randomized Controlled Study

Mala Dharmalingam et al. Diabetes Ther. 2022 Sep.

Abstract

Introduction: Partial meal replacement (PMR) offers potential glycemic and weight control benefits in type 2 diabetes mellitus (T2DM) patients. We evaluated the clinical impact of PMR (diabetes-specific nutritional supplement [DSNS]) in overweight/obese Indian patients with T2DM.

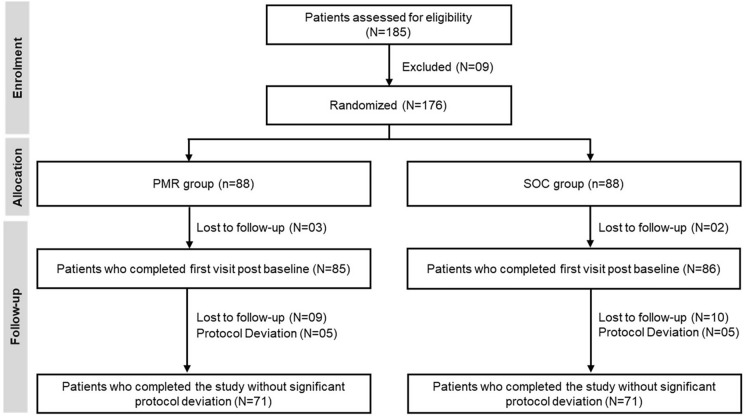
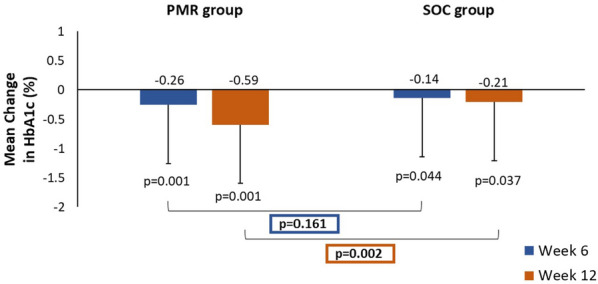
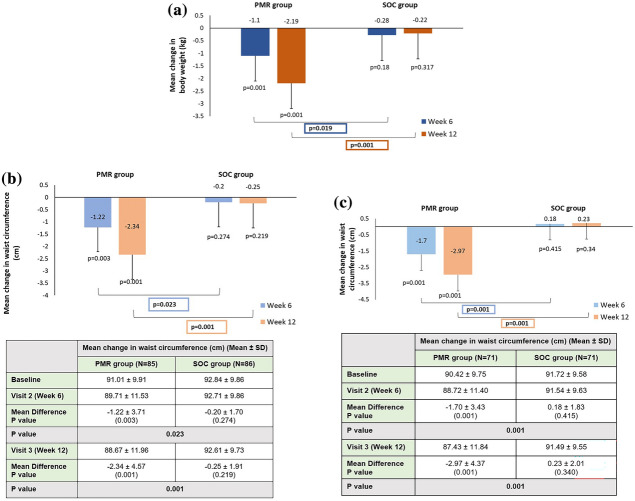
Methods: PRIDE, a 12-week, phase IV, open-label, multicenter study randomized (1:1) newly diagnosed T2DM patients (≤ 1 year) to either DSNS plus standard of care (SOC; diabetes treatment with dietary counseling) group (PMR) or SOC alone group (SOC). The primary endpoint was mean change in glycated hemoglobin (HbA1c) from baseline to week 12. Secondary endpoints were changes in glucose profiles, body weight, waist circumference, lipid profile, and factors impacting quality-of-life (QoL) at week 6 and 12 from baseline. Safety was assessed throughout the study.

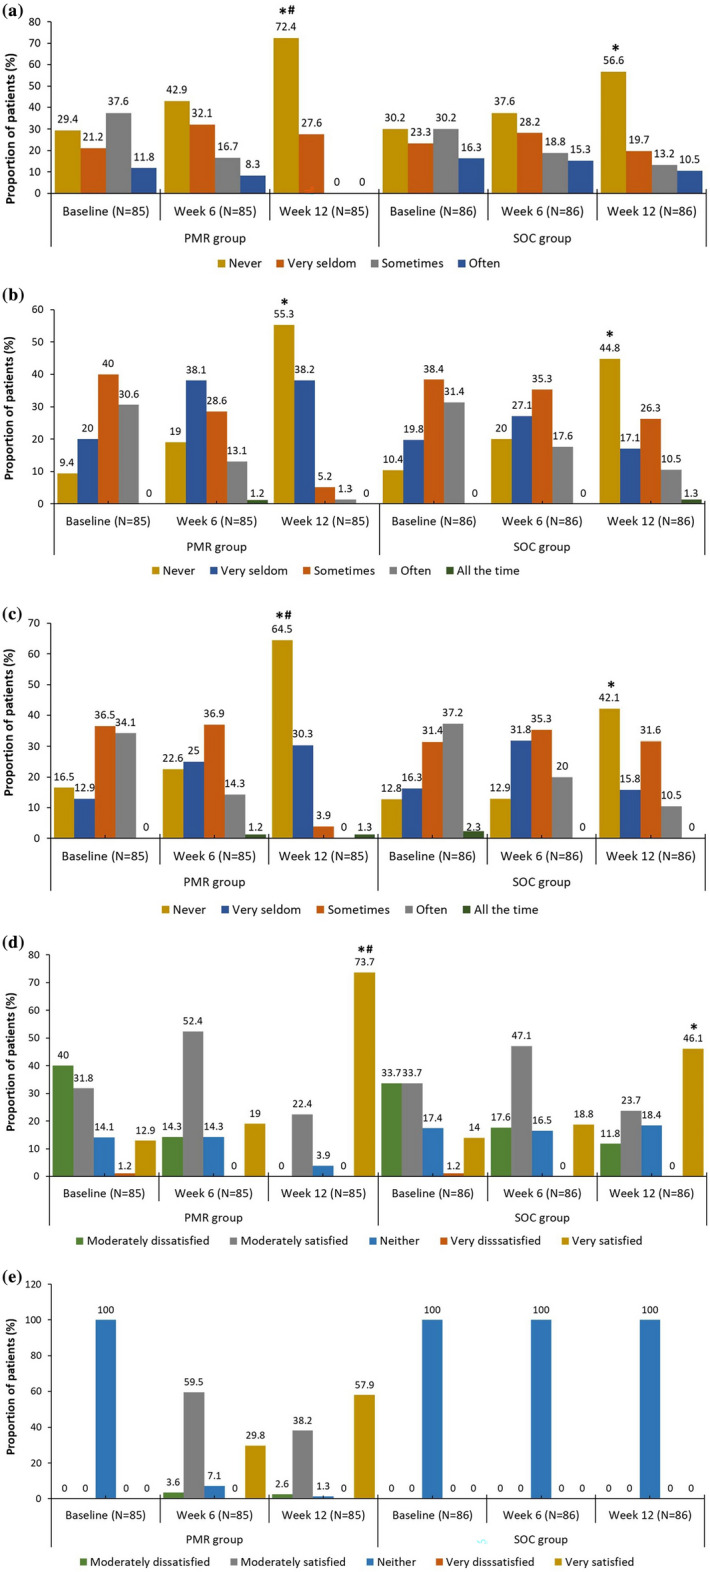
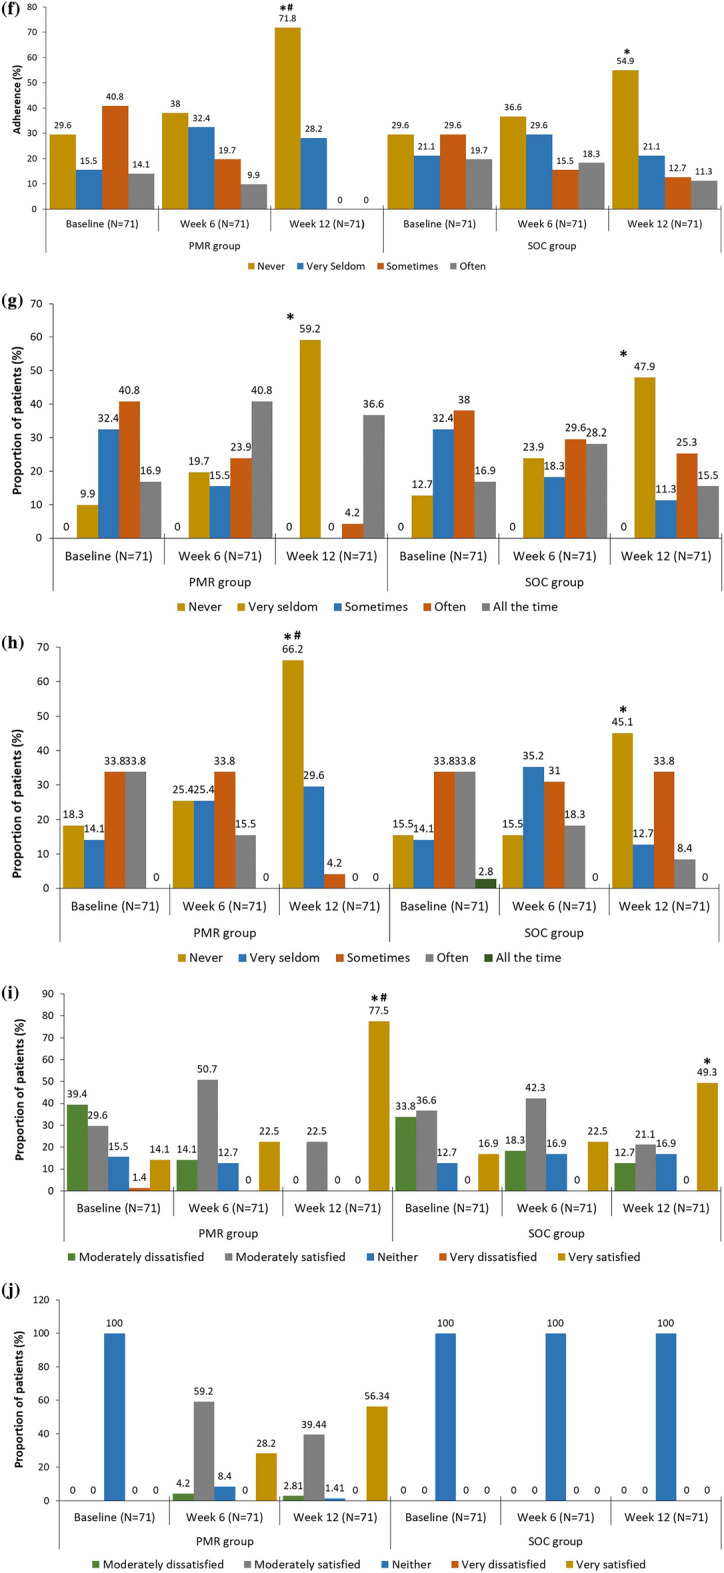
Results: Of the 176 patients enrolled, 171 (n = 85 in PMR group; n = 86 in SOC group) were included in the modified intent-to-treat population. The mean reduction in HbA1c at week 12 from baseline in PMR group was significant compared to the SOC group (- 0.59 vs. - 0.21%, p = 0.002). At week 12, the PMR group showed significant reduction in mean body weight (- 2.19 vs. - 0.22 kg; p = 0.001) and waist circumference (- 2.34 vs. - 0.48 cm; p = 0.001) compared to SOC group. Mean fasting plasma glucose and post-prandial glucose significantly reduced from baseline at week 6 and 12 in each group (p < 0.05). No significant change was observed in lipid profile. QoL parameters (treatment adherence, general well-being, and energy fulfilment) in the PMR were significantly better than SOC group (p < 0.05). Patients were satisfied with the taste of DSNS. No serious adverse events were reported.

Conclusions: DSNS is an encouraging option for PMR strategy, as it significantly improved HbA1c, body weight, waist circumference, and overall well-being among overweight/obese Indian T2DM patients.

Trial identification no: CTRI/2019/10/021595.

Keywords: Body weight; Diabetes-specific nutritional supplement; Glycemic control; India; Partial meal replacement; Quality of life; Type 2 diabetes mellitus.


Figures

Fig. 1
Fig. 1
Patient disposition flowchart. N total number of patients, n number of patients included in the specific category, PMR partial meal replacement, SOC standard of care
Fig. 2
Fig. 2
Mean change in HbA1C (%) from baseline to week 6 and week 12 (mITT population). All values are presented as mean ± SD. p value: calculated using Student’s t test. HbA1c glycated hemoglobin, mITT modified intention-to-treat, PMR partial meal replacement, SD standard deviation, SOC standard of care. The mITT population consisted of all enrolled patients who completed at least one post-baseline visit
Fig. 3
Fig. 3
a Mean change in body weight (kg) from baseline to week 6 and week 12 (mITT population). All values are presented as mean ± SD. p value: calculated using Student’s t test. BW bodyweight, mITT modified intention-to-treat, N total number of patients with results for the specified timepoint, PMR partial meal replacement, SD standard deviation, SOC standard of care. The mITT population consisted of all enrolled patients who completed at least one post-baseline visit. b Mean change in waist circumference (cm) from baseline to week 6 and week 12 (mITT population). All values are presented as mean ± SD. p value: calculated using Student’s t test. mITT modified intention-to-treat, N total number of patients with results for the specified timepoint, PMR partial meal replacement, SD standard deviation, SOC standard of care, WC waist circumference. The PP population consisted of all enrolled patients who had completed the study as per the protocol without major protocol deviation. c Mean change in waist circumference (cm) from baseline to week 6 and week 12 (PP population). All values are presented as mean ± SD. p value: calculated using Student’s t test. N total number of patients with results for the specified timepoint, PMR partial meal replacement, PP per-protocol, SD standard deviation, SOC standard of care, WC waist circumference. The PP population consisted of all enrolled patients who had completed the study as per the protocol without major protocol deviation
Fig. 4
Fig. 4
a Factors impacting QoL assessment on how often patients miss their diabetes treatment (mITT population). p value: calculated using chi-square test. *Significant difference within group from baseline to week 12 (p < 0.05); #significant difference in PMR group compared to SOC group at week 12 (p < 0.05). mITT modified-intention-to-treat, N total number of patients, PMR partial meal replacement, QoL quality of life, SOC standard of care. The mITT population consisted of all enrolled patients who completed at least one post-baseline visit. b Factors impacting QoL assessment on how often patients feel hungry (mITT population). p value: calculated using chi-square test. *Significant difference within group from baseline to week 12 (p < 0.05). mITT modified-intention-to-treat, N total number of patients, PMR partial meal replacement, QoL quality of life, SOC standard of care. The mITT population consisted of all enrolled patients who completed at least one post-baseline visit. c Factors impacting QoL assessment on how often patients feel lethargic (mITT population). p value: calculated using chi-square test. *Significant difference within group from baseline to week 12 (p < 0.05); #significant difference in PMR group compared to SOC group at week 12 (p < 0.05). mITT modified-intention-to-treat, N total number of patients, PMR partial meal replacement, QoL quality of life, SOC standard of care. The mITT population consisted of all enrolled patients who completed at least one post-baseline visit. d Factors impacting QoL assessment on patient satisfaction with their general well-being (mITT population). p value: calculated using chi-square test. *Significant difference within group from baseline to week 12 (p < 0.05); #significant difference in PMR group compared to SOC group at week 12 (p < 0.05). mITT modified-intention-to-treat, N total number of patients, PMR partial meal replacement, QoL quality of life, SOC standard of care. The mITT population consisted of all enrolled patients who completed at least one post-baseline visit. e Factors impacting QoL assessment on patient satisfaction with the taste of Prohance-D® (mITT population). mITT modified-intention-to-treat, N total number of patients, PMR partial meal replacement, QoL quality of life, SOC standard of care. The mITT population consisted of all enrolled patients who completed at least one post-baseline visit. f Factors impacting QoL assessment on how often patients miss their diabetes treatment (PP population). p value: calculated using chi-square test. *Significant difference within group from baseline to week 12 (p < 0.05); #significant difference in PMR group compared to SOC group at week 12 (p < 0.05). N total number of patients, PMR partial meal replacement, PP per-protocol, QoL quality of life, SOC standard of care. The PP population consisted of all enrolled patients who had completed the study as per the protocol without major protocol deviation. g Factors impacting QoL assessment on how often patients feel hungry (PP population). p value: calculated using chi-square test. *Significant difference within group from baseline to week 12 (p < 0.05). N total number of patients, PMR partial meal replacement, PP per-protocol, QoL quality of life, SOC standard of care. The PP population consisted of all enrolled patients who had completed the study as per the protocol without major protocol deviation. h Factors impacting QoL assessment on how often patients feel lethargic (PP population). p value: calculated using chi-square test. *Significant difference within group from baseline to week 12 (p < 0.05); #significant difference in PMR group compared to SOC group at week 12 (p < 0.05). N total number of patients, PMR partial meal replacement, PP per-protocol, QoL quality of life, SOC standard of care. The PP population consisted of all enrolled patients who had completed the study as per the protocol without major protocol deviation. i Factors impacting QoL assessment on patient satisfaction with their general well-being (PP population). p value: calculated using chi-square test. *Significant difference within group from baseline to week 12 (p < 0.05); #significant difference in PMR group compared to SOC group at week 12 (p < 0.05). N total number of patients, PMR partial meal replacement, PP per-protocol, QoL quality of life, SOC standard of care. The PP population consisted of all enrolled patients who had completed the study as per the protocol without major protocol deviation. j Factors impacting QoL assessment on patient satisfaction with the taste of Prohance-D® (PP population). N total number of patients, PMR partial meal replacement, PP per-protocol, QoL quality of life, SOC standard of care. The PP population consisted of all enrolled patients who had completed the study as per the protocol without major protocol deviation
Fig. 4
Fig. 4
a Factors impacting QoL assessment on how often patients miss their diabetes treatment (mITT population). p value: calculated using chi-square test. *Significant difference within group from baseline to week 12 (p < 0.05); #significant difference in PMR group compared to SOC group at week 12 (p < 0.05). mITT modified-intention-to-treat, N total number of patients, PMR partial meal replacement, QoL quality of life, SOC standard of care. The mITT population consisted of all enrolled patients who completed at least one post-baseline visit. b Factors impacting QoL assessment on how often patients feel hungry (mITT population). p value: calculated using chi-square test. *Significant difference within group from baseline to week 12 (p < 0.05). mITT modified-intention-to-treat, N total number of patients, PMR partial meal replacement, QoL quality of life, SOC standard of care. The mITT population consisted of all enrolled patients who completed at least one post-baseline visit. c Factors impacting QoL assessment on how often patients feel lethargic (mITT population). p value: calculated using chi-square test. *Significant difference within group from baseline to week 12 (p < 0.05); #significant difference in PMR group compared to SOC group at week 12 (p < 0.05). mITT modified-intention-to-treat, N total number of patients, PMR partial meal replacement, QoL quality of life, SOC standard of care. The mITT population consisted of all enrolled patients who completed at least one post-baseline visit. d Factors impacting QoL assessment on patient satisfaction with their general well-being (mITT population). p value: calculated using chi-square test. *Significant difference within group from baseline to week 12 (p < 0.05); #significant difference in PMR group compared to SOC group at week 12 (p < 0.05). mITT modified-intention-to-treat, N total number of patients, PMR partial meal replacement, QoL quality of life, SOC standard of care. The mITT population consisted of all enrolled patients who completed at least one post-baseline visit. e Factors impacting QoL assessment on patient satisfaction with the taste of Prohance-D® (mITT population). mITT modified-intention-to-treat, N total number of patients, PMR partial meal replacement, QoL quality of life, SOC standard of care. The mITT population consisted of all enrolled patients who completed at least one post-baseline visit. f Factors impacting QoL assessment on how often patients miss their diabetes treatment (PP population). p value: calculated using chi-square test. *Significant difference within group from baseline to week 12 (p < 0.05); #significant difference in PMR group compared to SOC group at week 12 (p < 0.05). N total number of patients, PMR partial meal replacement, PP per-protocol, QoL quality of life, SOC standard of care. The PP population consisted of all enrolled patients who had completed the study as per the protocol without major protocol deviation. g Factors impacting QoL assessment on how often patients feel hungry (PP population). p value: calculated using chi-square test. *Significant difference within group from baseline to week 12 (p < 0.05). N total number of patients, PMR partial meal replacement, PP per-protocol, QoL quality of life, SOC standard of care. The PP population consisted of all enrolled patients who had completed the study as per the protocol without major protocol deviation. h Factors impacting QoL assessment on how often patients feel lethargic (PP population). p value: calculated using chi-square test. *Significant difference within group from baseline to week 12 (p < 0.05); #significant difference in PMR group compared to SOC group at week 12 (p < 0.05). N total number of patients, PMR partial meal replacement, PP per-protocol, QoL quality of life, SOC standard of care. The PP population consisted of all enrolled patients who had completed the study as per the protocol without major protocol deviation. i Factors impacting QoL assessment on patient satisfaction with their general well-being (PP population). p value: calculated using chi-square test. *Significant difference within group from baseline to week 12 (p < 0.05); #significant difference in PMR group compared to SOC group at week 12 (p < 0.05). N total number of patients, PMR partial meal replacement, PP per-protocol, QoL quality of life, SOC standard of care. The PP population consisted of all enrolled patients who had completed the study as per the protocol without major protocol deviation. j Factors impacting QoL assessment on patient satisfaction with the taste of Prohance-D® (PP population). N total number of patients, PMR partial meal replacement, PP per-protocol, QoL quality of life, SOC standard of care. The PP population consisted of all enrolled patients who had completed the study as per the protocol without major protocol deviation

Similar articles

Cited by

References

    1. Williams R, Karuranga S, Malanda B, et al. Global and regional estimates and projections of diabetes-related health expenditure: results from the International Diabetes Federation Diabetes Atlas, 9th edition. Diabetes Res Clin Pract. 2020;162:108072 - PubMed
    1. Pradeepa R, Mohan V. Prevalence of type 2 diabetes and its complications in India and economic costs to the nation. Eur J Clin Nutr. 2017;71(7):816–824. doi: 10.1038/ejcn.2017.40. - DOI - PubMed
    1. Winocour PH. Effective diabetes care: a need for realistic targets. BMJ. 2002;324(7353):1577–1580. doi: 10.1136/bmj.324.7353.1577. - DOI - PMC - PubMed
    1. Stratton IM, Adler AI, Neil HA, et al. Association of glycaemia with macrovascular and microvascular complications of type 2 diabetes (UKPDS 35): prospective observational study. BMJ. 2000;321(7258):405–412. doi: 10.1136/bmj.321.7258.405. - DOI - PMC - PubMed
    1. Zhang Y, Hu G, Yuan Z, Chen L. Glycosylated hemoglobin in relationship to cardiovascular outcomes and death in patients with type 2 diabetes: a systematic review and meta-analysis. PLoS ONE. 2012;7(8):e42551. doi: 10.1371/journal.pone.0042551. - DOI - PMC - PubMed

LinkOut - more resources