. 2022 Aug 1;105(6):6-11.

SARS-CoV-2 Variants in Rhode Island; May 2022 Update

Affiliations

SARS-CoV-2 Variants in Rhode Island; May 2022 Update

Manjot Singh et al. R I Med J (2013). .

Abstract

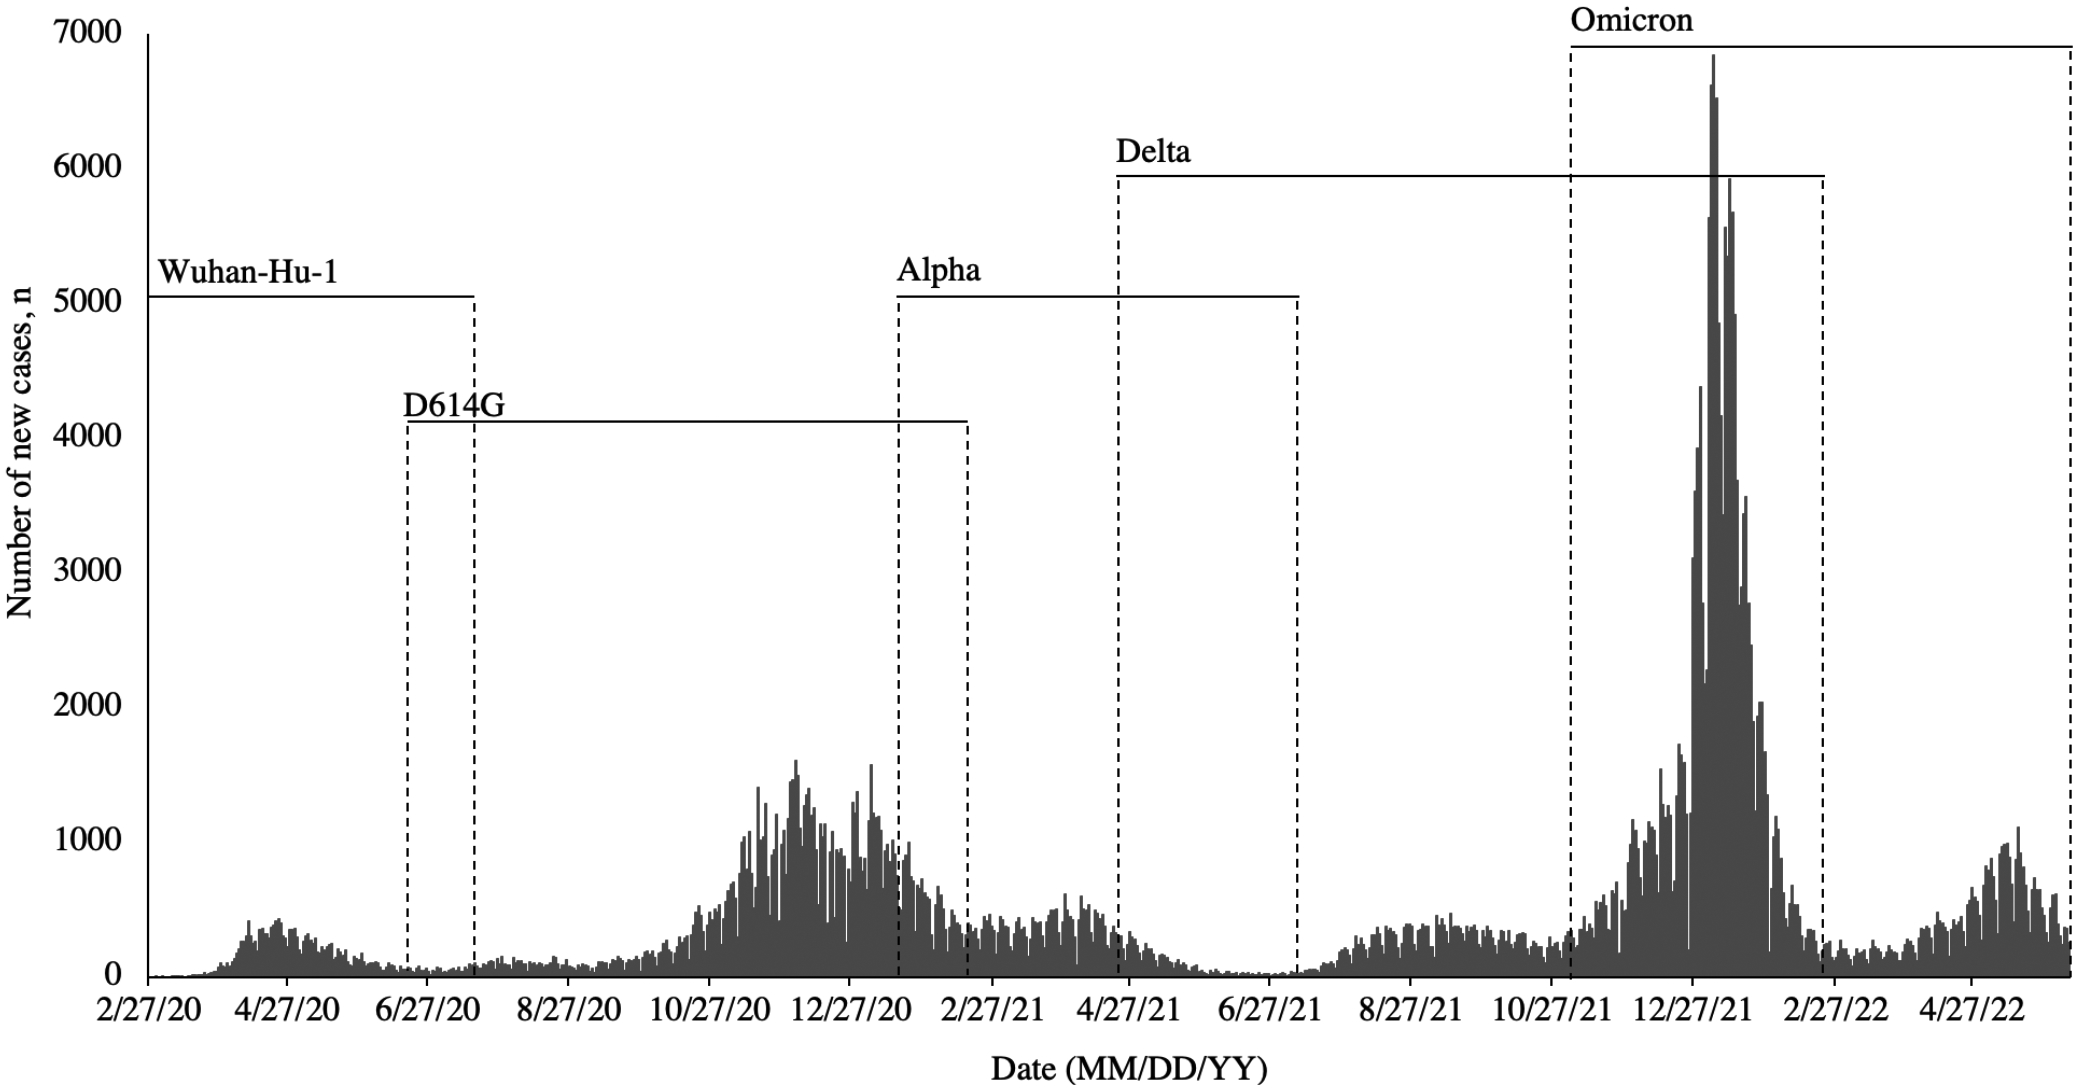
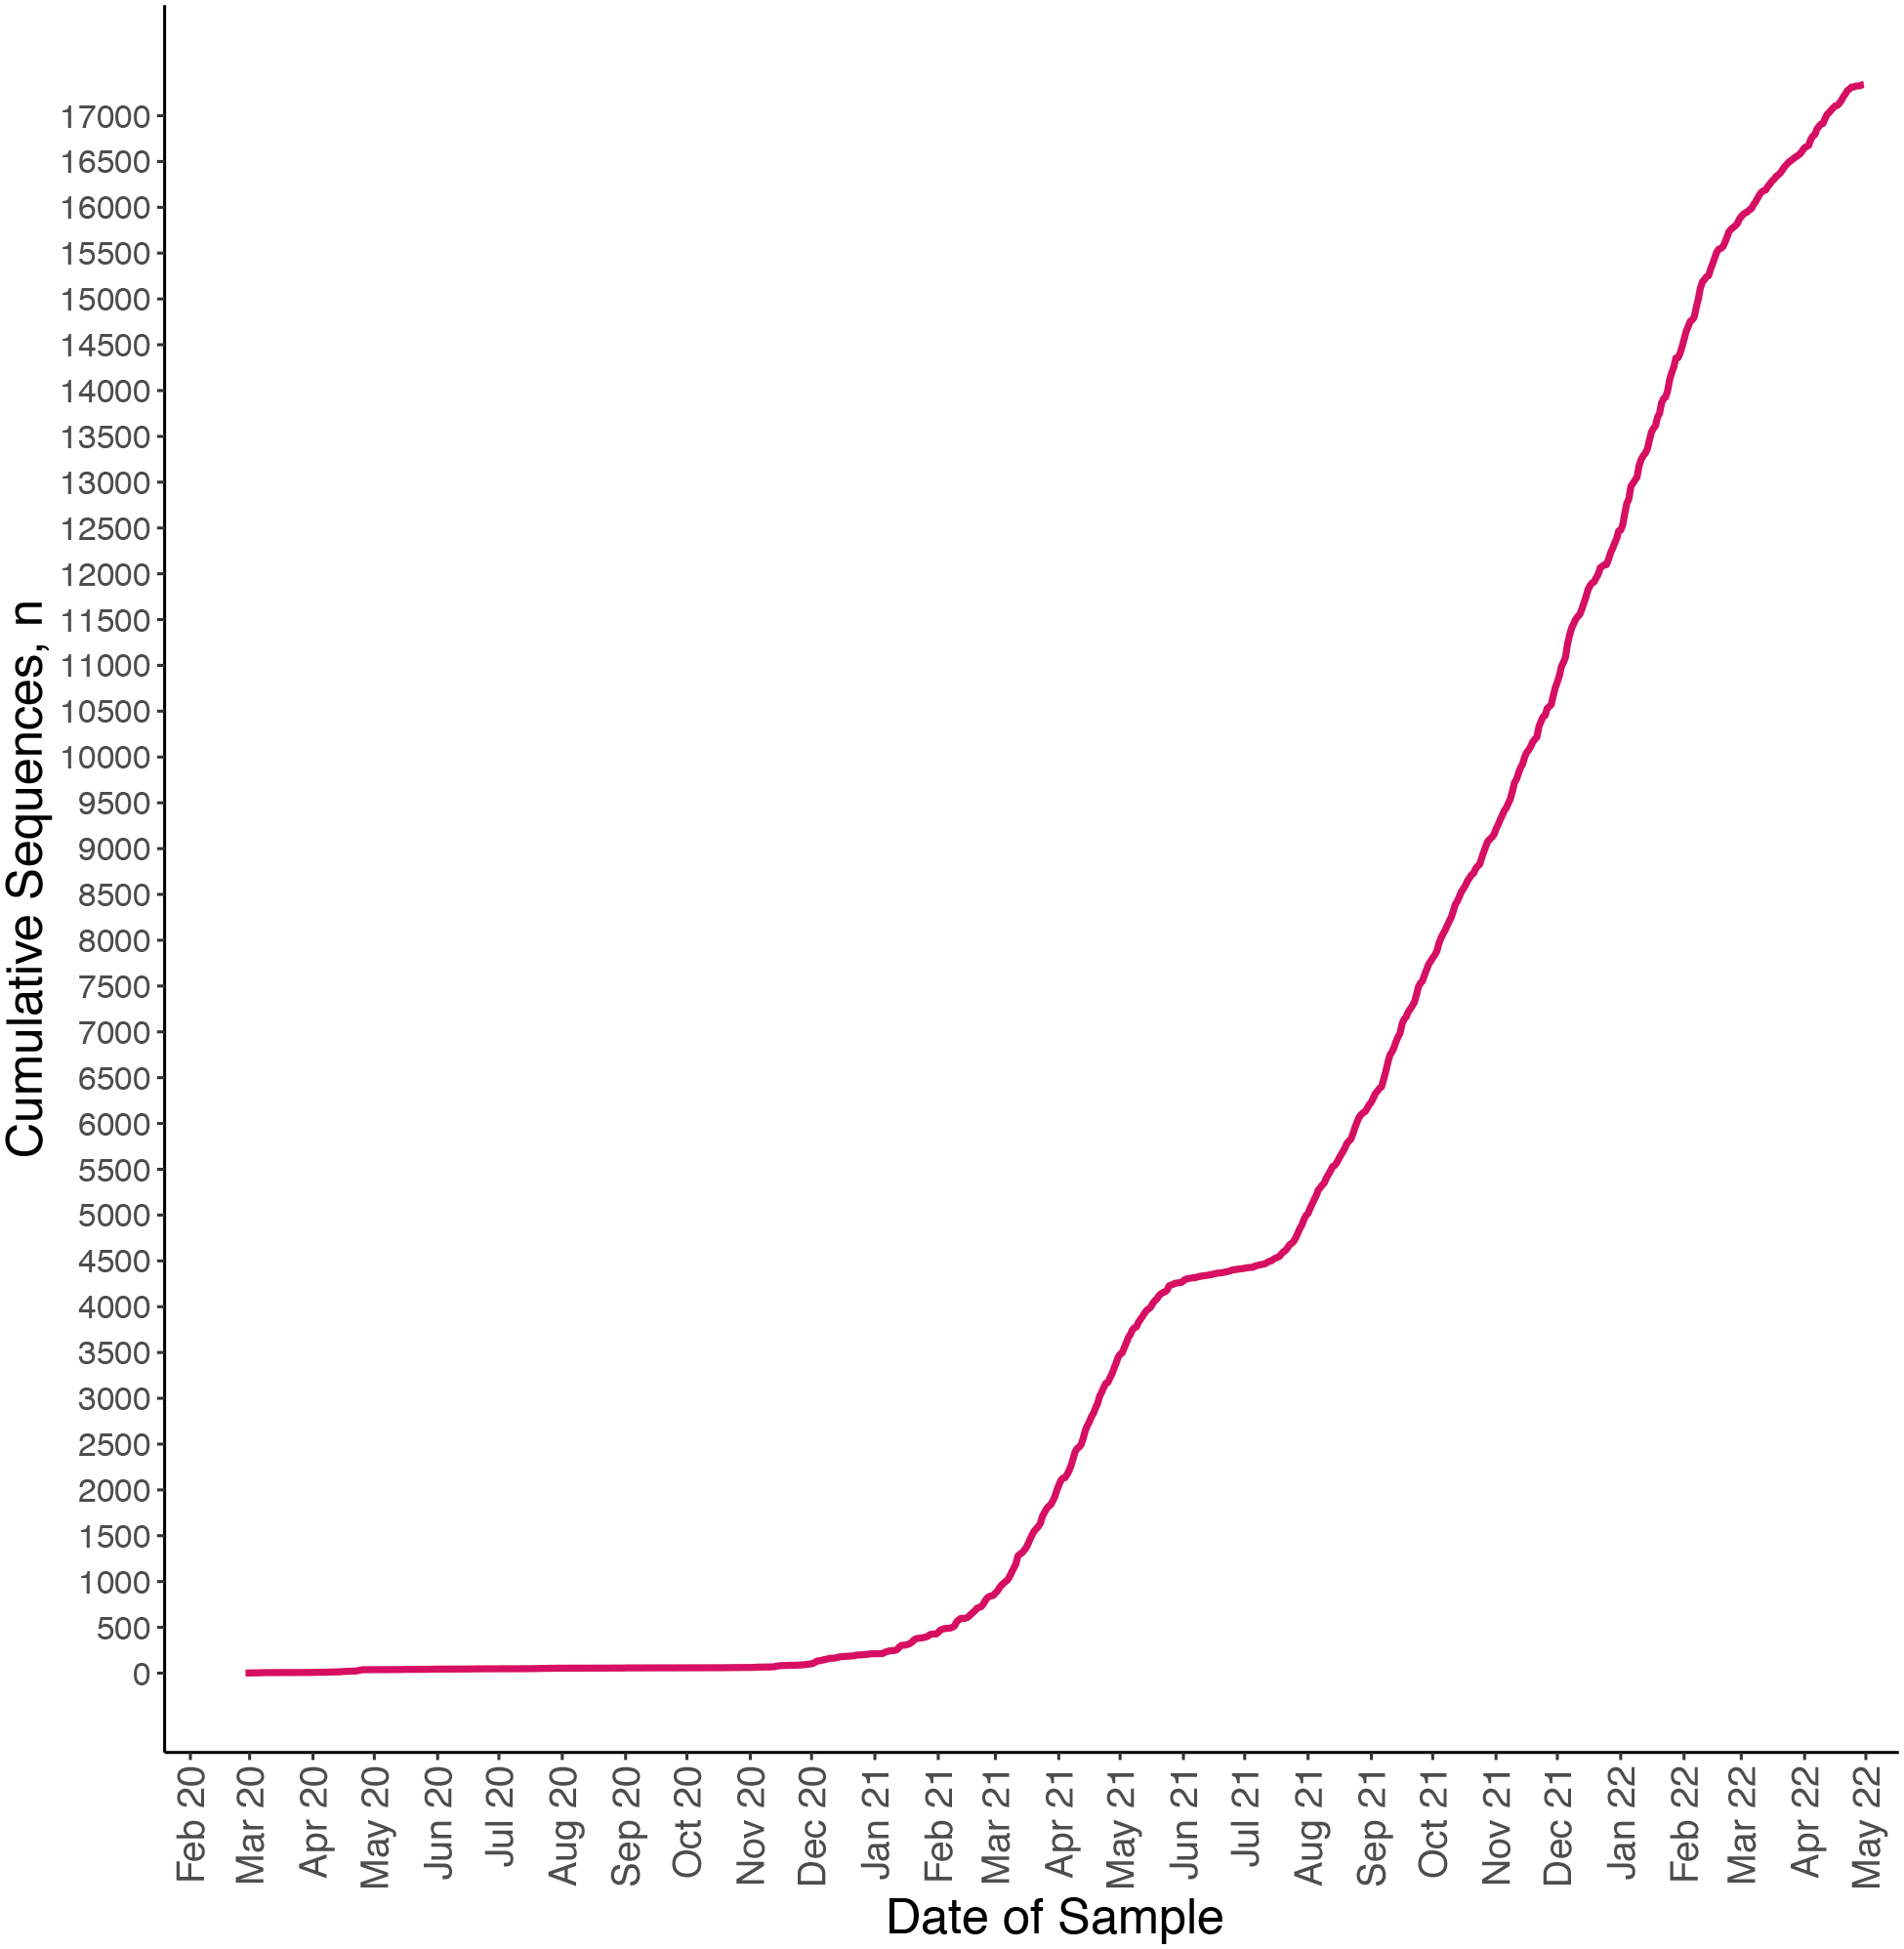
Background: Genomic surveillance allows identification of circulating SARS-CoV-2 variants. We provide an update on the evolution of SARS-CoV-2 in Rhode Island (RI).

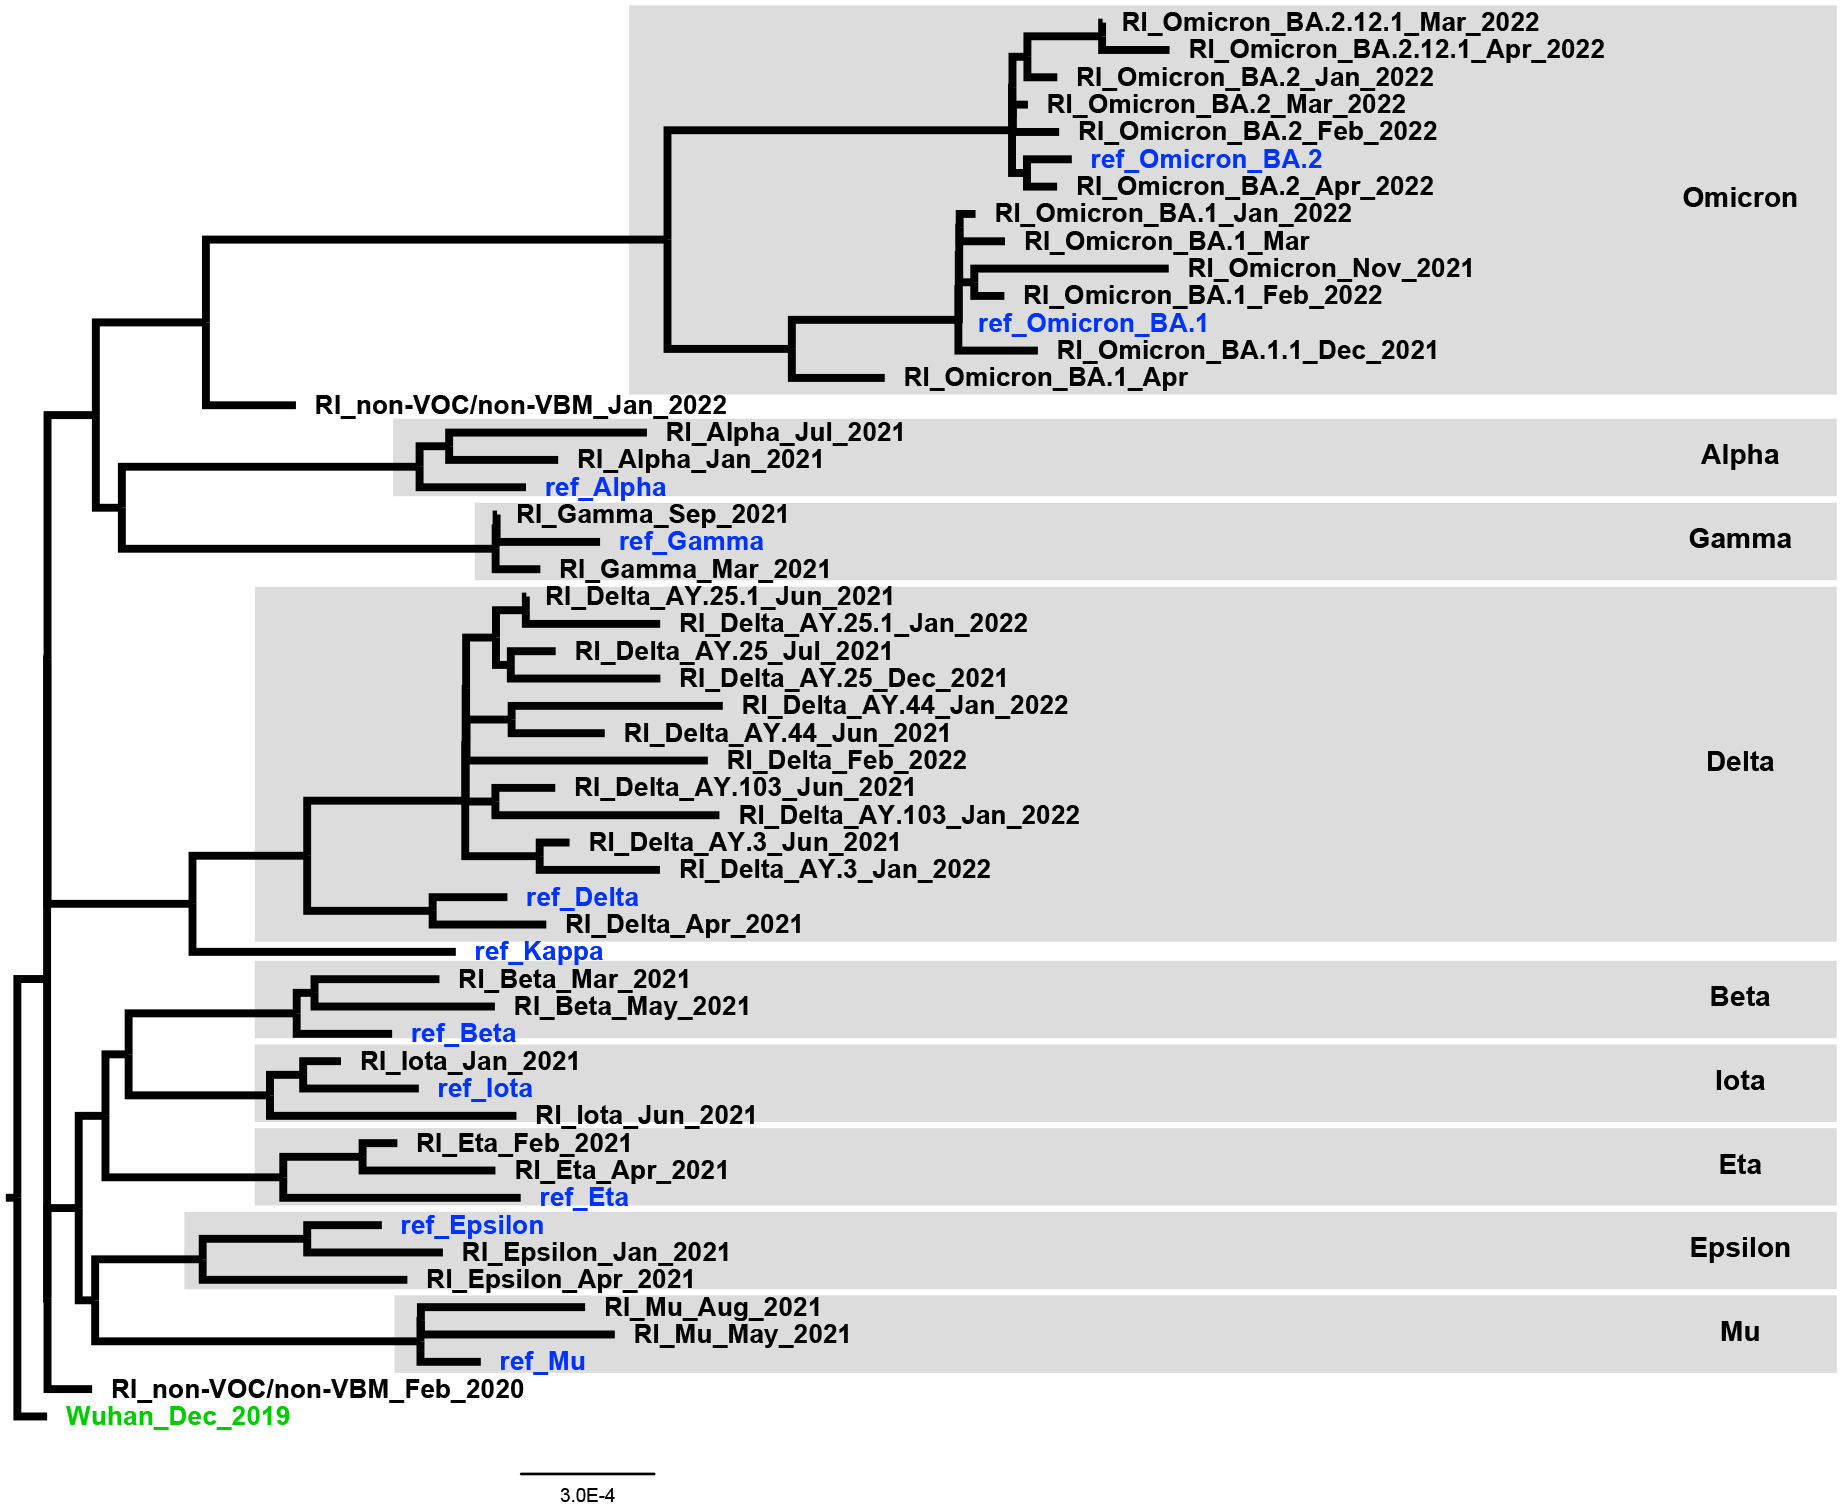
Methods: All publicly available SARS-CoV-2 RI sequences were retrieved from https://www.gisaid.org. Genomic analyses were conducted to identify variants of concern (VOC), variants being monitored (VBM), or non-VOC/non-VBM, and investigate their evolution.

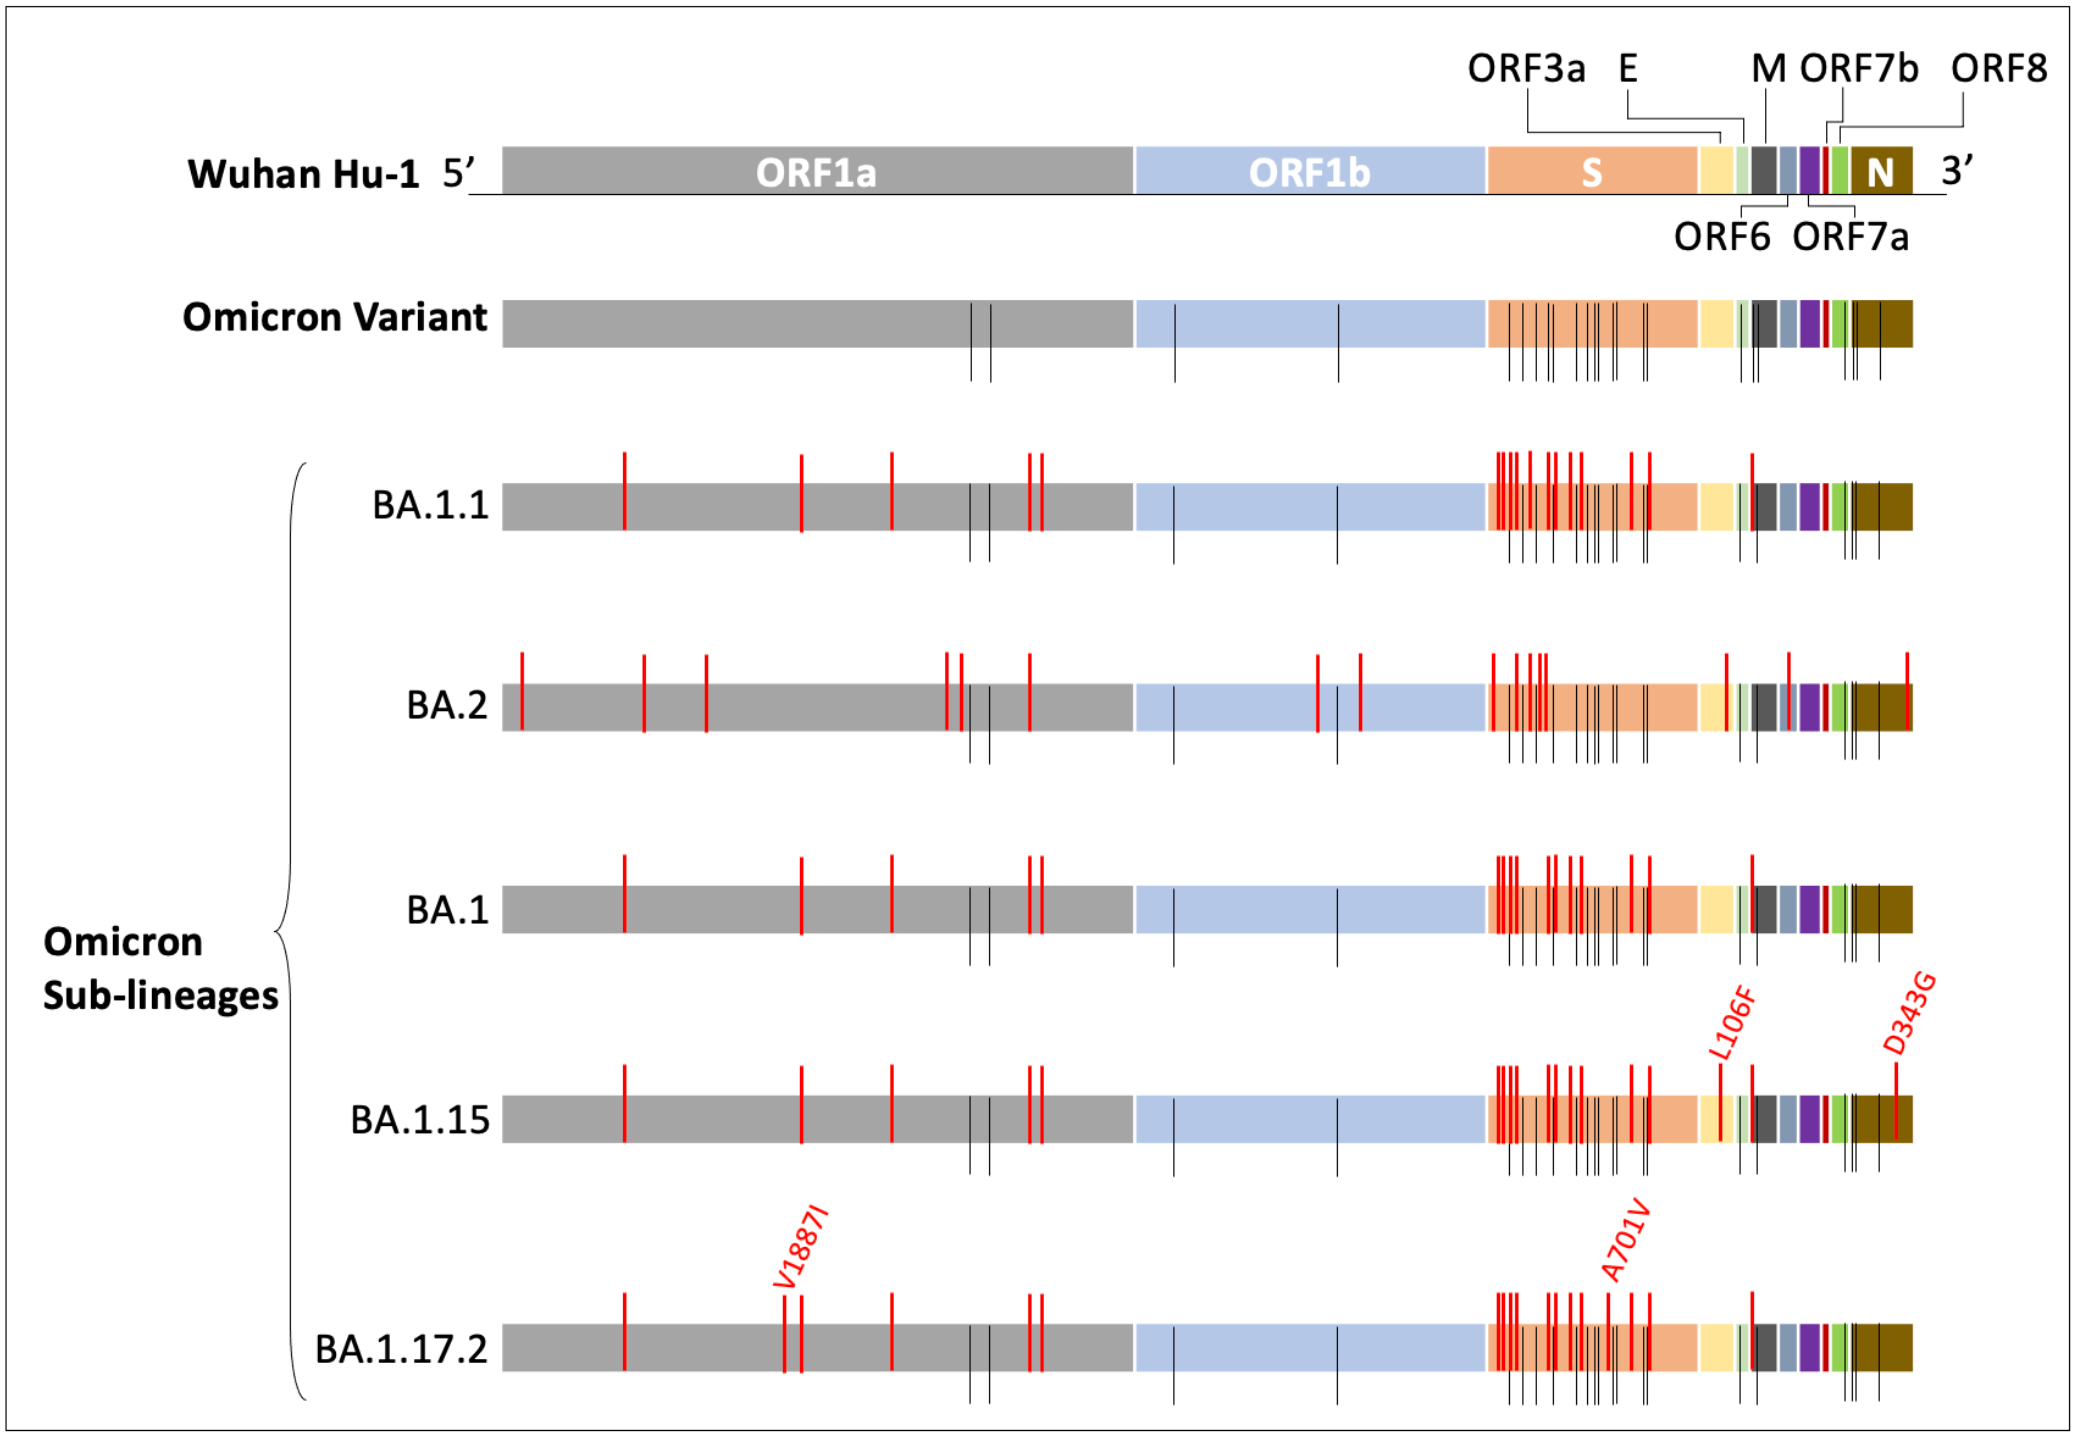
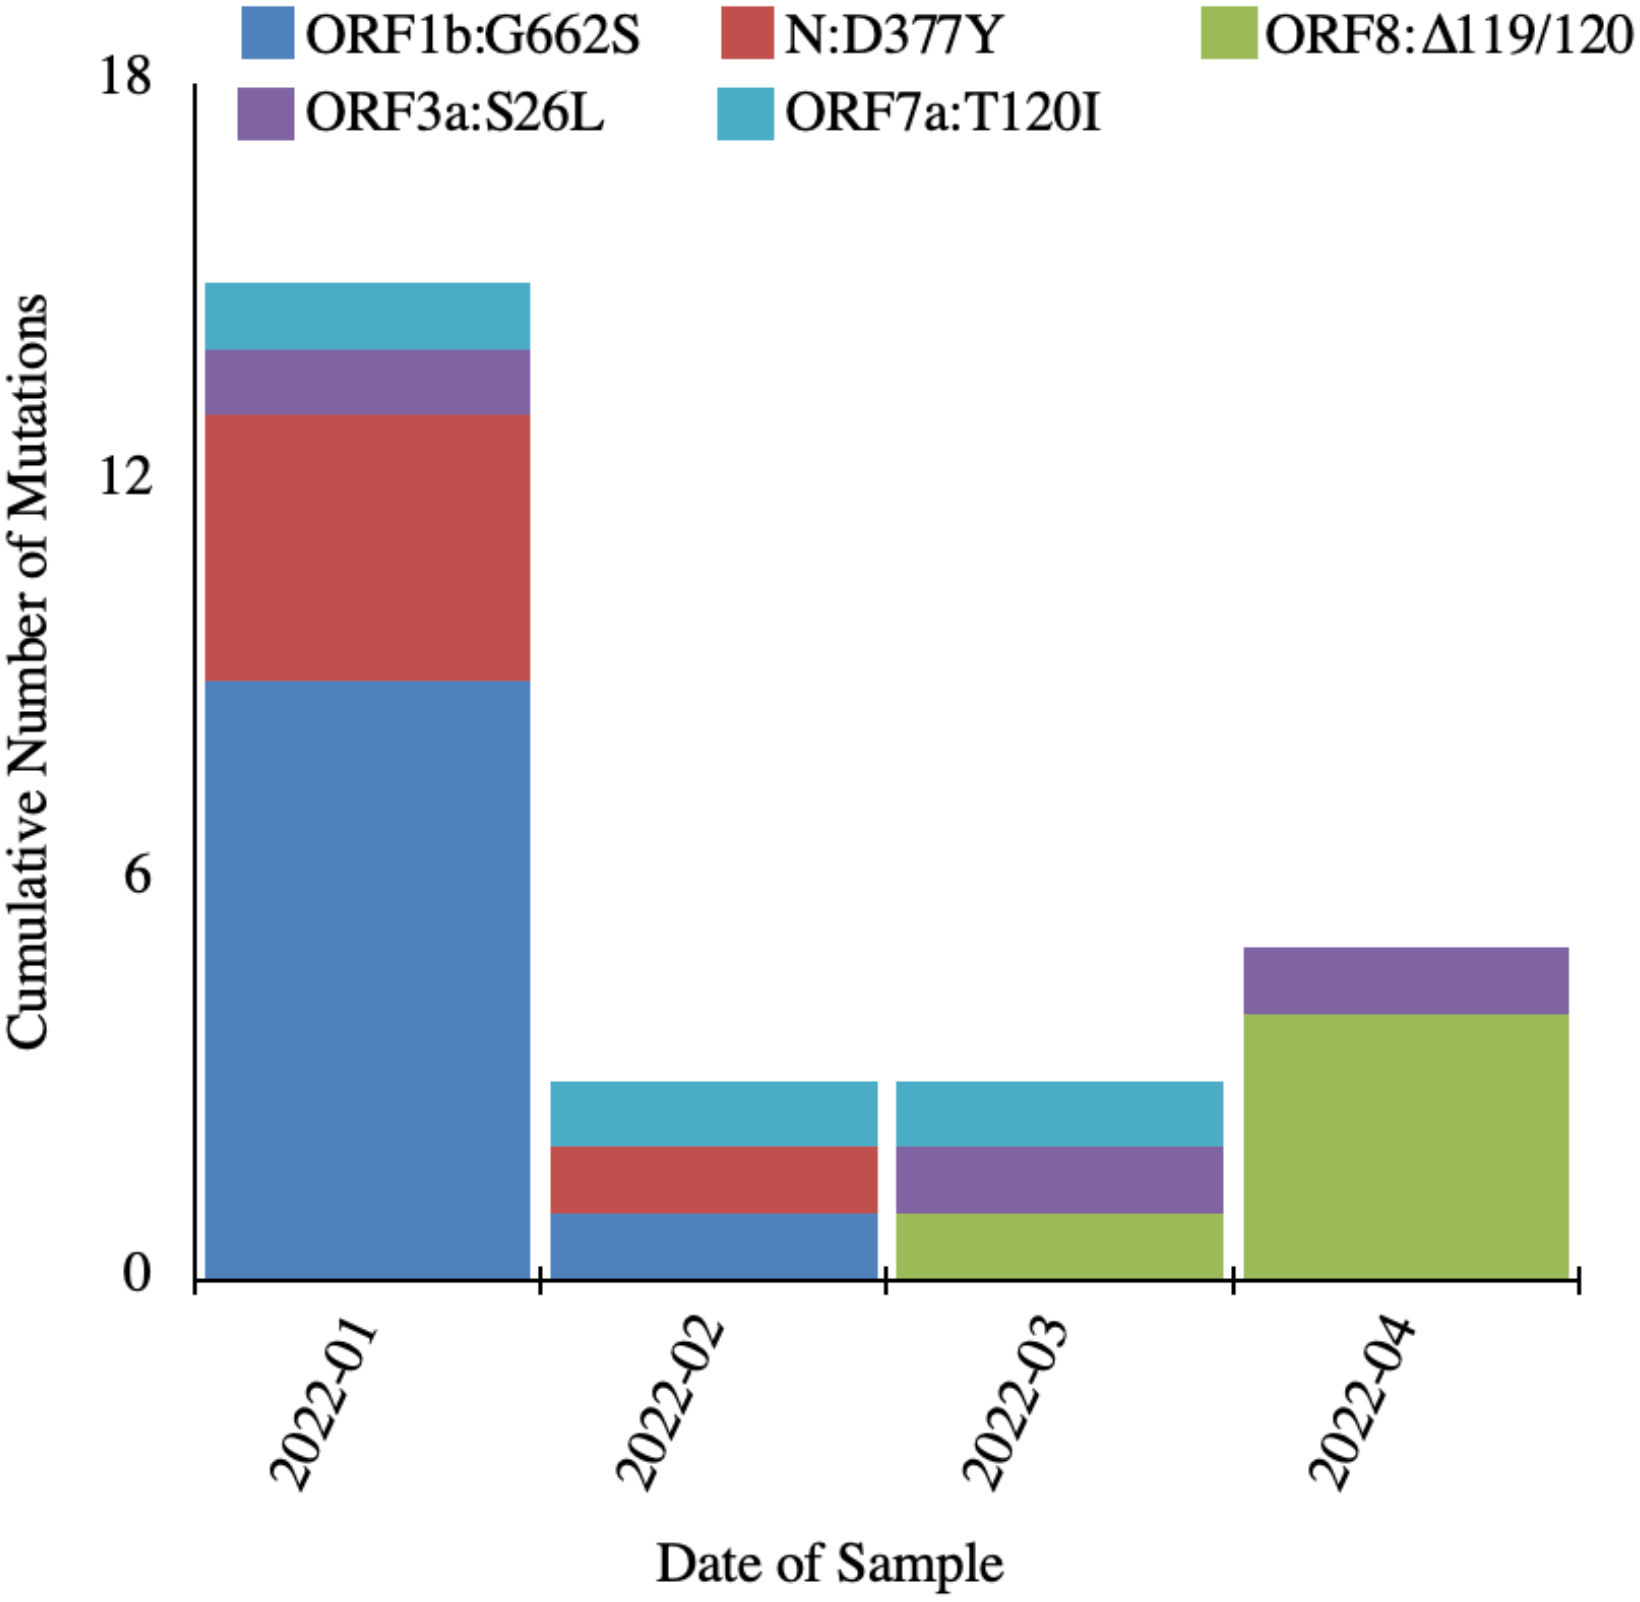
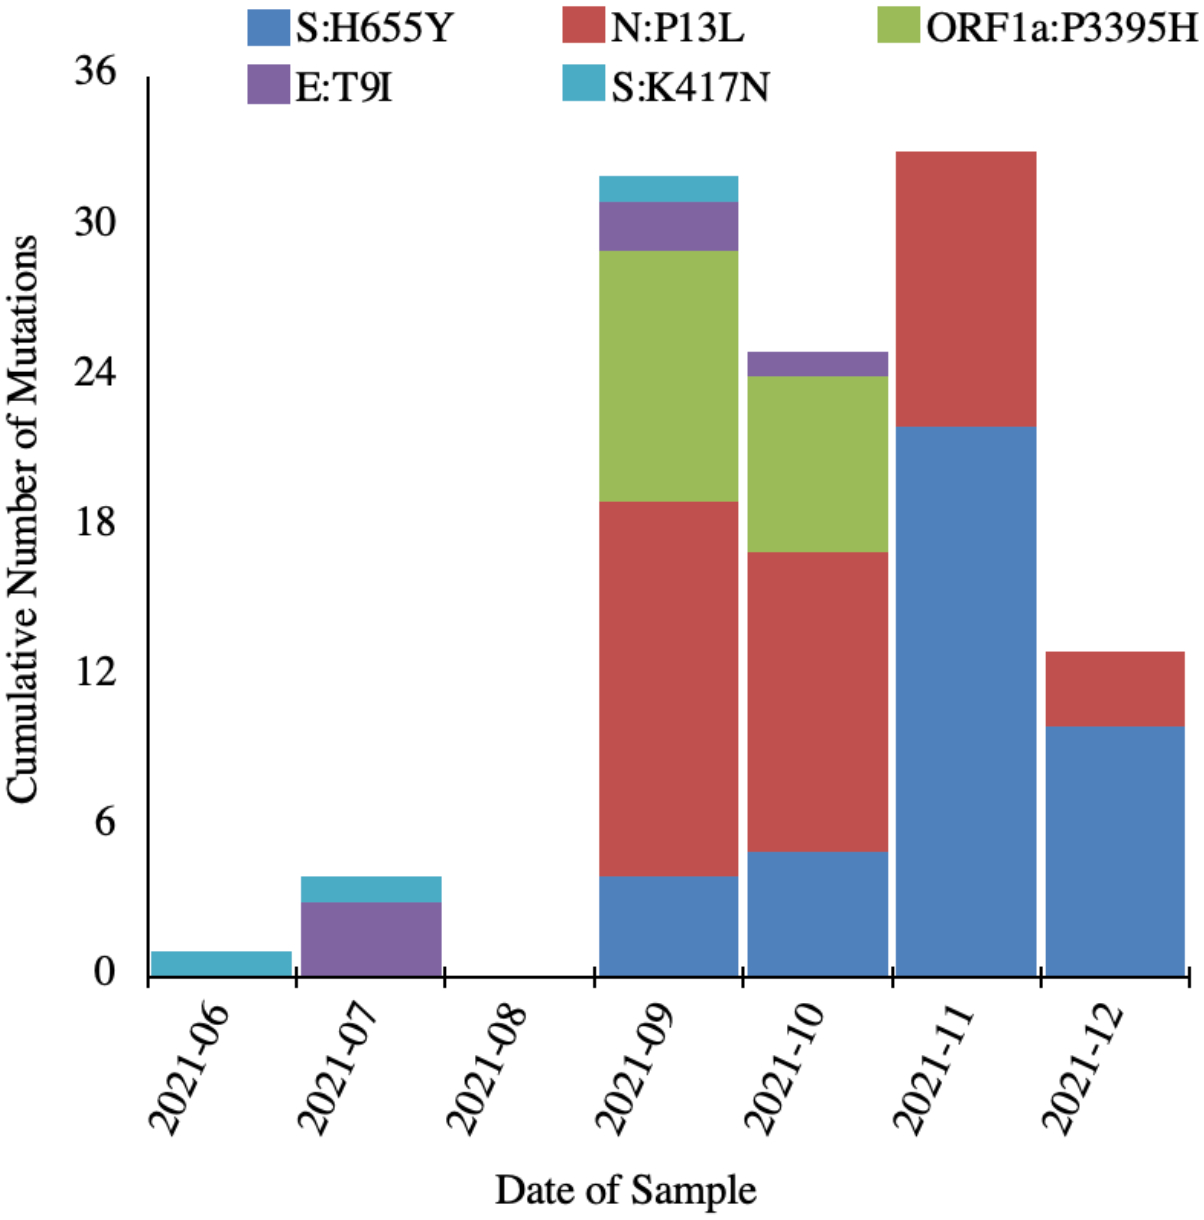
Results: Overall, 17,340 SARS-CoV-2 RI sequences were available between 2/2020-5/2022 across five (globally recognized) major waves, including 1,462 (8%) sequences from 36 non-VOC/non-VBM until 5/2021; 10,565 (61%) sequences from 8 VBM between 5/2021-12/2021, most commonly Delta; and 5,313 (31%) sequences from the VOC Omicron from 12/2021 onwards. Genomic analyses demonstrated 71 Delta and 44 Omicron sub-lineages, with occurrence of variant-defining mutations in other variants.

Conclusion: Statewide SARS-CoV-2 genomic surveillance allows for continued characterization of circulating variants and monitoring of viral evolution, which inform the local health force and guide public health on mitigation efforts against COVID-19.

Keywords: COVID-19; Rhode Island; SARS-CoV-2; genomic sequencin; variants.


Figures

Figure 1A.
Figure 1A.. SARS-CoV-2 waves and cases in RI.
Burden of SARS-CoV-2 in RI. Bar graph highlighting the number of new cases of SARS-CoV-2 (Y axis) in RI over time (X axis), since the beginning of the pandemic. Horizontal solid lines and vertical dash lines indicate the time periods of the five major waves of COVID-19, including overlaps, and black text above the horizontal lines shows the predominant variant responsible for each wave. Source for the numbers of new cases: RI Department of Health SARS-CoV-2 Variant Information (https://ri-department-of-health-covid-19-data-rihealth.hub.arcgis.com/).
Figure 1B.
Figure 1B.. Cumulative number of available SARS-CoV-2 sequences collected from infected individuals in RI.
Burden of SARS-CoV-2 in RI. Line graph highlighting the cumulative number of SARS-CoV-2 sequences in RI (Y axis) according to the dates on which the samples were collected (X axis).
Figure 2.
Figure 2.. Phylogenetic tree of the spectrum of available RI SARS-CoV-2 sequences since the beginning of COVID-19 pandemic
The phylogenetic tree shows the RI non-VOC/non-VBM, VOC, and VBM sequences (in black), reference sequences for the VOC/VBM (in blue), and the Wuhan-Hu-1 sequence (in green; used as a root). See Methods for further details on sequence selection. Rhode Island sequences start with ‘RI’ followed by WHO-defined variant name, Pango-defined variant sub-lineage name when applicable, and month/year of sampling. VOC and VBM clusters are highlighted in gray, with the VOC/VBM they belong to indicated to the right. The tree scale is shown at the bottom of the tree.
Figure 3A.
Figure 3A.. ARS-CoV-2 sequences in RI categorized by VOC, VBM, or non-VOC/non-VBMS
Stacked bar graphs demonstrating the proportions and diversity of SARS-CoV-2 variants in RI. Stacked bar graph demonstrating the proportion of RI SARS-CoV-2 sequences (Y axis), presented as non-VOC/non-VBM (gray), VBM (yellow), and VOC (red), according to the month and year they were detected (X axis).
Figure 3B.
Figure 3B.. Non-VOC/non-VBM SARS-CoV-2 lineages in RI.
Stacked bar graphs demonstrating the proportions and diversity of SARS-CoV-2 variants in RI. Stacked bar graph demonstrating the breakdown of the frequency of RI non-VOC/non-VBM lineages presented in Figure 3A. Lineages are distinguished by color, as shown in the figure legend.
Figure 3C.
Figure 3C.. Proportions of VOC, VBM, and non-VOC/non-VBM over time in RI.
Stacked bar graphs demonstrating the proportions and diversity of SARS-CoV-2 variants in RI. Stacked bar graph demonstrating the breakdown of the proportions of RI VOC and VBM that were presented in Figure 3A. VOC and VBM lineage proportions are distinguished by color, as shown in the figure legend. Non-VOC/non-VBM proportions are gray. Sequences numbers are provided at the top of the bars.
Figure 3D.
Figure 3D.. SARS-CoV-2 Delta sub-lineages in RI.
Stacked bar graphs demonstrating the proportions and diversity of SARS-CoV-2 variants in RI. Stacked bar graph demonstrating the breakdown of the frequency of RI VBM Delta that was presented in Figure 3C. The AY sub-lineages are distinguished by color, as shown in the figure legend.
Figure 3E.
Figure 3E.. SARS-CoV-2 Omicron lineages in RI.
Stacked bar graphs demonstrating the proportions and diversity of SARS-CoV-2 variants in RI. Stacked bar graph demonstrating the breakdown of the frequency of RI VOC Omicron that was presented in Figure 3C. The BA sub-lineages are distinguished by color, as shown in the figure legend.
Figure 4A.
Figure 4A.. Mutations seen in the dominant Delta sub-lineages in RI.
Genomic comparison of the parent Delta and Omicron lineages against their respective sub-lineages and the Wuhan-Hu-1 strain. This schematic figure demonstrates genomic differences between the Delta core sequence and its sub-lineages detected in RI (lines 2–7), and the Wuhan-Hu-1 strain (top line). Black vertical lines in each sequence indicate point amino acid mutations that differentiate the core Delta sequence (B.1.617.2; second sequence in the figure) as well as its five most commonly observed sub-lineages in RI (lines 3–7), from Wuhan-Hu-1. Red vertical lines indicate amino acid mutations that further differentiate the AY sub-lineages from the core Delta sequence. Red text further indicates the point amino acid mutations that are unique to only that specific AY sub-lineage in RI.
Figure 4B.
Figure 4B.. Mutations seen in the dominant Omicron sub-lineages in RI.
Genomic comparison of the parent Delta and Omicron lineages against their respective sub-lineages and the Wuhan-Hu-1 strain. This schematic figure demonstrates genomic differences between the Omicron core sequences and its sub-lineages detected in RI (lines 2–7), and the Wuhan-Hu-1 strain (top line). Black vertical lines in each sequence indicate point amino acid mutations/deletions that differentiate the core Omicron sequence, as well as its five most commonly observed sub-lineages in RI (lines 3–7), from Wuhan-Hu-1. Red vertical lines indicate amino acid mutations that further differentiate the BA sub-lineages from the core Omicron sequence. Red text further indicates the point amino acid mutations or deletions that are unique to only that specific BA sub-lineage in RI.
Figure 5A.
Figure 5A.. Most common mutations unique to Delta, occurring in Omicron sequences over time in RI.
Stacked bar graphs demonstrating the cumulative number of SARS-CoV-2 amino acid mutations that are associated with a VBM or VOC, but that occur outside of their associated VBM or VOC lineage. Stacked bar graph demonstrating the cumulative number (Y axis) of the five most common amino acid mutations/deletions that have been associated with the Delta variant but that were observed in RI sequences designated as Omicron, over time (X axis). The mutations are distinguished by color, as shown in the figure legend. N, Nucleocapsid; ORF, open reading frame.
Figure 5B.
Figure 5B.. Most common mutations unique to Omicron, occurring in Delta sequences over time in RI.
Stacked bar graphs demonstrating the cumulative number of SARS-CoV-2 amino acid mutations that are associated with a VBM or VOC, but that occur outside of their associated VBM or VOC lineage. Stacked bar graph demonstrating the cumulative number (Y axis) of the five most common amino acid mutations that have been associated with the Omicron variant but that were observed in RI sequences designated as Delta, over time (X axis). The mutations are distinguished by color, as shown in the figure legend. E, envelope; N, nucleocapsid; ORF, open reading frame; S, Spike.

References

    1. COVID-19 Dashboard. Johns Hopkins Coronavirus Resource Center. Accessed May 12, 2022. https://coronavirus.jhu.edu/
    1. COVID Data Tracker. Centers for Disease Control and Prevention. Published March 28, 2020. Accessed May 12, 2022. https://covid.cdc.gov/covid-data-tracker
    1. Zhou P, Yang XL, Wang XG, et al. A pneumonia outbreak associated with a new coronavirus of probable bat origin. Nature. 2020;579(7798):270–273. doi:10.1038/s41586-020-2012-7 - DOI - PMC - PubMed
    1. Almubaid Z, Al-Mubaid H. Analysis and comparison of genetic variants and mutations of the novel coronavirus SARS-CoV-2. Gene Rep. 2021;23:101064. doi:10.1016/j.genrep.2021.101064 - DOI - PMC - PubMed
    1. Ramesh S, Govindarajulu M, Parise RS, et al. Emerging SARS-CoV-2 Variants: A Review of Its Mutations, Its Implications and Vaccine Efficacy. Vaccines. 2021;9(10):1195. doi:10.3390/vaccines9101195 - DOI - PMC - PubMed

Supplementary concepts