Impact of Beer and Nonalcoholic Beer Consumption on the Gut Microbiota: A Randomized, Double-Blind, Controlled Trial
- PMID: 35834180
- PMCID: PMC9776556
- DOI: 10.1021/acs.jafc.2c00587
Impact of Beer and Nonalcoholic Beer Consumption on the Gut Microbiota: A Randomized, Double-Blind, Controlled Trial
Abstract
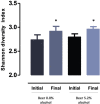
Gut microbiota modulation might constitute a mechanism mediating the effects of beer on health. In this randomized, double-blinded, two-arm parallel trial, 22 healthy men were recruited to drink 330 mL of nonalcoholic beer (0.0% v/v) or alcoholic beer (5.2% v/v) daily during a 4-week follow-up period. Blood and faecal samples were collected before and after the intervention period. Gut microbiota was analyzed by 16S rRNA gene sequencing. Drinking nonalcoholic or alcoholic beer daily for 4 weeks did not increase body weight and body fat mass and did not changed significantly serum cardiometabolic biomarkers. Nonalcoholic and alcoholic beer increased gut microbiota diversity which has been associated with positive health outcomes and tended to increase faecal alkaline phosphatase activity, a marker of intestinal barrier function. These results suggest the effects of beer on gut microbiota modulation are independent of alcohol and may be mediated by beer polyphenols.
Keywords: alcohol; beer; gut microbiota; nonalcoholic beer; polyphenols.
Conflict of interest statement
The authors declare no competing financial interest.
Figures


Similar articles
-
Association of Moderate Beer Consumption with the Gut Microbiota and SCFA of Healthy Adults.Molecules. 2020 Oct 17;25(20):4772. doi: 10.3390/molecules25204772. Molecules. 2020. PMID: 33080809 Free PMC article.
-
Simulated gastrointestinal digestion of beer using the simgi® model. Investigation of colonic phenolic metabolism and impact on human gut microbiota.Food Res Int. 2023 Nov;173(Pt 1):113228. doi: 10.1016/j.foodres.2023.113228. Epub 2023 Jul 4. Food Res Int. 2023. PMID: 37803545
-
Influence of moderate beer consumption on human gut microbiota and its impact on fasting glucose and β-cell function.Alcohol. 2020 Jun;85:77-94. doi: 10.1016/j.alcohol.2019.05.006. Epub 2019 Jun 12. Alcohol. 2020. PMID: 31201859
-
[Benefits of the beer polyphenols on the gut microbiota].Nutr Hosp. 2017 Oct 15;34(Suppl 4):41-44. doi: 10.20960/nh.1570. Nutr Hosp. 2017. PMID: 29156931 Review. Spanish.
-
Beer and Microbiota: Pathways for a Positive and Healthy Interaction.Nutrients. 2023 Feb 7;15(4):844. doi: 10.3390/nu15040844. Nutrients. 2023. PMID: 36839202 Free PMC article. Review.
Cited by
-
Physiological Mechanisms by Which the Functional Ingredients in Beer Impact Human Health.Molecules. 2024 Jun 29;29(13):3110. doi: 10.3390/molecules29133110. Molecules. 2024. PMID: 38999065 Free PMC article. Review.
-
The effects of moderate alcohol consumption on non-alcoholic fatty liver disease.Clin Mol Hepatol. 2023 Feb;29(Suppl):S261-S267. doi: 10.3350/cmh.2022.0393. Epub 2022 Dec 22. Clin Mol Hepatol. 2023. PMID: 36545707 Free PMC article. Review.
-
Oh my gut! Is the microbial origin of neurodegenerative diseases real?Infect Immun. 2023 Oct 17;91(10):e0043722. doi: 10.1128/iai.00437-22. Epub 2023 Sep 26. Infect Immun. 2023. PMID: 37750713 Free PMC article. Review.
-
Gut Microbiome and Lipidome Signatures in Irritable Bowel Syndrome Patients from a Low-Income, Food-Desert Area: A Pilot Study.Microorganisms. 2023 Oct 6;11(10):2503. doi: 10.3390/microorganisms11102503. Microorganisms. 2023. PMID: 37894161 Free PMC article.
-
Effects of moderate beer consumption on immunity and the gut microbiome in immunosuppressed mice.Biosci Microbiota Food Health. 2025;44(1):32-42. doi: 10.12938/bmfh.2024-045. Epub 2024 Aug 5. Biosci Microbiota Food Health. 2025. PMID: 39764488 Free PMC article.
References
-
- de Gaetano G.; Costanzo S.; Di Castelnuovo A.; Badimon L.; Bejko D.; Alkerwi A.; Chiva-Blanch G.; Estruch R.; La Vecchia C.; Panico S.; et al. Effects of moderate beer consumption on health and disease: A consensus document. Nutr Metab Cardiovasc Dis 2016, 26 (6), 443–467. 10.1016/j.numecd.2016.03.007. - DOI - PubMed
-
- Burton R.; Sheron N. No level of alcohol consumption improves health. Lancet 2018, 392 (10152), 987–988. 10.1016/S0140-6736(18)31571-X. - DOI - PubMed
- Collaborators G. B. D. A. Alcohol use and burden for 195 countries and territories, 1990–2016: a systematic analysis for the Global Burden of Disease Study 2016. Lancet 2018, 392 (10152), 1015–1035. 10.1016/S0140-6736(18)31310-2. - DOI - PMC - PubMed
-
- Costa R.; Negrao R.; Valente I.; Castela A.; Duarte D.; Guardao L.; Magalhaes P. J.; Rodrigues J. A.; Guimaraes J. T.; Gomes P.; Soares R.; et al. Xanthohumol modulates inflammation, oxidative stress, and angiogenesis in type 1 diabetic rat skin wound healing. J. Nat. Prod 2013, 76 (11), 2047–2053. 10.1021/np4002898. - DOI - PubMed
- Nozawa H. Xanthohumol, the chalcone from beer hops (Humulus lupulus L.), is the ligand for farnesoid X receptor and ameliorates lipid and glucose metabolism in KK-A(y) mice. Biochem. Biophys. Res. Commun. 2005, 336 (3), 754–761. 10.1016/j.bbrc.2005.08.159. - DOI - PubMed
- Costa R.; Rodrigues I.; Guardao L.; Rocha-Rodrigues S.; Silva C.; Magalhaes J.; Ferreira-de-Almeida M.; Negrao R.; Soares R. Xanthohumol and 8-prenylnaringenin ameliorate diabetic-related metabolic dysfunctions in mice. J. Nutr Biochem 2017, 45, 39–47. 10.1016/j.jnutbio.2017.03.006. - DOI - PubMed
Publication types
MeSH terms
Substances
LinkOut - more resources
Full Text Sources

