. 2022 Sep 1;323(3):F255-F271.
doi: 10.1152/ajprenal.00033.2022. Epub 2022 Jul 14.

Choline supplementation attenuates experimental sepsis-associated acute kidney injury

Affiliations

Choline supplementation attenuates experimental sepsis-associated acute kidney injury

Denise C Hasson et al. Am J Physiol Renal Physiol. .

Abstract

Acute kidney injury (AKI) is common in critically ill patients, and sepsis is its leading cause. Sepsis-associated AKI (SA-AKI) causes greater morbidity and mortality than other AKI etiologies, yet the underlying mechanisms are incompletely understood. Metabolomic technologies can characterize cellular energy derangements, but few discovery analyses have evaluated the metabolomic profile of SA-AKI. To identify metabolic derangements amenable to therapeutic intervention, we assessed plasma and urine metabolites in septic mice and critically ill children and compared them by AKI status. Metabolites related to choline and central carbon metabolism were differentially abundant in SA-AKI in both mice and humans. Gene expression of enzymes related to choline metabolism was altered in the kidneys and liver of mice with SA-AKI. Treatment with intraperitoneal choline improved renal function in septic mice. Because pediatric patients with sepsis displayed similar metabolomic profiles to septic mice, choline supplementation may attenuate pediatric septic AKI.NEW & NOTEWORTHY Altered choline metabolism plays a role in both human and murine sepsis-associated acute kidney injury (SA-AKI), and choline administration in experimental SA-AKI improved renal function. These findings indicate that 1) mouse models can help interrogate clinically relevant mechanisms and 2) choline supplementation may ameliorate human SA-AKI. Future research will investigate clinically the impact of choline supplementation on human renal function in sepsis and, using model systems, how choline mediates its effects.

Keywords: acute kidney injury; central carbon metabolism; choline; metabolomics; sepsis.


Conflict of interest statement

No conflicts of interest, financial or otherwise, are declared by the authors.

Figures

None
Graphical abstract
Figure 1.
Figure 1.
Choline and central carbon metabolic pathways. A visual representation of metabolite interrelation, with red arrows denoting significantly different plasma metabolites and yellow denoting significantly different urine metabolites, is shown. The “h” in the red arrow signifies human plasma. Choline, dimethylglycine, pyruvate, and succinate are elevated in both human and mouse plasma. Numbers denote the enzymes interrogated for differences in tissue gene expression and correspond to numbering in Fig. 7 and Supplemental Fig. S8. CDP, cytidine diphosphate; CoA, coenzyme A; SA-AKI, sepsis-associated acute kidney injury.
Figure 2.
Figure 2.
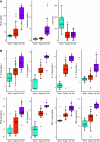
Plasma and urine markers of injury and inflammation. A: plasma blood urea nitrogen (BUN) and creatinine were elevated in mice with sepsis-associated acute kidney injury (SA-AKI) compared with sepsis and sham-operated (sham) mice. Urine output (UOP) was lower in mice with sepsis and SA-AKI than sham mice but did not differ between the two. B: all eight inflammatory cytokines were significantly elevated in mice with SA-AKI compared with those with sepsis, and septic mice were likewise higher than sham mice. *P < 0.05 comparing SA-AKI with sepsis; #P < 0.05 comparing sepsis with sham. n = 16 for sham mice, 22 for septic mice, and 12 for SA-AKI mice. The lower and upper hinges of the box represent 25th and 75th percentiles with the line transecting the box representing the median. Whiskers extend up and down from the box to the value at most 1.5 times the interquartile range. Points are overlaid to represent individual measurements and allow for direct assessment of data variability. IFNg, interferon-γ; IL, interleukin; MIP-1α, macrophage inflammatory protein-1α; TNF-α, tumor necrosis factor-α; KC, keratinocyte-derived chemokine.
Figure 3.
Figure 3.
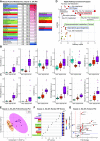
Mouse plasma metabolomic analysis comparing sepsis with sepsis-associated acute kidney injury (SA-AKI). A: statistically different plasma metabolites ranked by priority score (the product of fold-change and negative log of the false discovery rate-adjusted P value). Pathway assignments are color coded. B: plasma metabolites associated with central carbon metabolism had increased abundance in SA-AKI compared with septic mice. C: plasma metabolites associated with choline metabolism had increased abundance in SA-AKI compared with septic mice. D: MetaboAnalyst pathway analysis identified multiple pathways that differed in septic mice based on plasma metabolite levels. The pathway impact on the x-axis was calculated from pathway topology analysis, which accounts for how connected that pathway is to other cellular pathways. The y-axis is the negative log-adjusted P value from the quantitative enrichment analysis. E: partial least squares discriminant analysis (PLS-DA) score plot showing good discrimination between sepsis and SA-AKI, with significant variability within the SA-AKI group. F: variable importance in projection (VIP) scores, calculated by PLS-DA analysis of plasma metabolomics, ranked metabolites by relative contribution to group difference. Many of the metabolites belong to central carbon and choline metabolism and are color coded to reflect such pathway associations. G: volcano plot displaying plasma metabolites of interest, with fold-change on the x-axis and the negative log of the false discovery rate-adjusted P value on the y-axis. *P < 0.05, sepsis vs. SA-AKI; #P < 0.05, sepsis vs. sham. n = 16 for sham mice, 22 for septic mice, and 12 for SA-AKI mice. au, arbitrary units; BCAA, branched-chain amino acid; FAO, fatty acid oxidation; TCA cycle, tricarboxylic acid cycle.
Figure 4.
Figure 4.
Mouse urine metabolomic analysis comparing sepsis with sepsis-associated acute kidney injury (SA-AKI). A: statistically different urine metabolites ranked by priority score. Pathway assignments are color coded. B: urinary metabolites related to choline metabolism were differentially increased in sepsis but fell significantly in SA-AKI. C: likewise, metabolites associated with tryptophan/nicotinamide adenine dinucleotide (NAD)+ metabolism were increased in sepsis but decreased in SA-AKI. D: metabolites associated with stress responses had decreased urinary abundance in SA-AKI. E: MetaboAnalyst pathway analysis identified multiple pathways that differed between mice with sepsis and SA-AKI based on urine metabolite levels. F: partial least squares discriminant analysis (PLS-DA) score plot showing the overlap between sepsis and SA-AKI, this time with close association of the SA-AKI group. G: PLS-DA variable importance in projection (VIP) scores identified urine metabolites that contributed the most to group differences. H: volcano plot displaying urine metabolites of interest. *P < 0.05, sepsis vs. SA-AKI; #P < 0.05, sepsis vs. sham. n = 16 for sham mice, 22 for septic mice, and 12 for SA-AKI mice. au, arbitrary units; BCAA, branched-chain amino acid; CoA, coenzyme A; FAO, fatty acid oxidation.
Figure 5.
Figure 5.
Pediatric sepsis cohort clinical data. Plasma blood urea nitrogen (BUN) and creatinine were elevated in pediatric sepsis-associated acute kidney injury (SA-AKI) compared with pediatric sepsis or control patients. Urine output (UOP) was lower in patients with SA-AKI compared with sepsis but did not differ significantly between patients with sepsis and control patients. Patients with sepsis had higher pediatric risk of mortality score III (PRISM) scores compared with control patients but not compared with those with SA-AKI. Patients with SA-AKI had more vasopressor days and hospital length of stay (LOS) compared with patients with sepsis. Intensive care unit (ICU) LOS difference did not meet statistical significance. *P < 0.05 comparing SA-AKI vs. sepsis; #P < 0.05 comparing sepsis vs. controls. n = 5 for pediatric controls, 13 for pediatric sepsis, and 7 for pediatric SA-AKI.
Figure 6.
Figure 6.
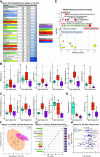
Human plasma metabolomic analysis comparing sepsis with sepsis-associated acute kidney injury (SA-AKI). A: statistically different plasma metabolites ranked by priority score. Pathway assignments are color coded. B: pathway analysis identified altered choline and central carbon metabolism in SA-AKI, similar to murine plasma analysis. C−E: plasma metabolites associated with central carbon metabolism (C), choline metabolism (D), and associated with renal failure (E) all had increased abundance in SA-AKI compared with sepsis. F: partial least squares discriminant analysis (PLS-DA) score plot showing complete discrimination between sepsis and SA-AKI, with close association of the sepsis group. G: PLS-DA variable importance in projection (VIP) scores identified metabolites that contributed the most to group difference, again highlighting choline, central carbon, and renal failure metabolites. H: volcano plot displaying plasma metabolites of interest. *P < 0.05, SA-AKI vs. sepsis; #P < 0.05, sepsis vs. controls. n = 5 for pediatric controls, 13 for pediatric sepsis, and 7 for pediatric SA-AKI. au, arbitrary units; TCA cycle, tricarboxylic acid cycle.
Figure 7.
Figure 7.
Gene expression analysis of kidney and liver tissue. A: kidney tissue expression of genes associated with inflammation and injury. Expression of interleukin (IL)-6 was dramatically increased in sepsis-associated acute kidney injury (SA-AKI) over sham and septic mice. Expression of tumor necrosis factor (TNF)-α was significantly increased in sepsis compared with sham-operated (sham) mice, but mice with SA-AKI did not differ from septic mice. Kidney neutrophil gelatinase-associated lipocalin (NGAL) and kidney injury molecule (KIM)-1 showed similar patterns with increased gene expression in septic compared with sham mice. B: expression of the choline degradation enzymes Choline dehydrogenase (Chdh; in the kidney and liver) and betaine-homocysteine methyltransferase (Bhmt; in the liver) were decreased in mice with SA-AKI compared with septic or sham mice. C: expression of the glycerophospholipid enzymes cytosolic Pla2g4 (in the kidney and liver) and secretory Pla2g5 (in the kidney) were decreased in mice with SA-AKI, but secretory Pla2g5 (in the liver) and glycerophosphocholine phosphodiesterase 1 (Gpcpd1; in the liver) were increased in mice with SA-AKI compared with septic mice. D: flavin-containing monooxygenase 3 (Fmo3) showed decreased liver gene expression in septic compared with sham mice. #P < 0.05 for septic mice vs. sham mice; *P < 0.05 for SA-AKI mice vs. septic mice. n = 6 for sham, 9 for sepsis, and 9 for SA-AKI. Pla2, phospholipase A2.
Figure 8.
Figure 8.
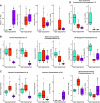
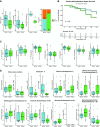
Effect of choline administration on sepsis-associated acute kidney injury (SA-AKI) in the mouse model. A: plasma blood urea nitrogen (BUN), creatinine, and urine neutrophil gelatinase-associated lipocalin (NGAL) levels were lower in septic mice given intraperitoneal choline compared with septic mice given intraperitoneal saline (vehicle) after cecal ligation and puncture (CLP). The incidence of AKI trended strongly toward statistical significance. B: Kaplan–Meier curve showing that choline administration did not improve sepsis survival. C: choline did not change cytokine levels. D: choline administration did not change kidney or liver tissue gene expression of markers of kidney injury and inflammation or key enzymes related to choline metabolism. *P < 0.05 for choline supplementation vs. vehicle treatment. For A, n = 27 mice/group for plasma analyses and 7 mice/group for urine analyses. For B, n = 20 mice in the choline-treated group and 14 mice in the saline-treated group. For C, n = 17/group. For D, n = 12 mice/group. IFNg, interferon-γ; IL, interleukin; KC, keratinocyte-derived chemokine; MIP-1α, macrophage inflammatory protein-1α; TNF-α, tumor necrosis factor-α.

References

    1. Kaddourah A, Basu RK, Bagshaw SM, Goldstein SL; AWARE Investigators. Epidemiology of acute kidney injury in critically ill children and young adults. N Engl J Med 376: 11–20, 2017. doi: 10.1056/NEJMoa1611391. - DOI - PMC - PubMed
    1. Bagshaw SM, Uchino S, Bellomo R, Morimatsu H, Morgera S, Schetz M, Tan I, Bouman C, Macedo E, Gibney N, Tolwani A, Oudemans-van Straaten HM, Ronco C, Kellum JA. ; Beginning and Ending Supportive Therapy for the Kidney (BEST Kidney) Investigators. Septic acute kidney injury in critically ill patients: clinical characteristics and outcomes. Clin J Am Soc Nephrol 2: 431–439, 2007. doi: 10.2215/CJN.03681106. - DOI - PubMed
    1. Hoste EAJ, Lameire NH, Vanholder RC, Benoit DD, Decruyenaere JMA, Colardyn FA. Acute renal failure in patients with sepsis in a surgical ICU: predictive factors, incidence, comorbidity, and outcome. J Am Soc Nephrol 14: 1022–1030, 2003. doi: 10.1097/01.asn.0000059863.48590.e9. - DOI - PubMed
    1. Bagshaw SM, George C, Bellomo R; ANZICS Database Management Committee. Early acute kidney injury and sepsis: a multicentre evaluation. Crit Care 12: R47, 2008. doi: 10.1186/cc6863. - DOI - PMC - PubMed
    1. Bouchard J, Acharya A, Cerda J, Maccariello ER, Madarasu RC, Tolwani AJ, Liang X, Fu P, Liu Z-H, Mehta RL. A prospective international multicenter study of AKI in the intensive care unit. Clin J Am Soc Nephrol 10: 1324–1331, 2015. doi: 10.2215/CJN.04360514. - DOI - PMC - PubMed

Publication types